Table of Contents
Table of Contents
Executive Summary
DEBATES OVER POVERTY AND INEQUALITY—high and low incomes; the gap between rich, poor, and everyone else—have long raged, but they have become frequent again in the past half decade with Occupy Wall Street protests, a best-selling book by a French economist and others, as well as responses to the same. The debates are often framed in economic-only terms: More interventionist leaning academics, politicians, and others assert that inequality poses a danger to societal stability and is economically problematic. More market-friendly analysts have found and argue that poverty and inequality are often mischaracterized, with the data misinterpreted and misunderstood. Some would argue that inequality in particular (though not poverty) is inevitable and serves a useful purpose, by providing an incentive to prosper.
Wherever one falls on the inequality and poverty debates, however, a review of the relevant discussion shows a different sort of gap: family formation and family “fracturing” are little discussed in Canada. This appears in distinct contrast to the United States.
This gap is problematic. The inequality debates, and related debates such as those on poverty, insofar as they approach the subject of family, do so only via economic analysis, thus implicitly assuming that a material end (more or less inequality) stems from a material cause (economic dynamics).
Typical approaches thus leave out a wide swath of human behaviour and non-material, noneconomic causes, despite what is revealed in the statistics. For example, a drug addict will not necessarily be cured via economic policy—a material remedy—because the cause of the addiction may not be material in nature; a rich person can still be an alcoholic. Thus the core problem may be psychological or social in nature.
This reality has implications for policy research and policy recommendations, but with the focus in the public debates often only on economic data—a growing or shrinking economy, or higher or lower tax rates, or more or less government redistribution—the debates on inequality and poverty are unnecessarily limited.
The aim of this paper is to look outside the economic data. Once one looks at family formation and fracturing over the past ninety years and in the past half-century in particular, these non-economic causes become obvious.
After-Tax Median Incomes
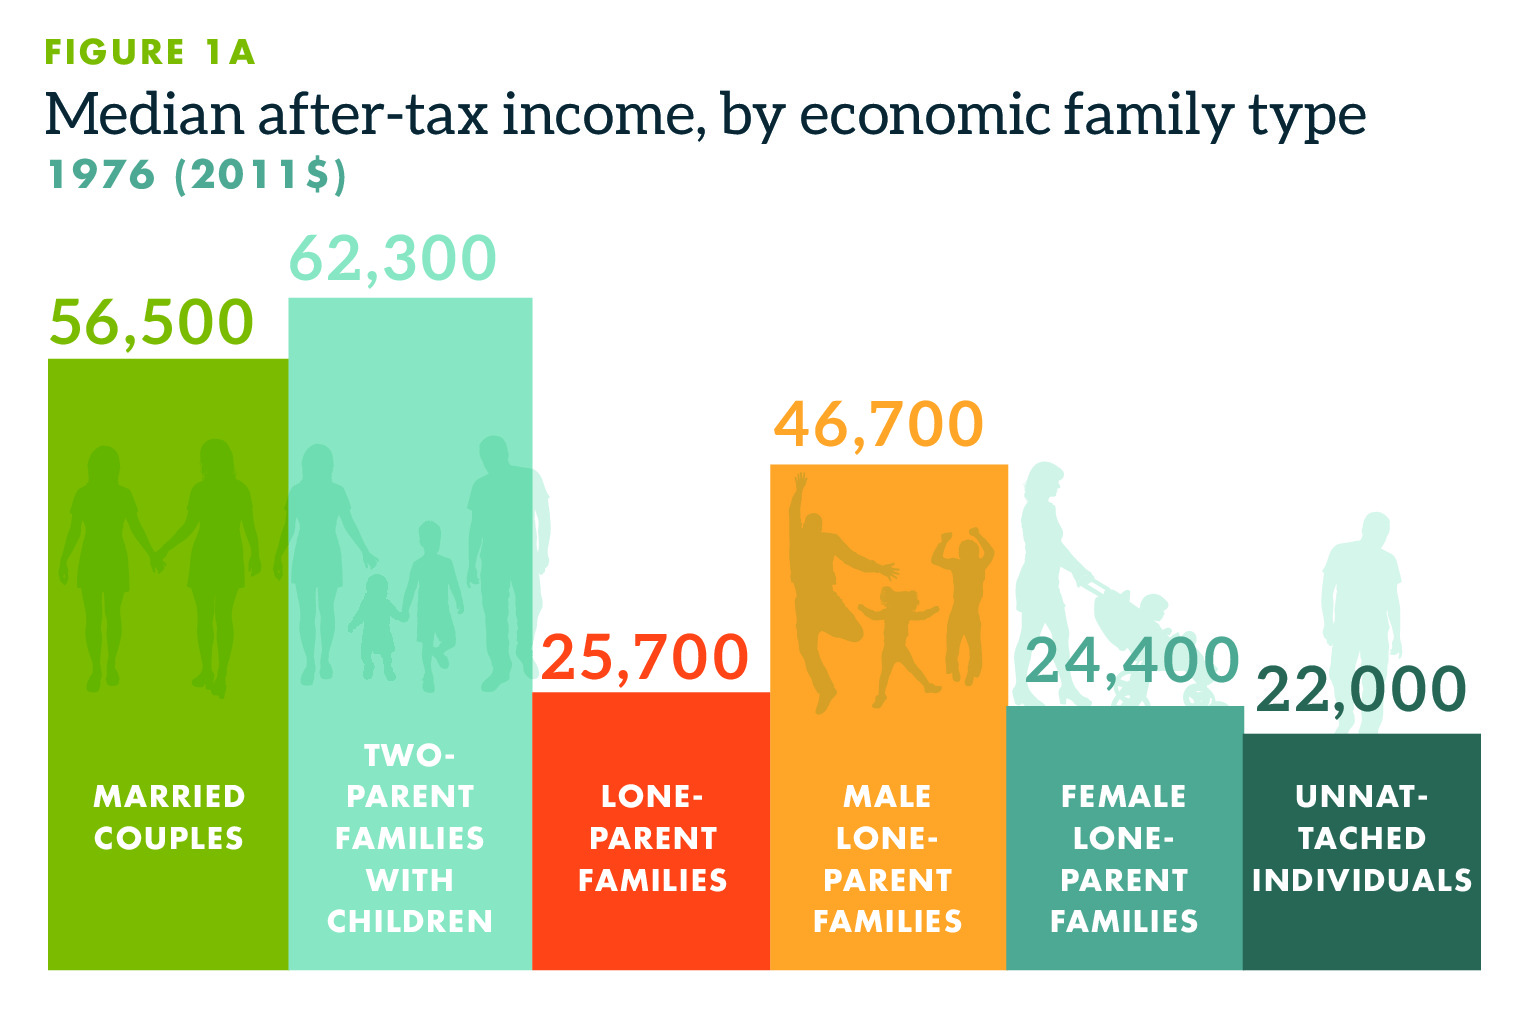
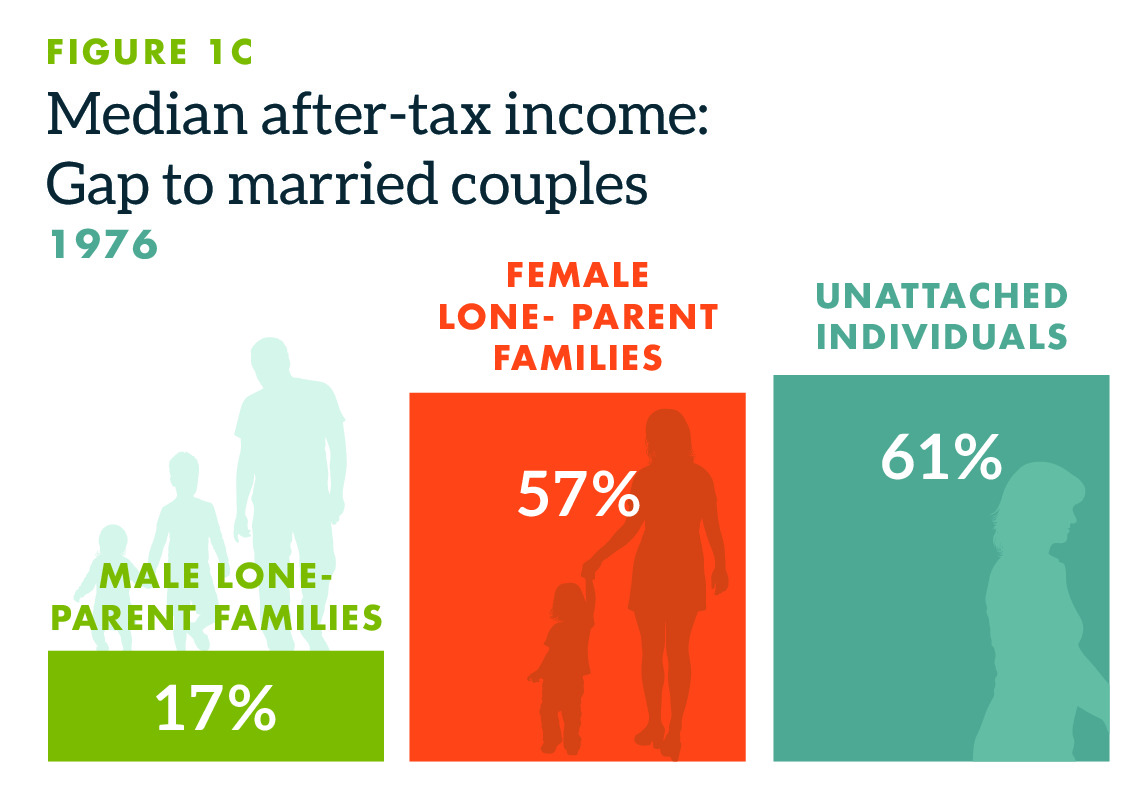
In 1976, two-parent families with children demonstrated the highest after-tax median income ($62,300) followed by married couples with no children ($56,500). That was followed by loneparent male families at $46,700, and then female lone-parent families ($24,400) and unattached individuals ($22,000).
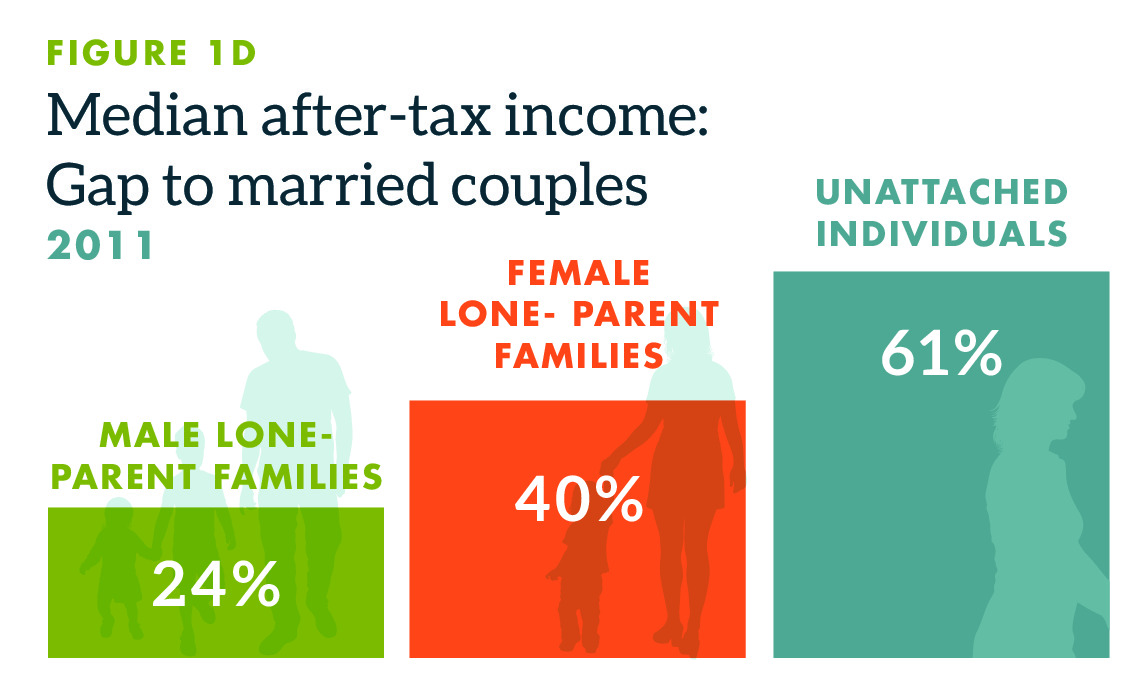
In 2011, the pattern was much the same with two-parent families with children showing the highest median after-tax income ($83,600) followed by married couples with no children ($66,500). That was followed by lone-parent male families at $50,700, and then female lone-parent families ($39,900)— the one cohort that showed a decreasing gap vis-à-vis others—and unattached individuals ($25,800) (all figures adjusted to 2011 dollars to account for inflation).
Family Fracturing Can Affect Poverty and Inequality Data
Those after-tax incomes by economic family type matter to the inequality debate, and also to poverty, because insofar as the higher-income family cohorts fracture, the potential exists for more poverty (and possibly more inequality) even if overall economic opportunities have not changed.
This in fact is demonstrated by a look at family statistics over the decades. With available data sets, it turns out that over ninety-five years the most dramatic change in marital status was the increase in divorced or separated. That cohort rose from just 0.1 percent in 1921 to 9.0 percent of the population by 2016. That can matter to poverty statistics (Executive Summary Figure A) given that it is often more expensive to maintain two households than one.
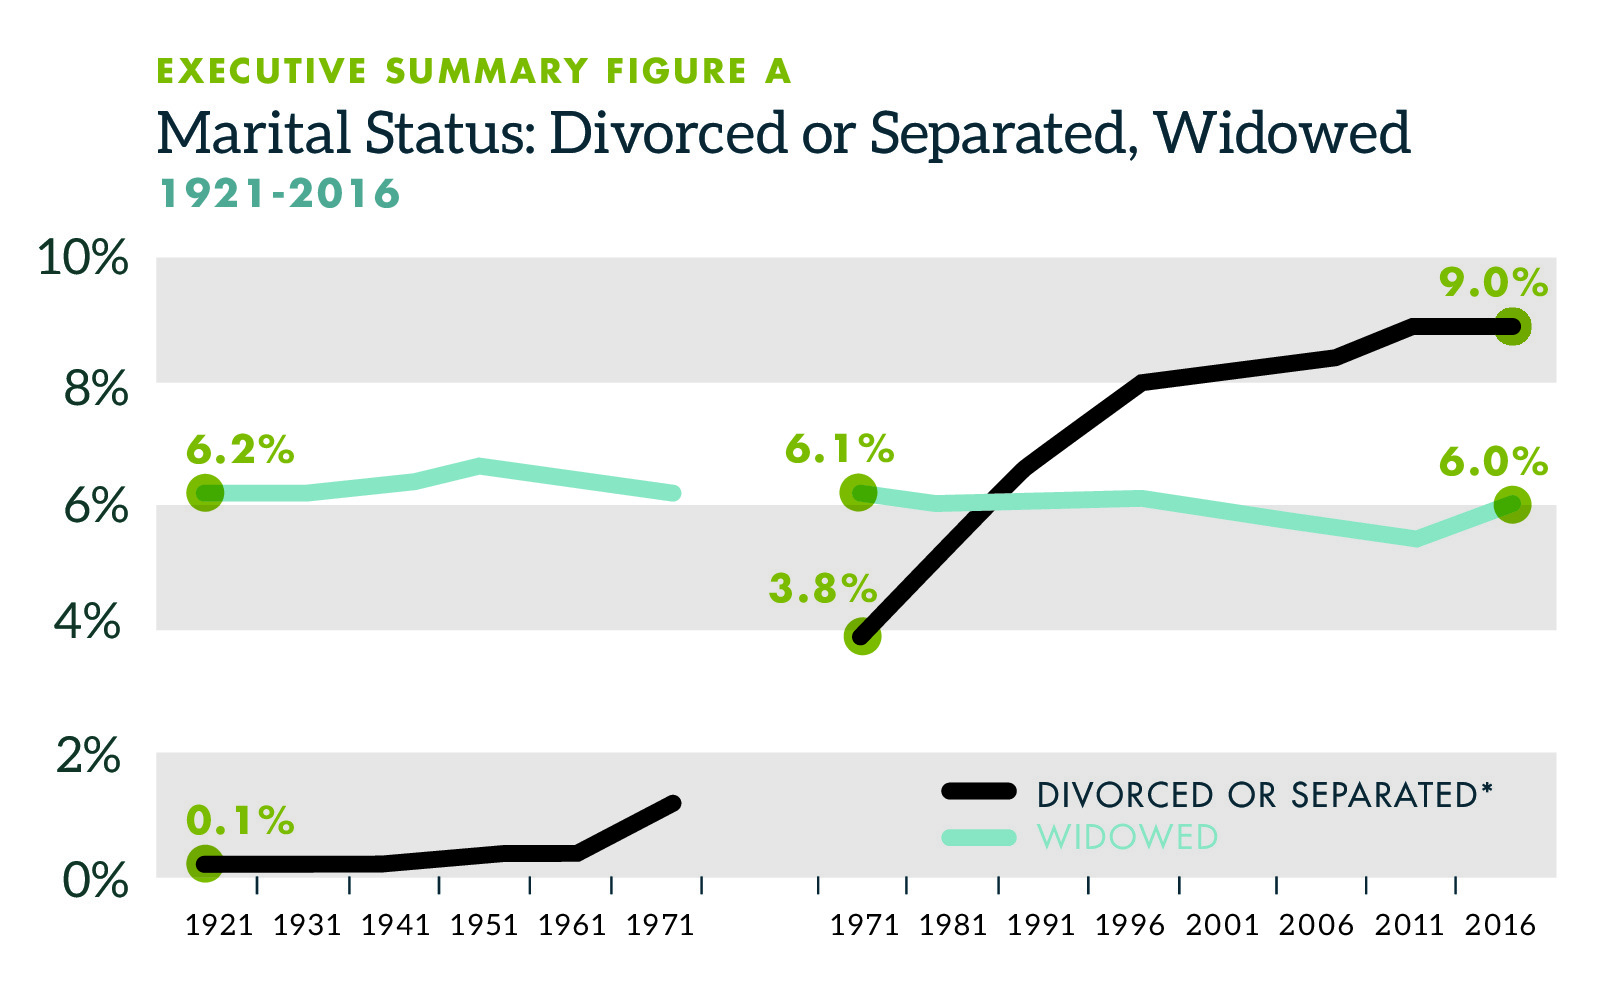
Sources: Statistics Canada 2017b; 2017c. *“Separated” is included in “married” statistics 1921–1971. The “split” in the lines is because the data underlying this measure come from two separate sources, the main difference being that more categories are available in the 1971–2016 sources. In an effort to ensure readers are aware of the different data sources, the lines are separate in this and other charts where appropriate.
Family Formation and Children: Trends 1976–2014
1 1 The most recent statistics were used in this report. Some data ends in 2011 and other in 2014 A further analysis of a different data set, dating from 1976 onward, also has ramifications for inequality and poverty. Between 1976 and 2014, the composition of the Canadian family changed dramatically
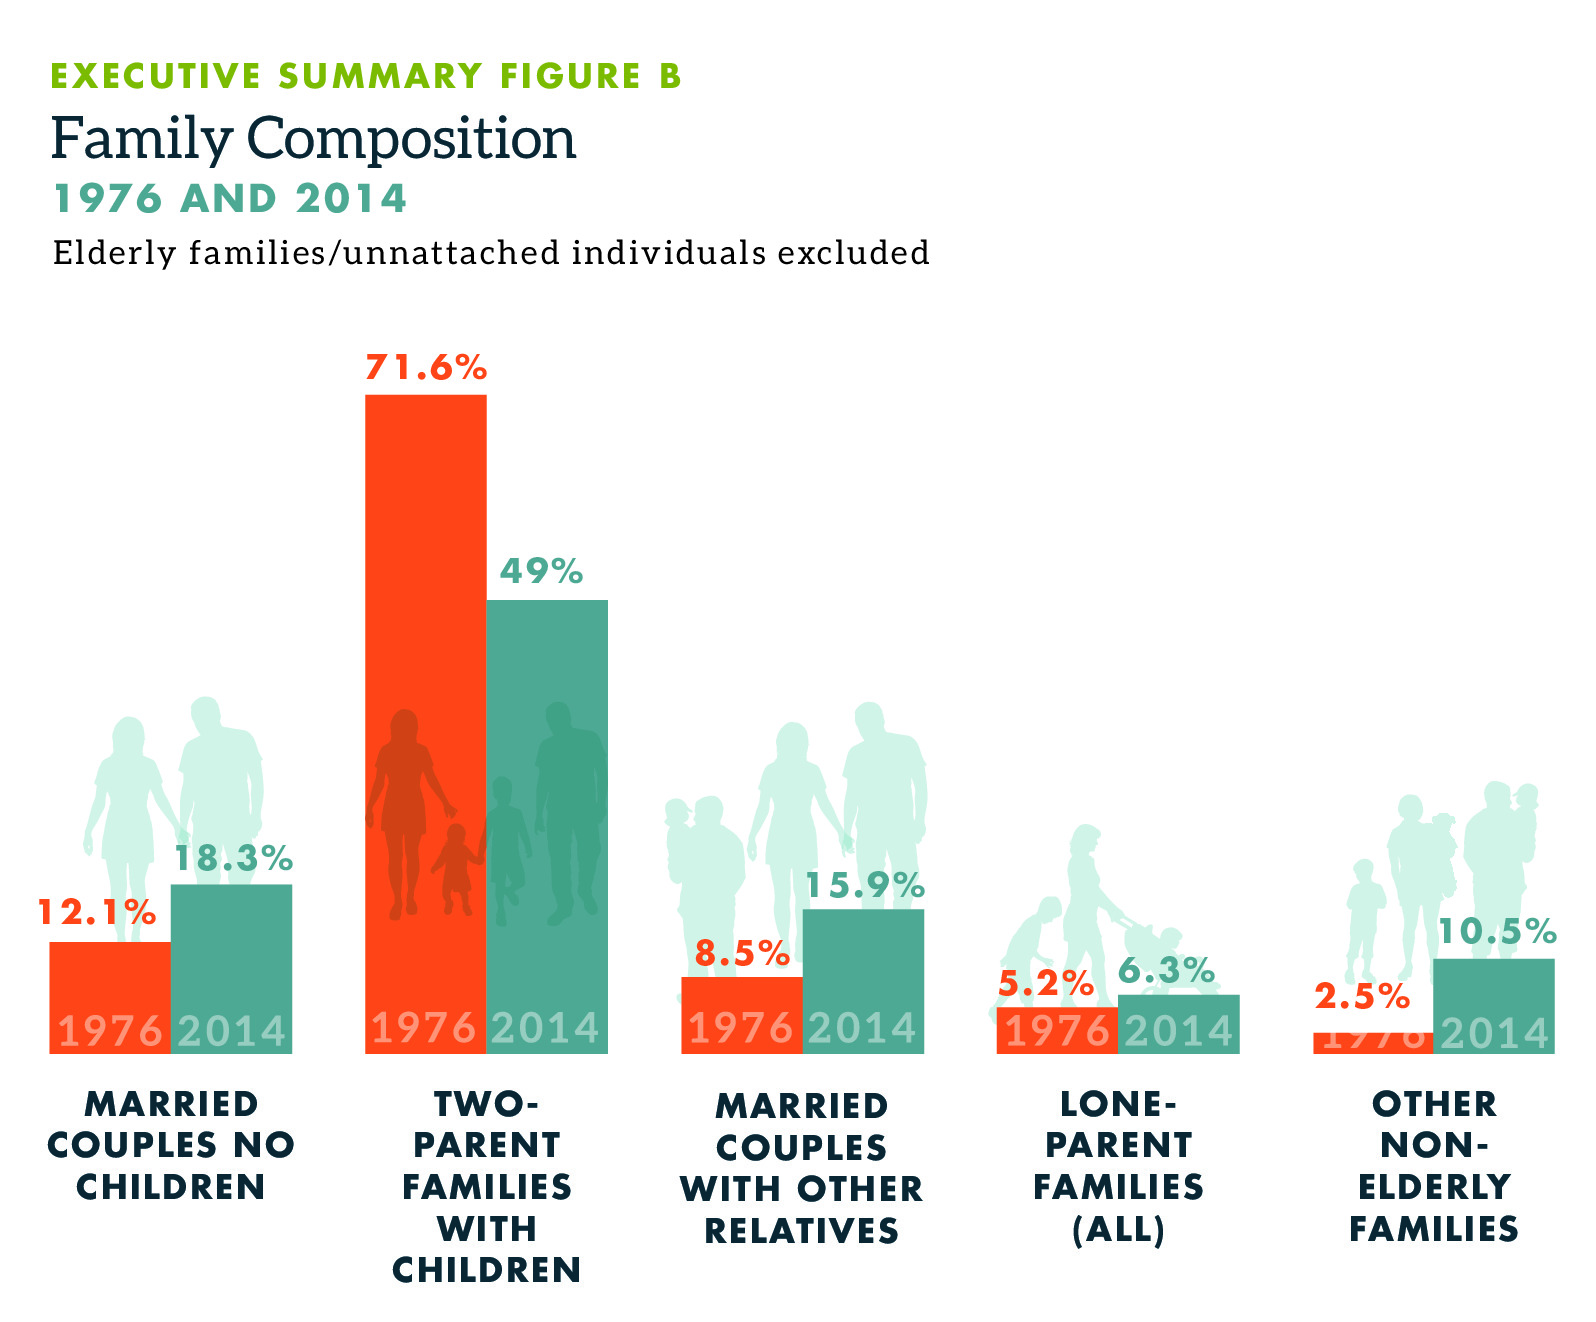
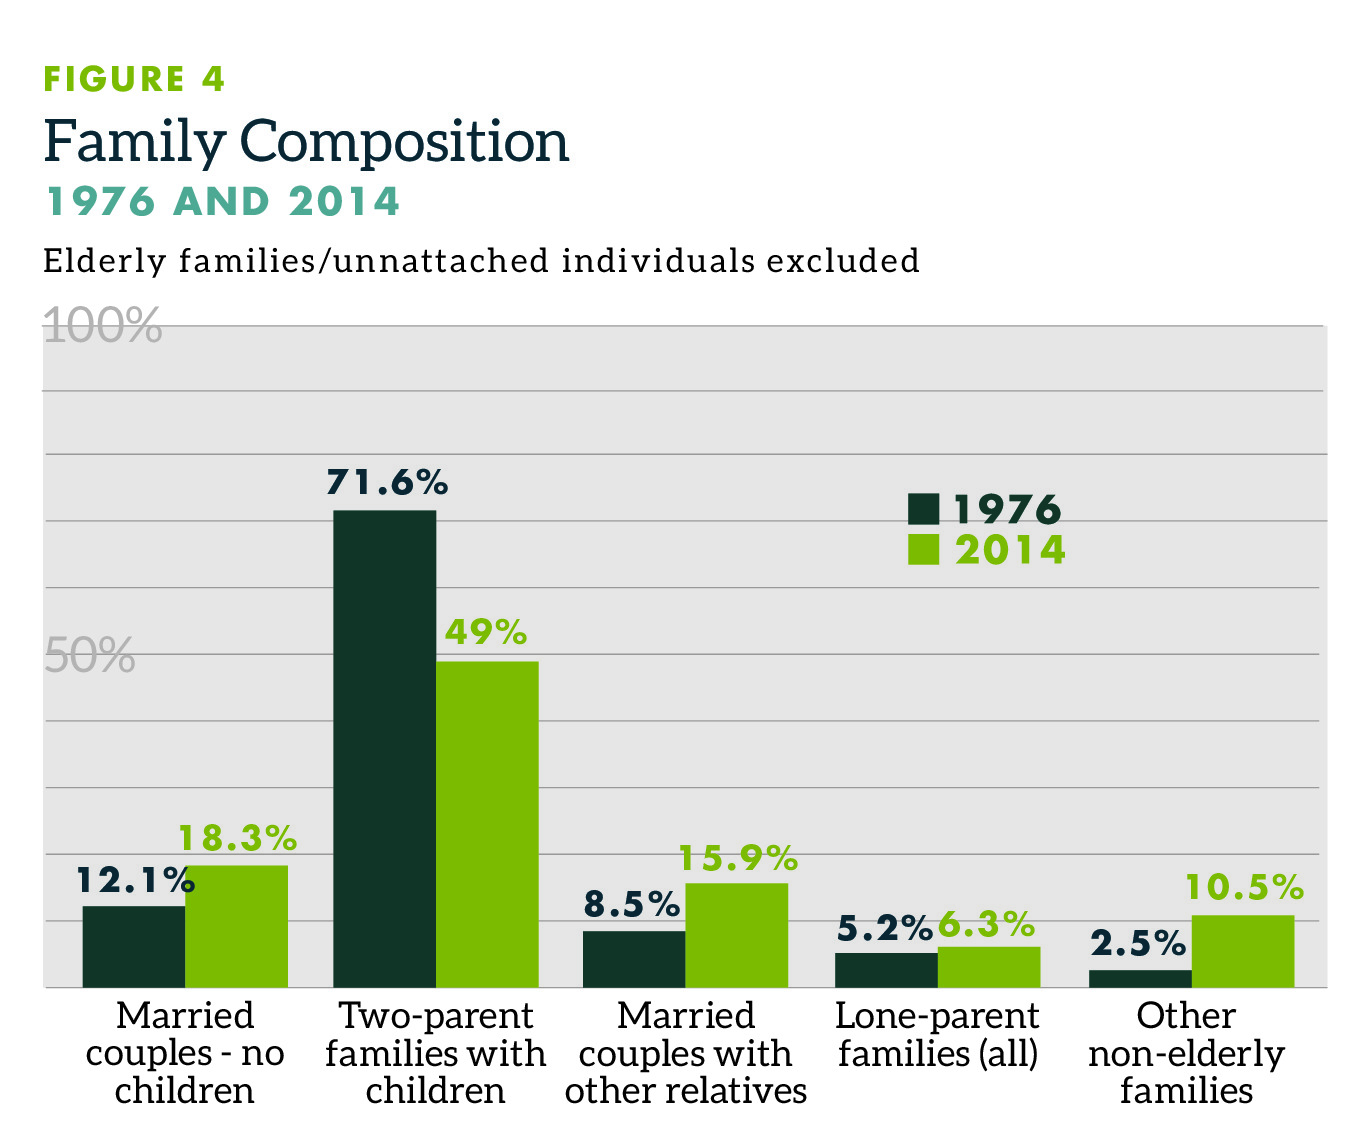
Whereas in 1976, 71.6 percent of (non-elderly) families were two parent families with children; that percentage dropped to 49.0 percent as of 2014. There was a dramatic rise in the proportion of lone-parent families. That matters to poverty and inequality statistics given that two-parent families with children displayed the highest after-tax median income in both 1976 and in 2014 (Executive Summary Figure B).
The Importance of Family Dynamics: An Issue in the United States Since the 1960s
Narrow, focused work on poverty or inequality from an economic perspective is useful in its own right. Nonetheless, it might be helpfully supplemented by attention to more of the above data, which displays a trend to family fracturing and different types of families over the decades. 2 2 It may be useful to note that lone-parent families are not always the product of separation, divorce or death. They increasingly result from choice—from never having married in the first place. No judgment is implied but as will be noted later in the paper, this cohort’s increase matters to poverty and inequality statistics. Here, it appears American academics and public intellectuals have long pondered how family fracturing might lead to later social and economic problems. This focus appears less often in Canada, especially in any memorable high-profile analyses and books.
In the United States, such work in the past half century includes that of Daniel Patrick Moynihan in 1965. Later a Democratic senator from New York, Moynihan, a sociologist by trade and a then assistant secretary at the US Department of Labor, authored a report on black Americans, considering the context of family structure. More recent work that addresses the topic of non-material causes for individual, family, and community woes in recent decades (including inequality where it is assumed to be a problem, and poverty) include the importance of social capital as pointed to by Francis Fukuyama (1995; 1999) and Robert Putnam (2005); James Q. Wilson (2002) on how culture has influenced families and weakened them as a force for stability; Jeremy Greenwood and Nezih Gunner (2009) on how technology has affected family formation in the United States since the Second World War; Deirdre McCloskey’s work on why economics cannot explain the modern world (McCloskey 2010) but why ideas can (McCloskey 2016); and Charles Murray’s 2012 book that identifies four factors as influential to a “good life” including economic success: marriage, industriousness, honesty, and religiosity (Murray 2012).
In contrast to the United States, where such reports and books have been a staple of public policy debate from Moynihan onward, major Canadian work seems focused only on the economics of such debates. As an example, just after the Labor Department published Moynihan’s 1965 work, which delved into the danger of a continued fracturing of the black family unit, three years later, Canada’s statistical agency published a 356-page analysis on the incomes of Canadians. Unlike the Moynihan report, family composition is touched on only relative to identifying who was poorest (widows and single-parent families headed by females). No mention is made of family dynamics as a possible cause for poverty or warnings about the future based on current statistical trends (Poduluk 1968, 191).
This appears to be a chronic gap in Canada, which opens up the possibility for an additional avenue for research and for more correctly-identified causes. Moreover, this holds promise for better understanding some potentially overlooked causes for poverty and inequality in Canada.
Introduction
OVER THE PAST DECADE, a variety of economists, other social scientists, journalists, and politicians have discussed inequality and poverty with a sense of urgency. They have often done so in only material terms—that is, with reference to economic data and without considering social, cultural, and faith factors that may influence what leads to such data. 3 3 Most academic studies do correct for changes in family composition on the cost of living but in a formulaic manner. However, that is different from considering what leads to the differences in family structures.
For example, French economist Thomas Piketty gained fame in 2013 with his book Le capital au XXI siècle, translated in 2014 as Capital in the Twenty-First Century, by alleging that any sign of growing inequality around the world was ipso facto negative. In response, others have argued either that, depending on the country, cohort, or reason for changes in inequality, inequality is not necessarily a significant problem, or that Piketty misinterpreted the data.
On the latter point, for example, in Canada, a number of analysts have noted that most people will, over their lifetime, move into a higher income cohort because of the normal career progression for most people and thus, in the most extreme cases, away from poverty. A twenty-year-old will (unless already a wealthy entrepreneur) necessarily be in the bottom fifth of income earners. Someone in their peak earning years (in their forties and fifties) may be in a higher cohort. This difference only makes sense if few people at fifty are at the same point in their careers and incomes as they were at age twenty. Thus, the argument goes, the progress of individuals over their lives must be taken into account and not just “cohorts” as if the people in those were always the same individuals.
In addition, the same economists, market-friendly ones in many cases, have also noted that inequality is inevitable. This is a commonsense proposition to which no serious scholar could object unless they were committed to utter equality of outcomes in incomes, that is, that every person or family should earn only the same income and no more. The same economists also note the possibility that inequality can act as a spur to self-improvement, productivity, and economic growth. That is, individuals who realize they are falling behind their friends in possible financial options in life (home, vacations, lifestyle) may choose to increase their education or other skills or work extra hours.
The Focus of This Study: Overlooked Factors in Inequality and Poverty
This author is sympathetic with the latter arguments: lifetime measurements matter; inequality is inevitable outside of a command-and-control society, and even there it is merely masked; inequality can act as a “prompt.” All such analyses give a more fulsome understanding of inequality. Nonetheless, the ongoing poverty and inequality debates often discuss the economic data in isolation. Less attention appears to be given to possible causes of increased poverty, or increased inequality and to why those causes might be independent of economic forces or why the actual causes might be resistant to economic and policy “fiddling.”
That lack of attention to non-material causes is problematic: As an example, consider a household with $50,000 in income from one earner that then splits into two homes immediately skews the lower-income data. A two-household family each living on $25,000 makes it appear as if lower-income households have increased as a result of economic forces even though the economic opportunities have not changed—except one should expect poverty statistics to increase when one income now supports two households rather than one.
Thus, to grasp whether much of the recent literature details such social causes of inequality and poverty, this study reviews:
- the inequality and poverty debates—the former being more “high profile” in recent years and in public policy discussions;
- statistics in Canada on family formations and changes;
- trends on family formation;
- the rise of single-family households;
- literature in Canada and the United States for evidence of the discussion of social reasons for poverty and inequality; and
- thoughts on what, if anything, can be done about the social factors that may lead to inequality and poverty.
Not all private problems are necessarily material in origin.
Section 1: Issues and Gaps in Work on Inequality
What Is “Inequality”?
The concept of inequality is generally used to refer to differences or gaps between the living standards of particular groups, most normally the affluent versus low-income groups. While the principal interest in inequality debates is differences in the standard of living, the most common measures of inequality pertain to differences in measured income and/or wealth (Sarlo et al., 2015).
A number of measures are commonly employed to measure and communicate inequality. The standard approach to measuring economic inequality is to examine differences in the incomes of individuals, families, or households within a specified region in a specified time period. Income inequality itself can be measured in a number of ways. Arguably the most common methods employed are quintile or decile shares, and the Gini coefficient (World Bank 2015; CIA 2015).
Named after the Italian statistician Corrado Gini, the Gini coefficient measures the inequality among values of a given frequency distribution, income levels for example. According to the Gini coefficient, a score of 0 would indicate that the measured cohort is perfectly equal (and on income measurements, that everyone earns the exact same income). As an example, imagine a cohort of just five people who each earn $50,000. The Gini coefficient for that cohort would be 0, an example of perfect equality.
On the opposite end, a Gini score of 1.0 would indicate a maximum level of inequality, where one person had all the income (or wealth if that was the measurement) and everyone else earned no income (or had no wealth). A score of 1.0 would be statistically impossible, though one can imagine small cohorts that might approach it. In the hypothetical example of the five income earners above, imagine if one person earned $10 million annually while the other four earned just $10,000 each; that would still not result in a Gini coefficient of 1.0, but it would certainly be close.
Another popular method by which to measure and present inequality is by comparing a specific group of individuals, families, or households at the top of the income (or wealth) distribution against the same-sized group at the bottom. This entails comparing the income of the top 10 percent (decile analysis), 20 percent (quintile analysis), or 25 percent (quartile analysis) against its comparable group at the bottom of the income distribution.
Finally, recent work by economists such as Thomas Piketty (Capital in the Twenty-First Century) relies on a variation of the decile/quintile/quartile analysis presented above (Piketty 2014). This variant examines the share of income claimed by a specific group—usually the top 10 or 20 percent—as a share of the total income (or wealth) available.
Selected Debates Over Inequality
Those who argue that inequality is a problem with social consequences include social epidemiologist Richard Wilkinson (2009) and economists such as Thomas Piketty, Paul Krugman and Joseph Stiglitz (Piketty 2014; Krugman 2013; Stiglitz 2012). In Canada, one of the more widely published economists on the matter is Miles Corak (2004; 2006; 2012); Corak et al. (2014) have expressed concern that increased inequality is economically problematic, including for children. Thomas Lemieux and W. Craig Riddell (2015, 132) have focused on (and found) that “executives and others working in the financial and business-services sectors have been driving the growth in top incomes” and also noticed that “the oil and gas sector has also played an important role in income growth at the top.” Kelly Foley and David Green (2015, 348) note “that directing more resources toward university education would benefit children from middle- and upper-income households the most and could in fact increase inequality.” Andrew Heisz and Brian Murphy (2015, abstract) found that “taxes and transfers play an important role in reducing income inequality in Canada.” Kevin Milligan and Michael Smart (2015) found that expectations that higher taxes on the wealthy should reduce inequality should be modified. They noted such expectations will turn out to be unfulfilled given that high-income earners might move from a higher tax jurisdiction or use other legal tax reduction strategies. Keith Banting and John Myles (2015) offer “three frames” by which to analyze inequality: “an historic antipoverty frame, a more recent top-1-percent frame, and a still contentious middle-class frame.” They assert that “serious constraints” (established policy norms) and “the unequal representation of economic interests in our political system” prevent more redistribution from being considered. In essence, Banting and Myles blame the middle class for aligning their interests with the wealthy rather than the poor and thus preventing additional, higher taxes and additional redistribution.
Others note that inequality can often be misrepresented and/or misunderstood and that the presumed data and issues surrounding inequality lack nuance or are frankly in error. Some of the authors in Canada who have explored this include Wulong Gu and Ambrose Wong (2010), Philip Cross (2014), Phillip Magness and Robert Murphy (2014), Charles Lammam et al. (2016) Donald Boudreaux et al. (2016), and Christopher Sarlo (2017). Lammam et al. (2016) have noted that when examined over a lifetime, most people move up from one cohort to another; Sarlo (2017, 16) has found that when examining wealth (as opposed to income) from 1970 to 2012, that inequality has decreased. Yet another work, one to which this author contributed research (Clemens et al. 2016), noted that inequality should also be placed in the context of whether income and wealth was accumulated through honest means (the creation of a good or service in an open market) or cronyism or theft (Papa Doc Duvalier as an example).
A Review of the Debates and What’s Missing
For the purposes of this paper, Cross’s work in particular—a review of Piketty’s Capital in the Twenty-First Century—deserves a brief recounting given the impact of Capital. In his analysis, Cross argues that Capital is strewn with errors. These include Piketty’s failure to “clarify what supplanted inequality at the center of economic analysis” (Cross 2014, 2); “an exaggerated view of the return on capital (r) and a pessimistic view of economic growth” (3); “pessimism about long-term growth [which] reflects a Euro-centric view of the world” (3); the attempt to “directly link aggregate capital and labour income to individual incomes” (4); “drawing firm conclusions based on flimsy historical data” (6); and last, “the typical European difficulty in recognizing the power of information technology in shaping our economy and society” (8). Cross summarizes Capital’s initial success as more “commercial than intellectual” (10).
The many errors in Piketty’s work aside, Cross commends the French economist for attempting to change the discourse and methodologies of economics away from what Piketty characterizes as the tendency to lapse into a “passion for mathematics and for [the] purely theoretical and often highly ideological speculation at the expense of historical research” (Piketty 2014, 32; quoted in Cross 2014, 1). Cross characterizes the problem as one of “small-minded advancing of the chainsticks that grips most academic work” (Cross 2014, 1).
Cross in essence affirms that attempts to ponder inequality beyond the mathematical are important. Attempts such as these thus represent a useful avenue for research, especially as they concern inequality and poverty. Put simply, those concerned about the tendency to portray inequality as the problem and thus downgrade opportunity (and by unintentional effect, poverty) should be the first to remind the public that not all that is material has a material cause. There may be other reasons why inequality or poverty increases or decreases. Observed changes might not always result from economic developments at the beginning nor be subject to government policy corrections at the end.
For those who value economic opportunity, economic freedom, and entrepreneurship, it is thus ill-advised to succumb to the materialist assumptions of the reflexive redistributionists. After all, economic theories based on overly interventionist assumptions in the last century and similar assumptions carried forward into this one by social justice advocates assume a material cause and resolution for many ills. These assumptions then often lead to a presumptive material reordering of society via collectives such as government, which can often ignore the observable reality that human behaviour can be driven by the passions as much as by material self-interest.
To be clear, both self-interest (material, in the case of economics) and passions coexist in the human breast, but their expression is dependent on matters of importance to the individual. Human beings must eat, and economic self-interest will grow out of that and other realities. Material assumptions obviously matter in such instances. However, a person will also ignore their own self-interest and throw themselves on a grenade to save a fellow soldier. The latter act cannot be explained by rational self-interest, economic or otherwise. It can only be explained by a passion, a non-material cause: care for one’s comrade.
Two examples: A drug addict will not necessarily be cured via economic policy—a material remedy— because the cause of the addiction may not be material in nature; a rich person can still be an alcoholic. Thus the core problem may be psychological or social in nature.
Thus, relevant to this paper: Non-material developments, family fracturing included, matter to statistically measurable outcomes and should be considered in policy discussions. This is in part to understand the “why” of the numbers observed in a statistical table, and in part to ensure that any proposed remedies, if they are even available, match the cause. It is no more useful to propose a material remedy to a non-material cause than it is to fill an empty gasoline tank with fruit juice: The means will not help the driver reach their intended end.
Expressed starkly and relevant to this essay: With the exception of financial irresponsibility on the part of one spouse, family breakup is otherwise not likely the result of some economic calculation but instead results from standard, observable reasons which are non-material in origin: two people are incompatible, one spouse may be abusive, or ennui sets in in a relationship, or any number of other possible causes. With no judgment implied, such family fracturing can affect the statistics on poverty as two households are more expensive to “run” than one. They may also affect inequality statistics though that will depend on the resulting income in each household. In addition, insofar as a policy analyst attempts to offer policy advice to a government, a marriage that breaks up due to non-economic causes is hardly amenable to economic remedies given that the initial cause is nonmaterial and thus non-economic.
This latter point—that not all private problems are necessarily material in origin—has been more widely discussed in recent American policy debates. For example, Sara McLanahan and Wade Jacobsen (2015, 5) note that fewer parental resources are available to single mothers: “children born to unmarried mothers are much less likely to receive financial and emotional support from their biological fathers.” Similarly, Philip Cohen (2015, 25) notes that single parenthood is now causing lower levels of education for women, noting that children of married couples are less likely to suffer deprivation. He finds attempts to increase marriage rates have not worked and instead recommends ameliorating the effects of single parenthood (economically) via government policies. Ariel Kalil (2015, 63) finds that “inequality begins at home” and recommends that government “invest more in parents so parents can better invest more in their children,” though she skips past the question of two-parent versus one-parent families. Bradford Wilcox and Charles Stokes (2015, 147) find that “considerable evidence exists that young men and women from biological married families 4 4 “Biological married families” is the cited authors’ way of describing the traditional family: The children are the biological offspring of the parents, i.e., they are not step-children or adopted. are more likely to graduate from college and avoid a non-marital birth than their peers, but less evidence shows that family structure matters for young adult employment and income.” Ron Haskins (2015, 167) points out that four decades worth of data shows that marriage rates have fallen and non-marital birth rates have increased. This, he notes, has led to a significant increase in female-head households, which are “more likely to live in poverty, have suboptimal development and have behavioral problems than children reared by married parents.” Kathryn Edin et al. (2015, 213) point out that while couples that report high education levels enjoy greater stability in family life than in previous decades, the reverse is true for those who report lower levels of education; they also note that such stability is lacking where non-marital births occur. There, men who are initially enthusiastic about the prospect of fatherhood and the prospect of bonding with the mothers soon lose interest in both.
The Importance of Family Dynamics: An Issue in the United States Since the 1960s
Narrow, focused work on inequality and poverty in both Canada and the United States is a useful form of analysis in its own right. However, it might be usefully supplemented by accounting for historical understandings of family dynamics that originate in non-material realms, a reality reflected in the policy debates in the United States. Here, beyond the one-year snapshot from above, it appears that American academics and public intellectuals have also long pondered how family fracturing might lead to later social and economic problems.
An early example of such work appeared courtesy of Daniel Patrick Moynihan in 1965. Later a Democratic senator from New York, Moynihan, a sociologist and a then assistant secretary at the US Department of Labor, authored a report on the state of black Americans (Moynihan 1965). In it, Moynihan discusses the state of economic inequality and black families in the context of family structure. Controversial for some, the report warned that “the family structure of lower class [American blacks] is highly unstable, and in many urban centers is approaching complete breakdown.” He further notes that the rise of the black middle class will only statistically mask some of these trends but not shield black Americans from the effects.
The “Moynihan report,” as it came to be known, noted how in 1964 that 25 percent of black women in the American northeast that were ever married “are either divorced, separated, or have their husbands absent” and that the figure in New York City was above 30 percent. The report pointed to how 36 percent of black children were “living in broken homes at any specific moment [and] it is likely that a far higher proportion of [black] children find themselves in that situation at one time or another in their lives” (Moynihan 1965, 5–6 [emphasis original]).
The rise in separated or divorced has the potential to create increased poverty: two homes are always more expensive to maintain than one.
Some observers then and afterward accused the assistant secretary of labor of blaming the victim. Others attributed racism as causal to black family breakdown (Geary 2015).
5
5
Oddly for those who overly focus on material causes and remedies for social phenomena, the issue of prejudice is
a useful example of a non-material cause that can have a negative effect on material outcomes (income and wealth).
In this author’s view, the critics missed the central point: whatever the cause of lower-class black-family breakdown—and they may well have been multiple—identifying that phenomenon mattered because it functioned as a “canary in the coal mine,” warning about the effects of such developments. The Moynihan report attempted to flag family fracturing as consequential, with poorer educational outcomes to fewer employment opportunities and reduced economic success down the road as results.
The Moynihan report was one of the first to broach the subject of non-material causes for poor economic outcomes. That report was followed up by additional work over the decades. No attempt is made to comprehensively list them here, only to note that American scholars from Moynihan forward appear to have been more willing to consider family dynamics and the effect of split families on education, crime, and employment, among other outcomes.
Thus a short list of some of the more well-known works that address the topic of non-material causes for individual, family, and community woes in recent decades (including inequality where it is assumed to be a problem, and poverty): the importance of social capital as pointed to by Francis Fukuyama (1995; 1999) and Robert Putnam (2000); Deirdre McCloskey’s work on why economics cannot explain the modern world (2010) but why ideas can (2016); and Charles Murray’s 2012 book that identifies four factors that lead to a “good life” including economic success: marriage, industriousness, honesty, and religiosity.
In contrast to the United States, major Canadian work seems mostly focused only on the economics of such debates. One might speculate as to why and the reasons may be as simple as the research interests of particular scholars and which ones catch the public, policy, media, and political imaginations.
As an example, just as Moynihan’s Labor Department published his 1965, work which delved into the danger of a continued fracturing of the black family unit, in Canada, sociologist John Porter (1965) published The Vertical Mosaic, which called into question the idea that opportunity was alive and well for everyone. Porter assumed that (existing) class and power were the main determinants of middle-class success and were also barriers to the success of newer immigrants and the non-British. Upon publication, the book was popular in policy circles and among the public, as well as in the press and in politics (Helmes-Hayes 2006) and thus influenced policy and public debates. Whether one agreed or disagreed then or now with the book’s conclusions, its underlying assumptions about what influenced outcomes was twofold: money and power, the former of course being an economic factor. Cultural influences and family formation (and dynamics) were thus subsumed under working assumptions that favoured economics and power as causal.
Three years later, Canada’s statistical agency (then the Dominion Bureau of Statistics) published a 356-page analysis on the incomes of Canadians. Unlike the Moynihan report, the bureau’s report touched on family composition only relative to identifying who was poorest (widows and single parent families headed by females). No mention is made of family dynamics as a possible cause for poverty or warnings about the future based on current statistical trends (Poduluk 1968, 191). Similarly, in 1981, a book on inequality by Lars Osberg, a Dalhousie professor, continued the pattern: He covered every possible angle on inequality from capitalism, to property rights, to government policy, proposing anti-market remedies. “If Canadian society is to choose greater or less inequality, government will be the agent of choice,” wrote Osberg (1981, 6).
On the other side of the economic debate, by the 1990s, with inequality in the news, a marketfriendly think tank addressed inequality in two publications in two years. The authors of the reports discuss only economic matters: globalization, communications revolution, deregulation, and higher taxes among others (Charles Beach and George Slotsve, 1996; William Robson and William Scarth, 1997). They too leave alone the role that changing family dynamics might play in outcomes. The same pattern plays out in acknowledged specialist Miles Corak’s work (2004; 2006; 2012; and Corak et al. 2014), where the focus is on economics.
To be sure, a focus on the economics of inequality or poverty is useful insofar as a particular researcher or organization deems that their interest and focus. The gap identified in this report is that scholars and organizations in Canada
6
6
Cardus has published some work on the matter and is thus an exception to the Canadian rule. In 2014, Philip Cross and Peter Jon Mitchell looked at the difference between marriage rates between rich and poor Canadians,
noting how marriage “protects against poverty” (Cross and Mitchell 2014). Also, the summer 2015 edition of Comment magazine published multiple articles on inequality, providing helpful discussion on family formation and inequality (den Dulk 2015, 23–29; Smith and Wilcox 2015, 43–51), though even there one of the articles is an interview
with an American academic who has written on the issue. In Canada, public policy experts on this matter seem rare.
might wish to give family dynamics more attention, especially given the deleterious consequences of the decline in family stability, including for inequality and poverty issues now widely discussed.
This gap opens up the possibility for an additional avenue for research and for more accurate identification of causes. Moreover, it holds promise for better understanding some potentially overlooked causes for inequality and poverty: the long-term change in the family in Canada. It is to those long-term trends I now turn.
Section 2: The Findings in the Data
GIVEN THAT PERMANENT ALTERATION in family structure might well have an effect on income distribution and on poverty rates, taking the long view is essential for grasping the potential rise of social factors such as family fracturing. To that end, marital-status census data was compiled and then summarized from 1921 to 2014; census data for children in families 7 7 Statistics Canada defines an economic family as a group of two or more persons who live in the same dwelling and are related to each other by blood, marriage, common law, or adoption. An unattached individual is a person living either alone or with others to whom he or she is unrelated, such as roommates or a lodger (Statistics Canada 2017). and median after-tax income by economic family type is from 1976 forward.
Measurement 1: Median After-Tax Incomes 1976 and 2011
To understand how family formation may affect both inequality and poverty outcomes, consider statistics on median after-tax income by family type. Here, the data from 1976 and in 2011, the earliest and latest years available respectively, are surveyed.
In 1976, two-parent families with children demonstrated the highest median income followed by married couples (with no children) and lone-parent families headed by males next highest. There was a stark divide between those three cohorts and the other family types surveyed: lone parent families (the median here reflects both male and female), followed by then female lone-parent families and unattached individuals (figure 1a).
This will be helpful to recall when family composition is tracked in the subsequent section. Note that any reduction in the overall proportion of married couples or two-parent families or even lone-parent families headed by a male could lead to a shift (an increase) in poverty and possibly in inequality—though an increase in the latter would depend on the “before-and-after” incomes of the spouses. 8 8 I cite few poverty statistics in this study as the focus is on lack of research on family breakdown as significantly causal in inequality and poverty outcomes. The reason for this is simple: we know from the statistics, including figure 1a below, as well as a priori reasoning, that two homes are more expensive to “operate” than one. It would seem superfluous to then cite a raft of poverty statistics in addition to the median measurements noted on the subsequent pages.
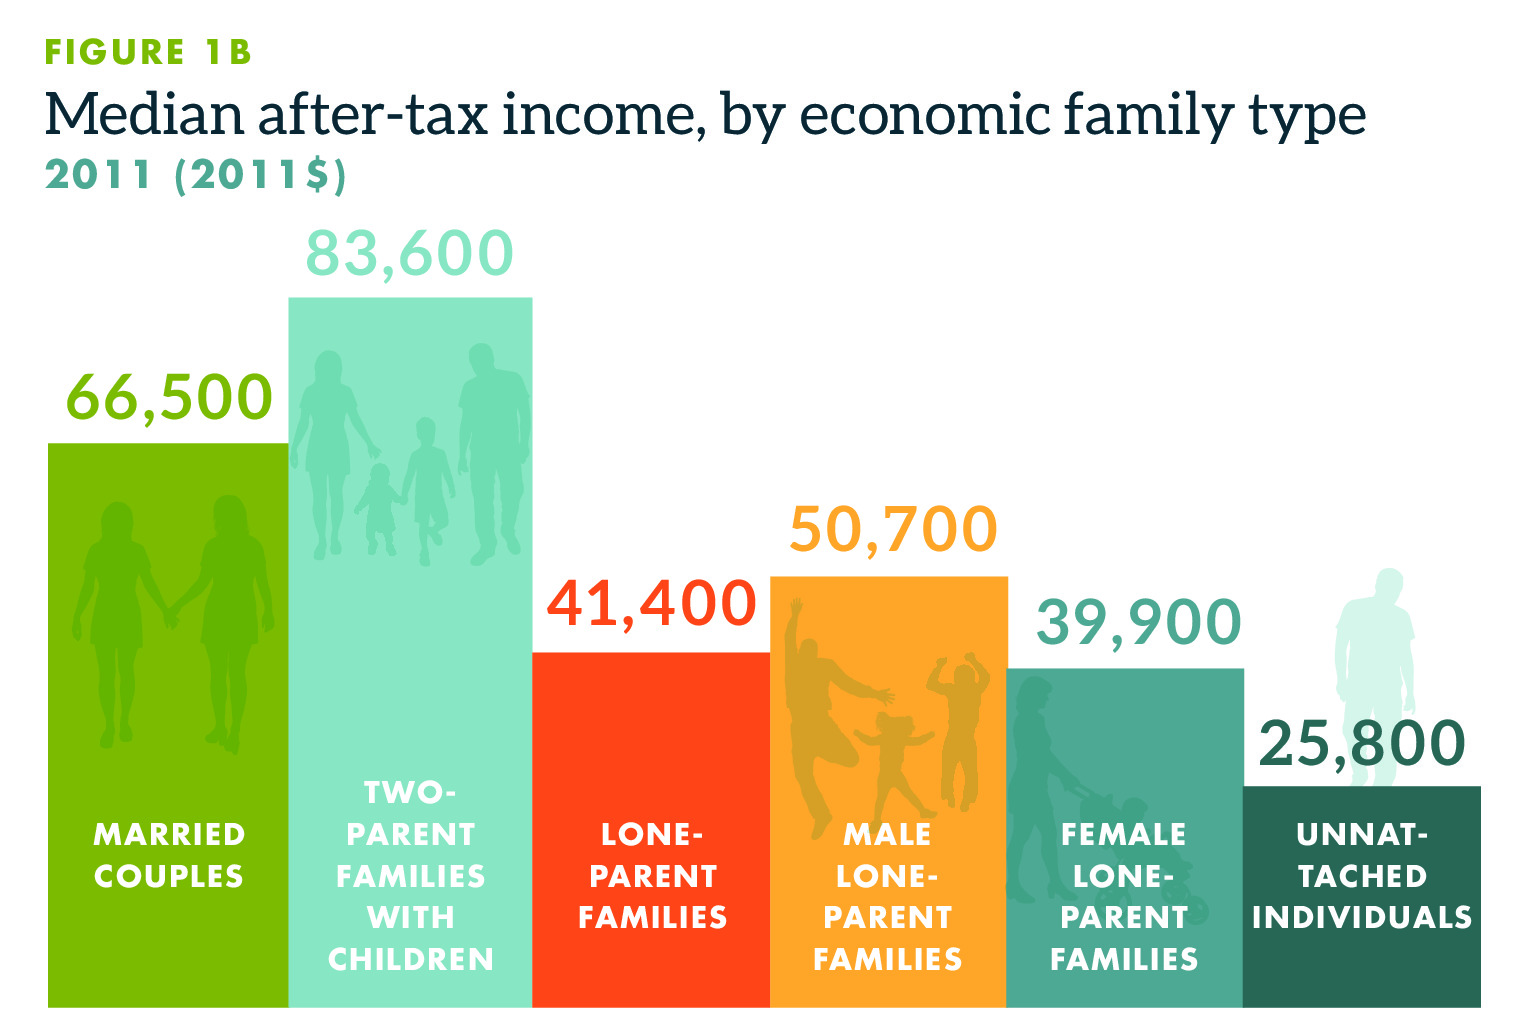
With a review of 2011 census data (figure 1b), the highest median after-tax income cohorts are still two-parent families with children and then married couples. However, lone-parent families headed by males are now closer to the remaining cohorts (lone-parent families, female lone-parent families, and unattached individuals).
The “Gaps” Between Cohorts in 1976 and in 2011: Comparisons to Married Couples
of outcome, in language or anywhere else in policy, is problematic for a number of reasons, including the reality of differences in choices, education, and multiple other possible reasons.
For lone-parent families headed by a male, there was just a 17 percent gap between that cohort’s median earnings in 1976 and the figure for married couples. By 2011, males who were single parents saw a larger gap (24 percent) between their median earnings and couples.
In this period, lone-parent female families improved relative to married couples, with a 57 percent gap in 1976 and a 40 percent gap in 2011. Of note, unattached individuals were as far from the median earnings of married couples in 2011 as there were in 1976, where a 61 percent gap is present in both years.
The Gaps Between Cohorts in 1976 and in 2011: Comparisons to Two-Parent Families with Children
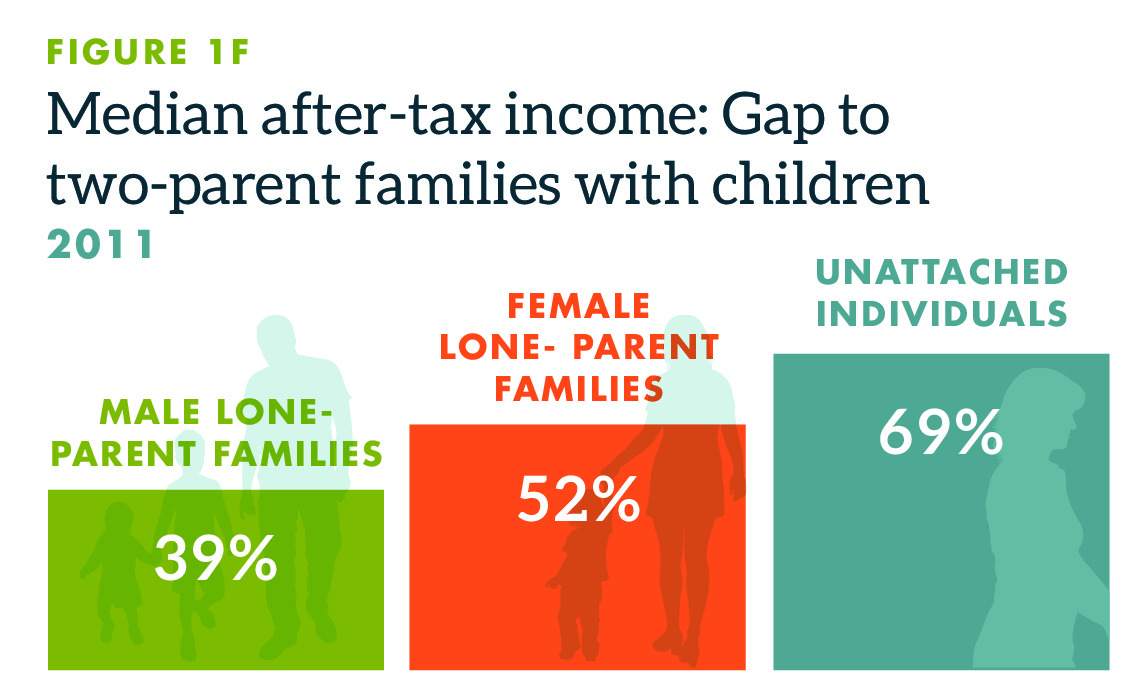
A similar trend is revealed when comparisons are made between those in the lowest median after-tax income cohorts and the highest. Lone-parent males recorded median earnings that were 25 percent below two-parent families with children in 1976 but 39 percent lower in 2011.
Female lone-parent families recorded median incomes 61 percent lower than two-parent families with children in 1976. That gap narrowed to 52 percent lower as of 2011, admittedly still a large gap. Unattached individuals recorded even more “distance” between their median earnings and two-parent families with children. In 1976, the gap between unattached individuals and two-parent families with children was 65 percent. By 2011, that gap had widened to 69 percent.
So Why Does This Matter?
After-tax income data is the first step in understanding why changing family formations might well matter to poverty and inequality and debates around the same. Analysts and the media might be tempted to focus only on poverty statistics or the outputs of the inequality data or on assumed economic inputs (the rise in dual-income couples, stock-market gains, or some other economic factor), but such a focus omits social and cultural factors that are also “inputs,” albeit not economic in nature.
For instance, the rise in separation and divorce is social and cultural, not economic, in nature. That trend over the past half century might well be explained by any number of reasons, some of which could be wholly positive, including a post-1960s culture that allowed women to increasingly be treated as equal to men, which meant increased choices as regards work and family. That same development—the possibility of work outside home—also would have allowed for increasing numbers of women to leave abusive marriages.
Thus there is no prima facie case that a lower divorce rate in previous decades was necessarily a positive if it meant individuals trapped in unhealthy marriages (and legal changes in the 1970s and 1980s contributed to the possibility that heretofore unhealthy marriages would have the chance to formally end). It would be hubris for an analyst to judge the individual reasons why a woman or man might have chosen to separate and divorce. All we know, at a “bird’s eye” level is that many more people made such choices starting in the 1960s and beyond (Statistics Canada 2017a; 2017b) and that such a development is relevant—or should be—to debates over inequality and poverty.
This wider view of marital status (profiled next), then, should be understood as helping illuminate social and cultural trends that can affect poverty and inequality statistics. Simply expressed, a culture that increasingly gave women and men more options in staying in or leaving a marriage is not necessarily an economic cause but a social one.
One response to this may be that traditional views on separation, divorce, and remarriage may have been influenced by economic or other developments—wartime (outside home) work for women and the development of the pill are two examples. I would partly agree and would reference those two examples as reasons. Wartime work for women increased dramatically in the First and Second World Wars. However, in neither case did separation or divorce rates rise dramatically after such participation. Thus some other causal factor was in play.
That rise only occurred in the 1960s and arguably as a result of multiple developments: the pill, the sexual revolution, second-wave feminism, and the decline of organized religion are some of the relevant factors, among others. Relevant to the tendency to see all developments as economic, recall that the pill was a technological development; the others (the decline of religion, for example) were social and cultural changes.
Worth noting: David Frum (2000) has argued that the social and attitudinal change in fact mostly occurred in the 1970s. However, wherever one “pegs” the initial cultural shift (and Frum makes a convincing case that for much of the public it was in that latter decade) the pill and the sexual revolution were technological and attitudinal factors, not economic ones. How we understand this shift matters to our understanding of selected possible spurs to increased inequality and poverty today. It is to those decades-long trends that I now turn.
Measurement 2: Marital Status Over Ninety-Five Years
To grasp possible influences on inequality data and also poverty, figure 2a tracks marital status from 1921 to 2016 for those aged fifteen and over. A number of trends become clear in the data. The first is that only one category—widowed—is nearly constant, with 6.2 percent in 1921, rising to 6.6 percent after the Second World War (in 1951), declining again over the ensuing decades and mostly constant.
The more dramatic trends appear in the other categories: Never married, married (including common-law), and divorced or separated. 11 11 For the purposes of this analysis, “divorced” and “separated” are totaled into one statistic on the assumption that separation and divorce results in the formation of a new household. These trends have implications for inequality and poverty statistics.
As figures 2a and 2b demonstrate, after reaching a post-war high with two-thirds of all Canadians over the age of fifteen married as of 1961, the percentage then fell through 2011 to 56.4 percent and rose slightly to 57.0 percent in 2016. The never-married percentage declined to 26.5 percent by 1951 and has remained fairly stable since.
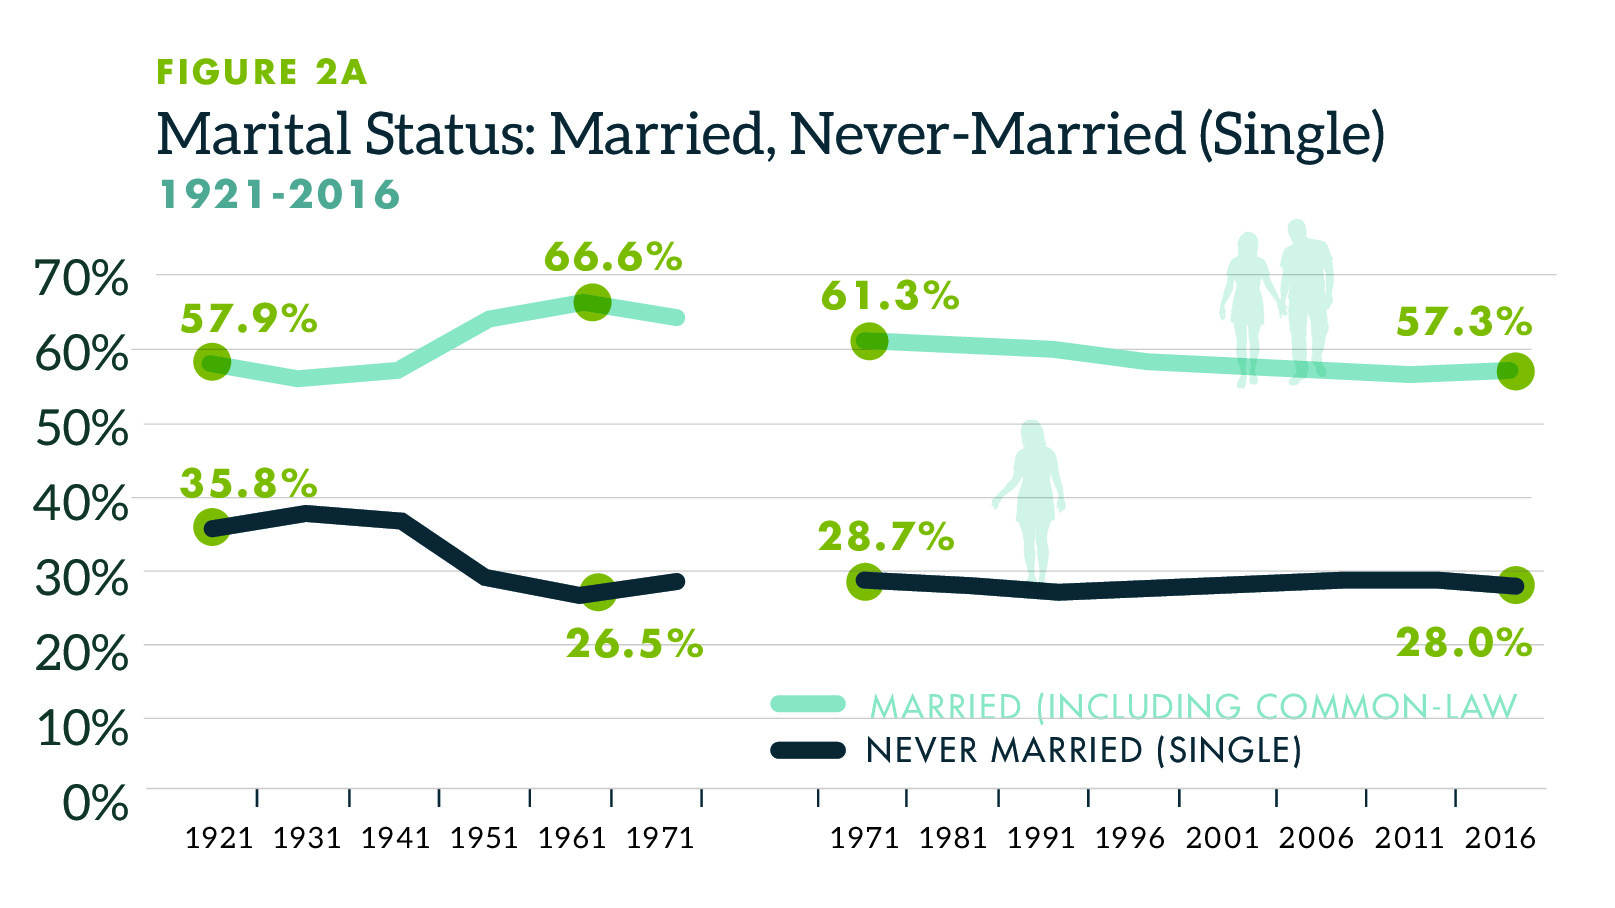
Sources: Statistics Canada 2017b; 2017c. Note that “separated” is included in “married” statistics 1921–1971. The “split” in the lines is because the data underlying this measure come from two separate sources, the main difference being that more categories are available in the 1971–2016 sources. In an effort to ensure readers are aware of the different data sources, the lines are separate in this and other charts where appropriate.
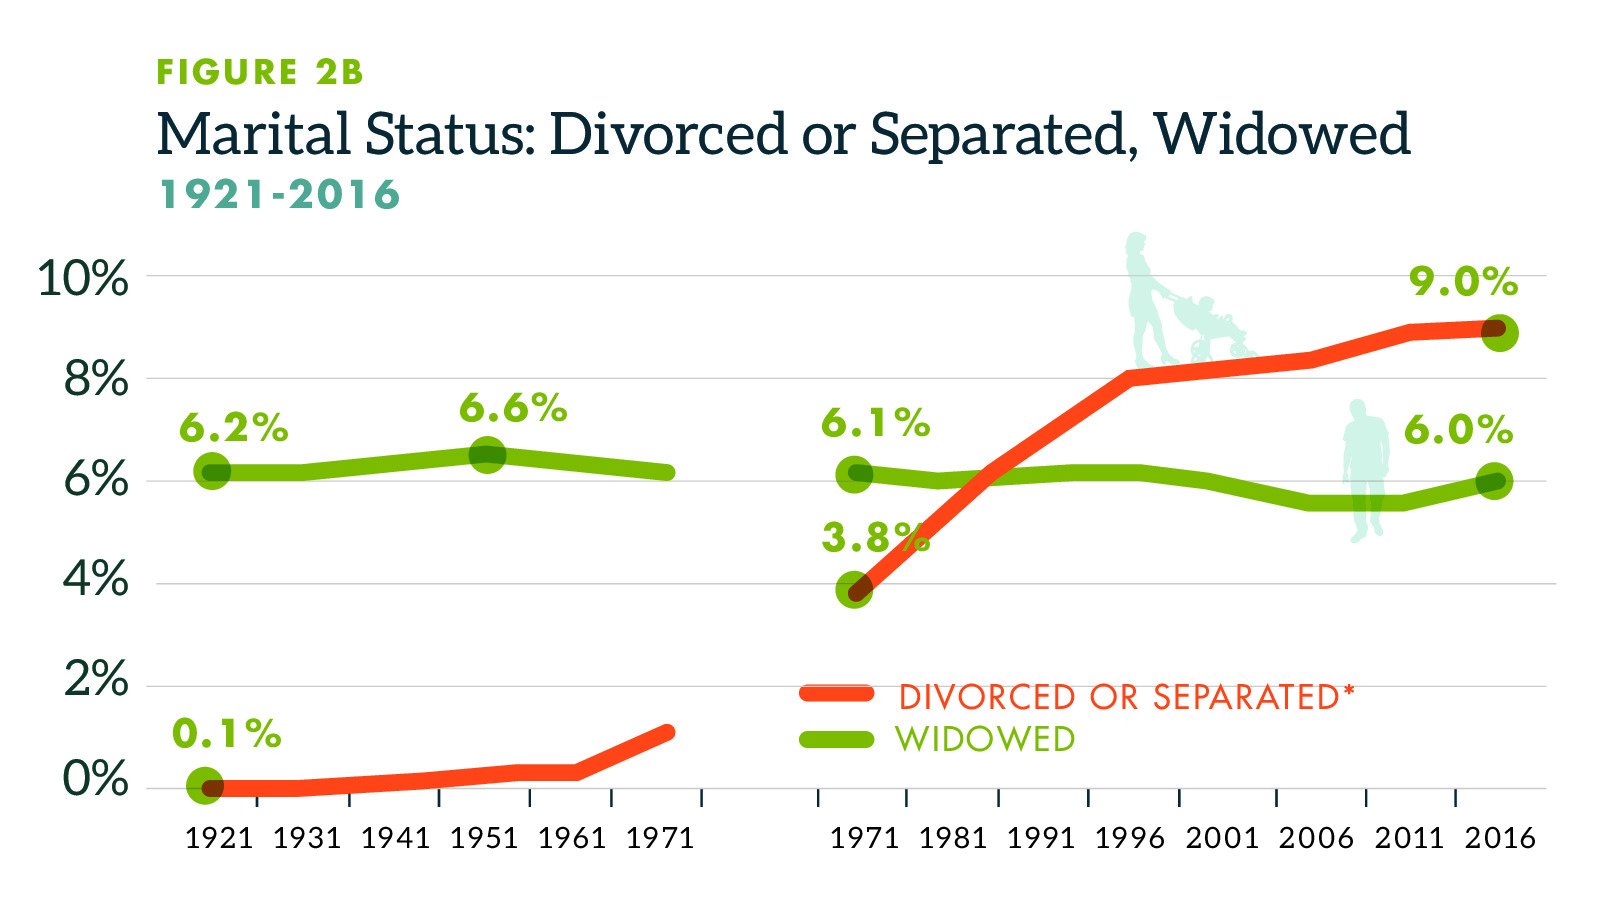
Sources: Statistics Canada 2017b; 2017c. *“Separated” is included in “married” statistics 1921–1971. I have combined the post-1971 separated and divorced categories on the assumption that in either case, a second household will have been formed. The “split” in the lines is because the data underlying this measure come from two separate sources, the main difference being that more categories are available in the 1971–2016 sources. In an effort to ensure readers are aware of the different data sources, the lines are separate in this and other charts where appropriate.
Teasing Out Statistical Difference Post-1971
The most dramatic change in marital status is the increase in divorced or separated. As noted above, the data underlying this measure comes from two different sources, so the results are discussed for two time periods (1921–1971 and 1971–2016) where necessary. Divorce was uncommon through the 1950s (0.1 percent in 1921 and 1931; 0.3 percent in 1951) but reached 1.2 percent by 1971. When we add in those who were separated (but not divorced) we see the ratio in 1971 was actually 3.8 percent (not 1.2 percent).
Nonetheless, the clear separation of such data from 1971 12 12 As of 1971, the census data for separated and divorced exists and for this report’s purpose is combined into the “divorced or separated” total. onward (noted in figure 2b) shows a clear trend. From 1971 to 2016 the rise in separated and divorced Canadians rose 134 percent in its proportion in the marital status category. That compares to a 7 percent reduction in the “married” category in the same time period, a minor reduction in widows as a proportion, and a 3 percent decline in “never married.”
These first two figures reveal the following: The rise in separated or divorced had and has the potential to create increased poverty: two homes are always more expensive to maintain than one. It should be noted that it also has the potential to do the reverse on inequality statistics. If the “fracture” moves more people into the “middle” and away from the “ends”, it may actually be equalizing. Either way, it points to what is often a non-economic development (family fracturing) leading to changes in poverty and inequality statistics.
Figure 2C
| Marital Status | Proportional change 1921-1971 | Proportional change 1971-2016 |
|---|---|---|
Never married (single) | -21% | -3% |
Married (including common-law) | 11% | -7% |
Separated or divorced* | 797% | 134% |
Widowed | 0% | -2% |
*Divorced only 1921-1971 | ||
Sources: Statistics Canada 2017b; 2017c. *“Separated” is included in “married” statistics 1921–1971. I have combined the post-1971 separated and divorced categories on the assumption that in either case, a second household will have been formed. |
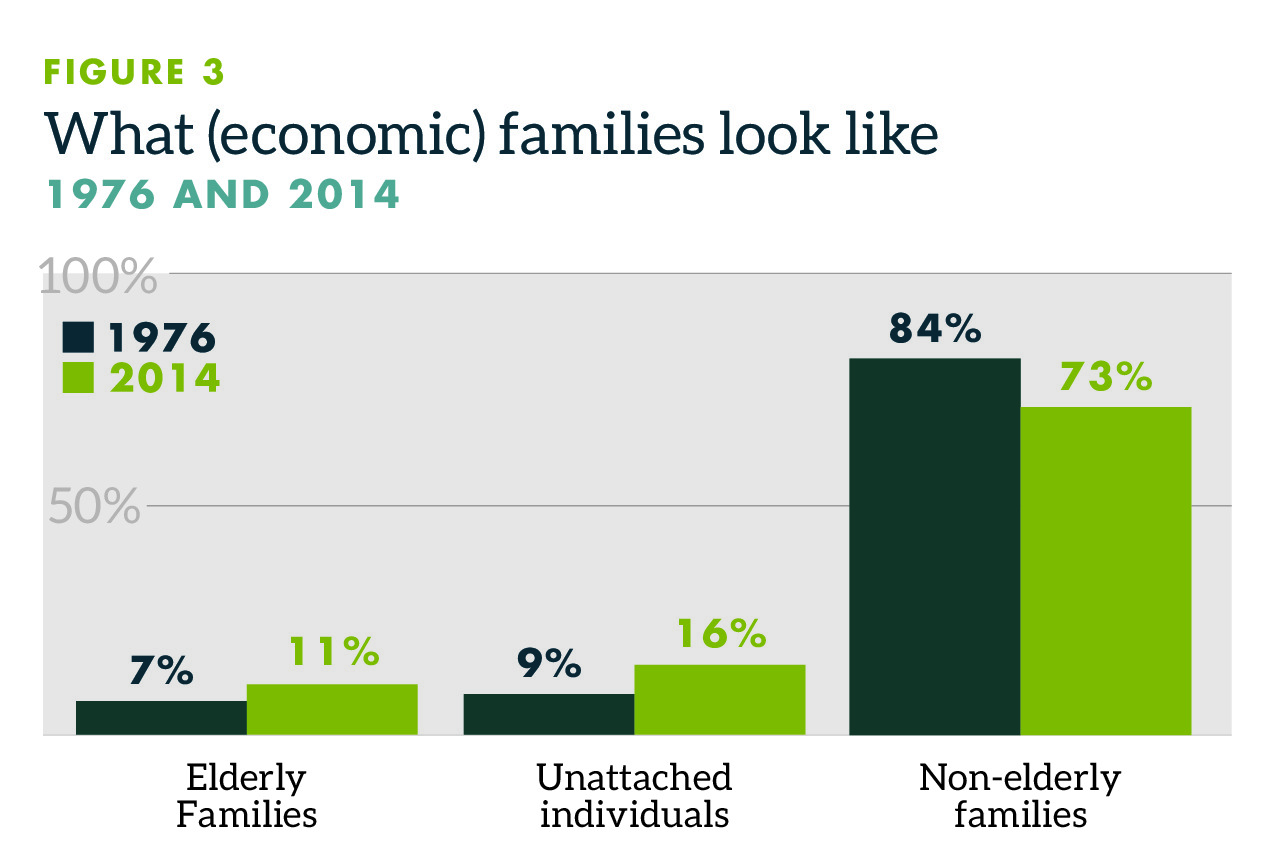
Measurement 3: A Snapshot of Persons in Families Circa 1976 and 2014
Data from the past four decades reveals shifts in the makeup of families (figure 3). Note that the rise in elderly families to 11 percent of the population in 2014 from 7 percent in 1976, and the rise in unattached individuals to 16 percent from 9 percent, is more dramatic than the 4 and 7 percentage point increases suggest. The rise from the baseline is what can shift other statistics (inequality and poverty) dramatically.
Thus, akin to the calculations made for figure 2b (the proportionate rise in a cohort’s share of marital status), the rise of unattached individuals to 16 percent of the population from 9 percent means the proportion of single Canadians has risen by three-quarters. That has statistical consequences given that unattached individuals demonstrate significantly less after-tax income than any other cohort.
Family Change: Families (with Elderly Families Excluded)
Between 1976 and 2014, the composition of the Canadian family changed dramatically. Whereas in 1976, 71.6 percent of (non-elderly) families were two-parent families with children, that percentage dropped to 49.8 percent as of 2014 (figure 4). The change reflected a nearly 50 percent rise in the proportion of married couples without children. There was a similar rise in loneparent families and an even higher proportional rise in the category of “married couples with other relatives” and a quadrupling of “other nonelderly families.” This reduction will have had an effect on statistics for inequality and poverty given that two-parent families with children earned the most both in 1976 and in 2011.
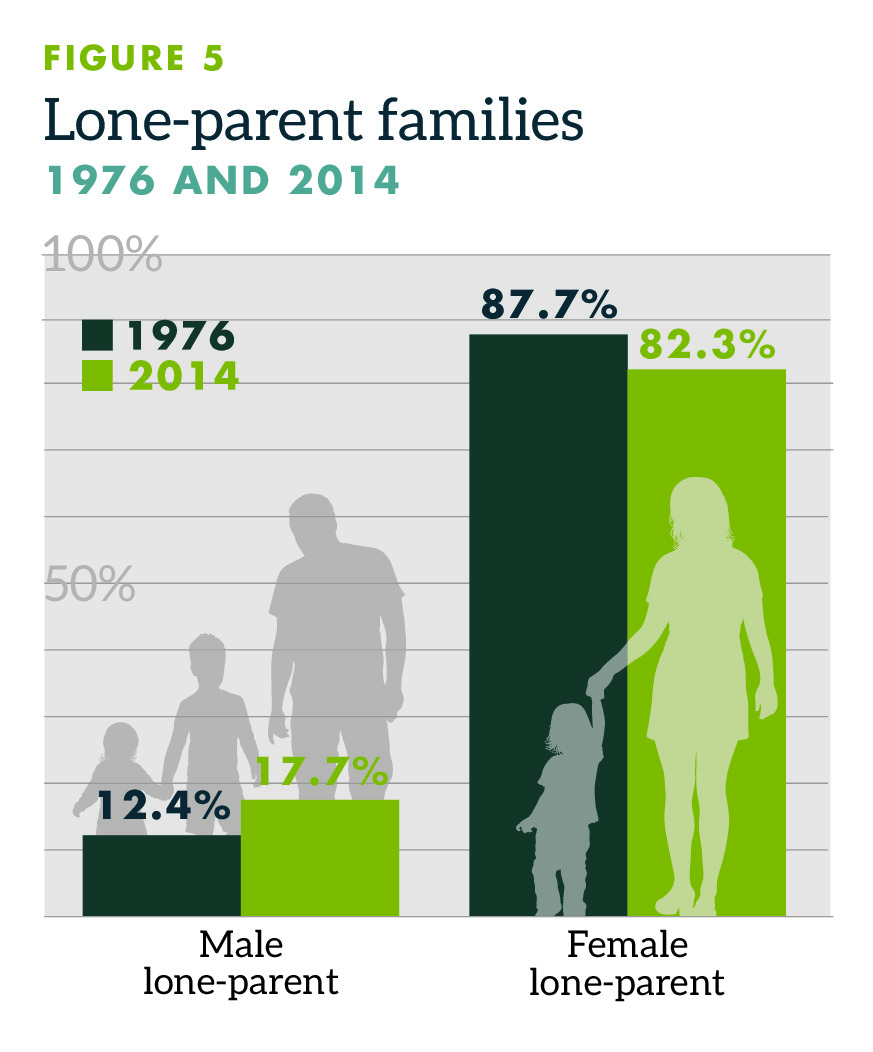
Lone-Parent Families Compared
Last, there has been a slight shift in lone-parent families between 1976 and 2014. Males made up 12.4 percent of lone-parent families but 17.7 percent as of 2014. Thus female lone-parent families decreased from 87.7 percent in 1976 to 82.3 percent as of 2014 (figure 5). Given that lone parent male families record higher median incomes than female lone-parent families, the result is that the statistics could be skewed slightly in the direction of increasing equality through this change in family formation (fewer lower-income, lone-parent female families; more higher income, lone-parent male families). Again, we have a non-material, non-economic cause (family formation or fracturing) that can affect an economic outcome.
IN SHORT, THE FIRST SET of figures on median after-tax income showed that married couples and two-parent families with children are found to have the highest median incomes. Lone-parent male families, lone-parent female families, and unattached individuals were less than the first two cohorts in 1976 and continued to be less in 2011. One difference though is that female lone-parent families have narrowed the income gap between themselves and the two top cohorts; however, they still substantially lag behind male lone-parent families.
On the second major set of data, marital status, those married (including common-law) have declined from as high as 66 percent (1961) to 57 percent as of 2016. The most telling statistics for inequality and poverty possibilities in the data is the rise of separated and divorced persons, especially after 1971. This matters because when middle- and low-income families are split, the resulting split of one household into two—but supported on the same income(s)—have the real possibility to skew poverty and inequality statistics.
The third set of statistics, family composition, shows just how such changing family dynamics— fewer two-parent families with children and more lone-parent families—will affect the data on inequality and poverty. A one-income household with two parents and children that once could afford a middle-income lifestyle, perhaps on $75,000 per year as an example, will, after a separation or divorce, be split into two households. Without any change in income but distributed equally among spouses, two households would then need to survive on $37,500 each. It is this dynamic that affects poverty statistics and also has the potential to affect inequality data.
Not all that is measurable, even where a clear problem exists, is amenable to a three-step, three policy recommendation strategy.
Conclusion and Recommendations
REPORTS THAT DELVE INTO STATISTICS have a bias towards policy recommendations anchored in policy actions by governments. Most often such recommendations take the form of “governments should do this” or less frequently “governments should do less of that.”
This report has offered a plethora of statistics, and thus it would be tempting here at the end to wrap them into an easily digestible set of recommendations that give the appearance of a clear path forward. But that would miss the point of this analysis: not all that is measurable, even where a clear problem exists, is amenable to a three-step, three-policy recommendation strategy to remedy an identified, worrying trend.
Thus, instead, some thoughts: In general terms, it makes some policy sense for governments to, at a minimum, follow the latter strategy (“do less of that”). With family, as with much else, “do no harm” is as good a place to start as any. Also, as per one previous Cardus analysis (Cross and Mitchell 2014), there may be additional sense in policies that allow for income-splitting to flourish—that or finding other ways to reduce the burden of taxation on families. Running a home with children, is, obviously, expensive (though no less desirable and rewarding for that). I would simply observe that any policy that allows for families to retain more of their income and reduce financial pressure on parents in particular is a net positive for family stability.
More broadly though, and moving away from the assumption that government is the “prime mover”— i.e., the primary origin of social and cultural change, it appears that few Canadian academics, policy analysts, or government studies report on other factors that can affect family formation and the subsequent ills or benefits that result: cultural influences, faith, or even narcissism.
In other words, as made clear the beginning of this study, whereas public intellectuals in the United States as diverse as the late Daniel Patrick Moynihan (a liberal Democrat) or Charles Murray (a libertarian) have mused out loud for decades about the fracturing family and its social consequences for society at large and children in specific, very little similar work appears to have been done in Canada. That may be because Canadians see such talk as moralizing; I suspect that is part of the problem. Another reason may be that some involved in policy work in Canada have a default bias to government as the corrector of all that ails us. Even if not explicitly stated in such a fashion, there is, at a minimum, an empirically derived bias that only if more accurate data can be found and policy remedies implemented can a problem potentially be solved.
Instead, this report suggests a different approach: First, more thought, study, and analysis should focus on non-economic causes for family fracturing; second, such fracturing is itself a cause of poverty and movements in inequality statistics; third, we should focus more on what actors other than government can do: individuals, existing families, religious institutions, non-profits, and the plethora of other entities that Edmund Burke labelled the “little platoons” that form the web and foundation for thriving communities and countries.
References
Banting, Keith, and John Myles. 2015. “Framing the New Inequality: The Politics of Income Redistribution in Canada.” In Income Inequality: The Canadian Story, edited by David A. Green, W. Craig Riddell, and France St.-Hilaire, 509–40. The Art of the State 5. Montreal: Institute for Research on Public Policy.
Beach, Charles M., and George A. Slotsve. 1996. Are We Becoming Two Societies? Income Polarization and the Myth of the Declining Middle Class in Canada. Toronto: C.D. Howe Institute.
Boudreaux, Donald J., with Joel Emes, Hugh MacIntyre, and Charles Lammam. 2016. “The Myth of Middle-Class Stagnation in Canada.” The Fraser Institute. https://www.fraserinstitute.org/ sites/default/files/the-myth-of-middle-class-stagnation-in-canada-post.pdf.
Central Intelligence Agency [CIA]. 2015. “The World Factbook: Distribution of Family Income— Gini Index.” Central Intelligence Agency https://www.cia.gov/library/publications/the-worldfactbook/fields/2172.html.
Clemens, Jason, Taylor Jackson, and Megan O’Neill. 2016. “How Income and Wealth Are ‘Earned’ Matters in Understanding Inequality.” Fraser Institute. https://www.fraserinstitute.org/sites/ default/files/how-income-and-wealth-are-earned-matters-in-understanding-inequality.pdf.
Cohen, Philip N. 2015. “Divergent Responses to Family Inequality.” In Families in an Era of Increasing Inequality, edited by Paul R. Amato et al., 25–33. New York: Springer.
Corak, Miles. 2004. Generational Income Mobility in North America and Europe. Cambridge: Cambridge University Press.
———. 2006. “Do Poor Children Become Poor Adults? Lessons from a Cross Country Comparison of Generational Earnings Mobility.” IZA Discussion Paper No. 1993. Institute for the Study of Labour. http://ftp.iza.org/dp1993.pdf.
———. 2012. “Inequality from Generation to Generation: The United States in Comparison.” Working Paper. Graduate School of Public and International Affairs, University of Ottawa. http://nws-sa.com/rr/Inequality/inequality-from-generation-to-generation-the-united-statesin-comparison-v3.pdf.
Corak, Miles, Mathew J. Lindquist, and Bhashkar Mazumder. 2014. “A Comparison of Upward and Downward Intergenerational Mobility in Canada, Sweden and the United States.” Labour Economics 30 (October): 185–200.
Cross, Philip. 2014. “A Failure on Several Counts: Thomas Piketty’s Capital in the Twenty-First Century.” Fraser Institute. https://www.fraserinstitute.org/sites/default/files/a-failure-onseveral-counts-thomas-piketty-book-rev.pdf.
Cross, Philip, and Peter Jon Mitchell. 2014. “The Marriage Gap Between Rich and Poor Canadians.” Cardus. http://www.imfcanada.org/sites/default/files/event/CMD-FINAL.pdf.
Den Dulk, Kevin R. 2015. “Reviving Citizenship in the New Gilded Age.” Comment. Summer, 23–29.
Edin, Kathryn, Laura Tach, and Timothy J. Nelson. 2015. “The Diverging Destinies of Fathers and What It Means for Children’s Lives.” In Families in an Era of Increasing Inequality, edited by Paul R. Amato et al., 213–21. New York: Springer.
Fitzgerald, Terry J. 2008. “Where Has All the Income Gone? Middle American Incomes Rise Substantially Even While Inequality Increases.” Federal Reserve Bank of Minneapolis. https://www.minneapolisfed.org/~/media/files/pubs/region/08-09/income.pdf.
Foley, Kelly, and David A. Green. 2015. “Why More Education Will Not Solve Rising Inequality (and May Make It Worse).” In Income Inequality: The Canadian Story, edited by David A. Green, W. Craig Riddell, and France St.-Hilaire, 347–98. The Art of the State 5. Montreal: Institute for Research on Public Policy.
Frum, David. 2000. How We Got Here: The 70s: The Decade That Brought You Modern Life—For Better or Worse. Toronto: Random House Canada.
Fukuyama, Francis. 1995. Trust: The Social Virtues and the Creation of Prosperity. New York: Penguin Putnam.
———. 1999. The Great Disruption: Human Nature and the Reconstitution of Social Order. New York: Free Press.
Geary, Daniel. 2015. “The Moynihan Report: An Annotated Edition.” The Atlantic. September 14. https://www.theatlantic.com/politics/archive/2015/09/the-moynihan-report-an-annotatededition/404632/.
Green, David A., W. Craig Riddell, and France St.-Hilaire, eds. 2017. Income Inequality in Canada: Driving Forces, Outcomes and Policy. Montreal: Institute for Research on Public Policy, forthcoming.
Greenwood, Jeremy, and Nezih Guner. 2009. “Marriage and Divorce since World War II: Analyzing the Role of Technological Progress on the Formation of Households.” In NBER Macroeconomics Annual 2008, Volume 23, edited by Daron Acemoglu, Kenneth Rogoff, and Michael Woodford, 231–76. Chicago: University of Chicago Press. http://www.nber.org/chapters/c7282.pdf.
Gu, Wulong, and Ambrose Wong. 2010. “Estimates of Human Capital in Canada: the Lifetime Income Approach.” Statistics Canada. http://www.statcan.gc.ca/pub/11f0027m/11f0027m2010062-eng.pdf.
Haskins, Ron. 2015. “No Way Out: Dealing with the Consequences of Changes in Family Composition.” In Families in an Era of Increasing Inequality, edited by Paul R. Amato et al., 167–99. New York: Springer.
Heisz, Andrew, and Brian Murphy. 2015. “The Role of Taxes and Transfers in Reducing Income Inequality.” In Income Inequality: The Canadian Story, edited by David A. Green, W. Craig Riddell, and France St.-Hilaire, 435–78. The Art of the State 5. Montreal: Institute for Research on Public Policy.
Helmes-Hayes, Rick. 2006. “The Vertical Mosaic.” The Canadian Encyclopedia. http://www.thecanadianencyclopedia.ca/en/article/vertical-mosaic/.
Kalil, Ariel. 2015. “Inequality Begins at Home: The Role of Parenting in the Diverging Destinies of Rich and Poor Children.” In Families in an Era of Increasing Inequality, edited by Paul R. Amato et al., 63–82. New York: Springer.
Krugman, Paul. 2013. “Why Inequality Matters.” New York Times, December 15. http://www.nytimes.com/2013/12/16/opinion/krugman-why-inequality-matters.html?r=0.
Lammam, Charles, et al. 2016. “Measuring Income Mobility in Canada, 2016.” The Fraser Institute. https://www.fraserinstitute.org/sites/default/files/measuring-income-mobility-incanada-2016.pdf.
Lemieux, Thomas, and W. Craig Riddell. 2015. “Who Are Canada’s Top 1 Percent?” In Income Inequality: The Canadian Story, edited by David A. Green, W. Craig Riddell, and France St.- Hilaire, 103–56. The Art of the State 5. Montreal: Institute for Research on Public Policy.
Magness, Phillip W., and Robert P. Murphy. 2014. “Challenging the Empirical Contribution of Thomas Piketty’s Capital in the 21st Century.” Journal of Private Enterprise (spring 2015): http://papers.ssrn.com/sol3/papers.cfm?abstract_id=2543012.
McCloskey, Deirdre N. 2010. Bourgeois Dignity: Why Economics Can’t Explain the Modern World. Chicago: University of Chicago Press.
———. 2016. Bourgeois Equality: How Ideas, Not Capital or Institutions, Enriched the World. Chicago: University of Chicago Press.
McLanahan, Sara, and Wade Jacobsen. 2015. “Diverging Destinies Revisited.” In Families in an Era of Increasing Inequality, edited by Paul R. Amato et al., 3–23. New York: Springer.
Milligan, Kevin, and Michael Smart. 2015. “Provincial Taxation of High Incomes: The Effects on Progressivity and Tax Revenue.” In Income Inequality: The Canadian Story, edited by David A. Green, W. Craig Riddell, and France St.-Hilaire, 479–508. The Art of the State 5. Montreal: Institute for Research on Public Policy.
Moynihan, Daniel Patrick. 1965. “The Negro Family: The Case for National Action.” US Department of Labor: Policy, Planning and Research. http://web.stanford.edu/~mrosenfe/Moynihan%27s%20The%20Negro%20Family.pdf.
Murray, Charles. 2012. Coming Apart: The State of White America, 1960–2010. New York: Crown.
Osberg, Lars. 1981. Economic Inequality in Canada. Toronto: Butterworths.
Piketty, Thomas. 2014. Capital in the Twenty-First Century. Cambridge, MA: Belknap Press of Harvard University Press.
Poduluk, Jenny R. 1968. “Incomes of Canadians.” Dominion Bureau of Statistics.
Porter, Jon. 1965. The Vertical Mosaic: An Analysis of Social Class and Power in Canada. Toronto: University of Toronto Press, 1965.
Putnam, Robert P. 2005. Bowling Alone: The Collapse and Revival of American Community. New York: Simon & Schuster.
Robson, William B.P., and William Scarth, eds. 1997. Equality and Prosperity: Finding Common Ground. Toronto: C.D. Howe Institute.
Sarlo, Christopher A. 2017. “Understanding Wealth Inequality in Canada.” The Fraser Institute https://www.fraserinstitute.org/sites/default/files/understanding-wealth-inequality-in-canada. pdf.
Sarlo, Christopher A., Jason Clemens, and Joel Emes. 2015. Income Inequality Measurement Sensitivities. The Fraser Institute. https://www.fraserinstitute.org/sites/default/files/incomeinequality-measurement-sensitivities.pdf.
Smith, James K.A., and W. Bradford Wilcox. 2015. “Marriage Is a Social Justice Issue.” Interview with W. Bradford Wilcox.” Comment. Summer, 23–29.
Stiglitz, Joseph E. 2012. The Price of Inequality: How Today’s Divided Society Endangers Our Future. New York: W. W. Norton.
Wilcox, W. Bradford, and Charles E. Stokes. 2015. “The Family Foundation: What Do Class and Family Structure Have to Do with the Transition to Adulthood?” In Families in an Era of Increasing Inequality, edited by Paul R. Amato et al., 147–64. New York: Springer.
Wilkinson, Richard G., and Kate Pickett. 2009. The Spirit Level: Why Greater Equality Makes Societies Stronger. New York: Bloomsbury.
Wilson, James Q. 2002. The Marriage Problem: How Our Culture Has Weakened Families. New York: HarperCollins.
World Bank. 2015. “Gini Index (World Bank Estimate).” http://data.worldbank.org/indicator/SI.POV.GINI.
Government References
Statistics Canada. 2017a. “Table 202-0605—Median After-Tax Income, by Economic Family Type, 2011 Constant Dollars.”
Statistics Canada. 2017b. “Table 075-0014—Historical Statistics, Population, by Marital Status, Age Group and Sex, Every 10 Years (Persons).”
Statistics Canada. 2017c. “Table 051-0042—Estimates of Population, by Marital Status or Legal Marital Status, Age and Sex for July 1, Canada, Provinces and Territories, Annual (Persons).”
Statistics Canada. 2017d. “Table 206-0011—Market Income, Government Transfers, Total Income, Income Tax and After-Tax Income, by Economic Family Type, Canada, Provinces and Selected Census Metropolitan Areas (CMAs), Annual.
The Social Affects the Statistical
In questions of what might drive inequality and poverty figures, the underlying dynamics of family formation matter further as regards children. As figures 1 et al. demonstrated, the two family types with the highest median after-tax incomes are married couples (without children) and two-parent families with children. Thus, when married couples separate and divorce, or when two-parent families split into two lone-parent families, the income (or incomes) that previously supported one home and household is most likely to support two.
This might be less often observed in married couples if both spouses earn the same income. For example, if the husband and wife both earned $50,000 each before a divorce, income-inequality data derived from individual earnings would not change afterward. Both ex-spouses would continue to record $50,000 each in income.
However, even in that example, the couple while married would likely have lived in the same home with one mortgage payment, one utility bill, one Internet charge per month, and so on. After divorce, each divorced spouse would likely now face those same costs. This holds true even if one assumes that each person might try and mitigate such costs with slightly less expensive accommodation, as an example. It is unlikely that each person would be able to reduce that major expense to exactly half of the cost incurred when married.
The social action of a separation or divorce will be even more pronounced in the ensuing statistics where incomes are uneven. The resulting two households will make it appear that inequality has increased (between 1971 and 2001, for example), but the cause there is social and not economic.
This same example holds true for two-parent families with children on poverty statistics. A one income family or a two-income family where spousal incomes are unequal but equalized after divorce would skew the inequality data in the direction of more equality—even though the fundamental economic earnings have not changed—but also in the direction of more poverty, if for example, a $50,000 (total household) income is now split into two households ($25,000 each) with overall increased costs. 13 13 Of course, as per the divorcing couple without children, two homes will now be required to support the same two people that were formerly ensconced in one.