Table of Contents
Table of Contents
Regulatory Framework
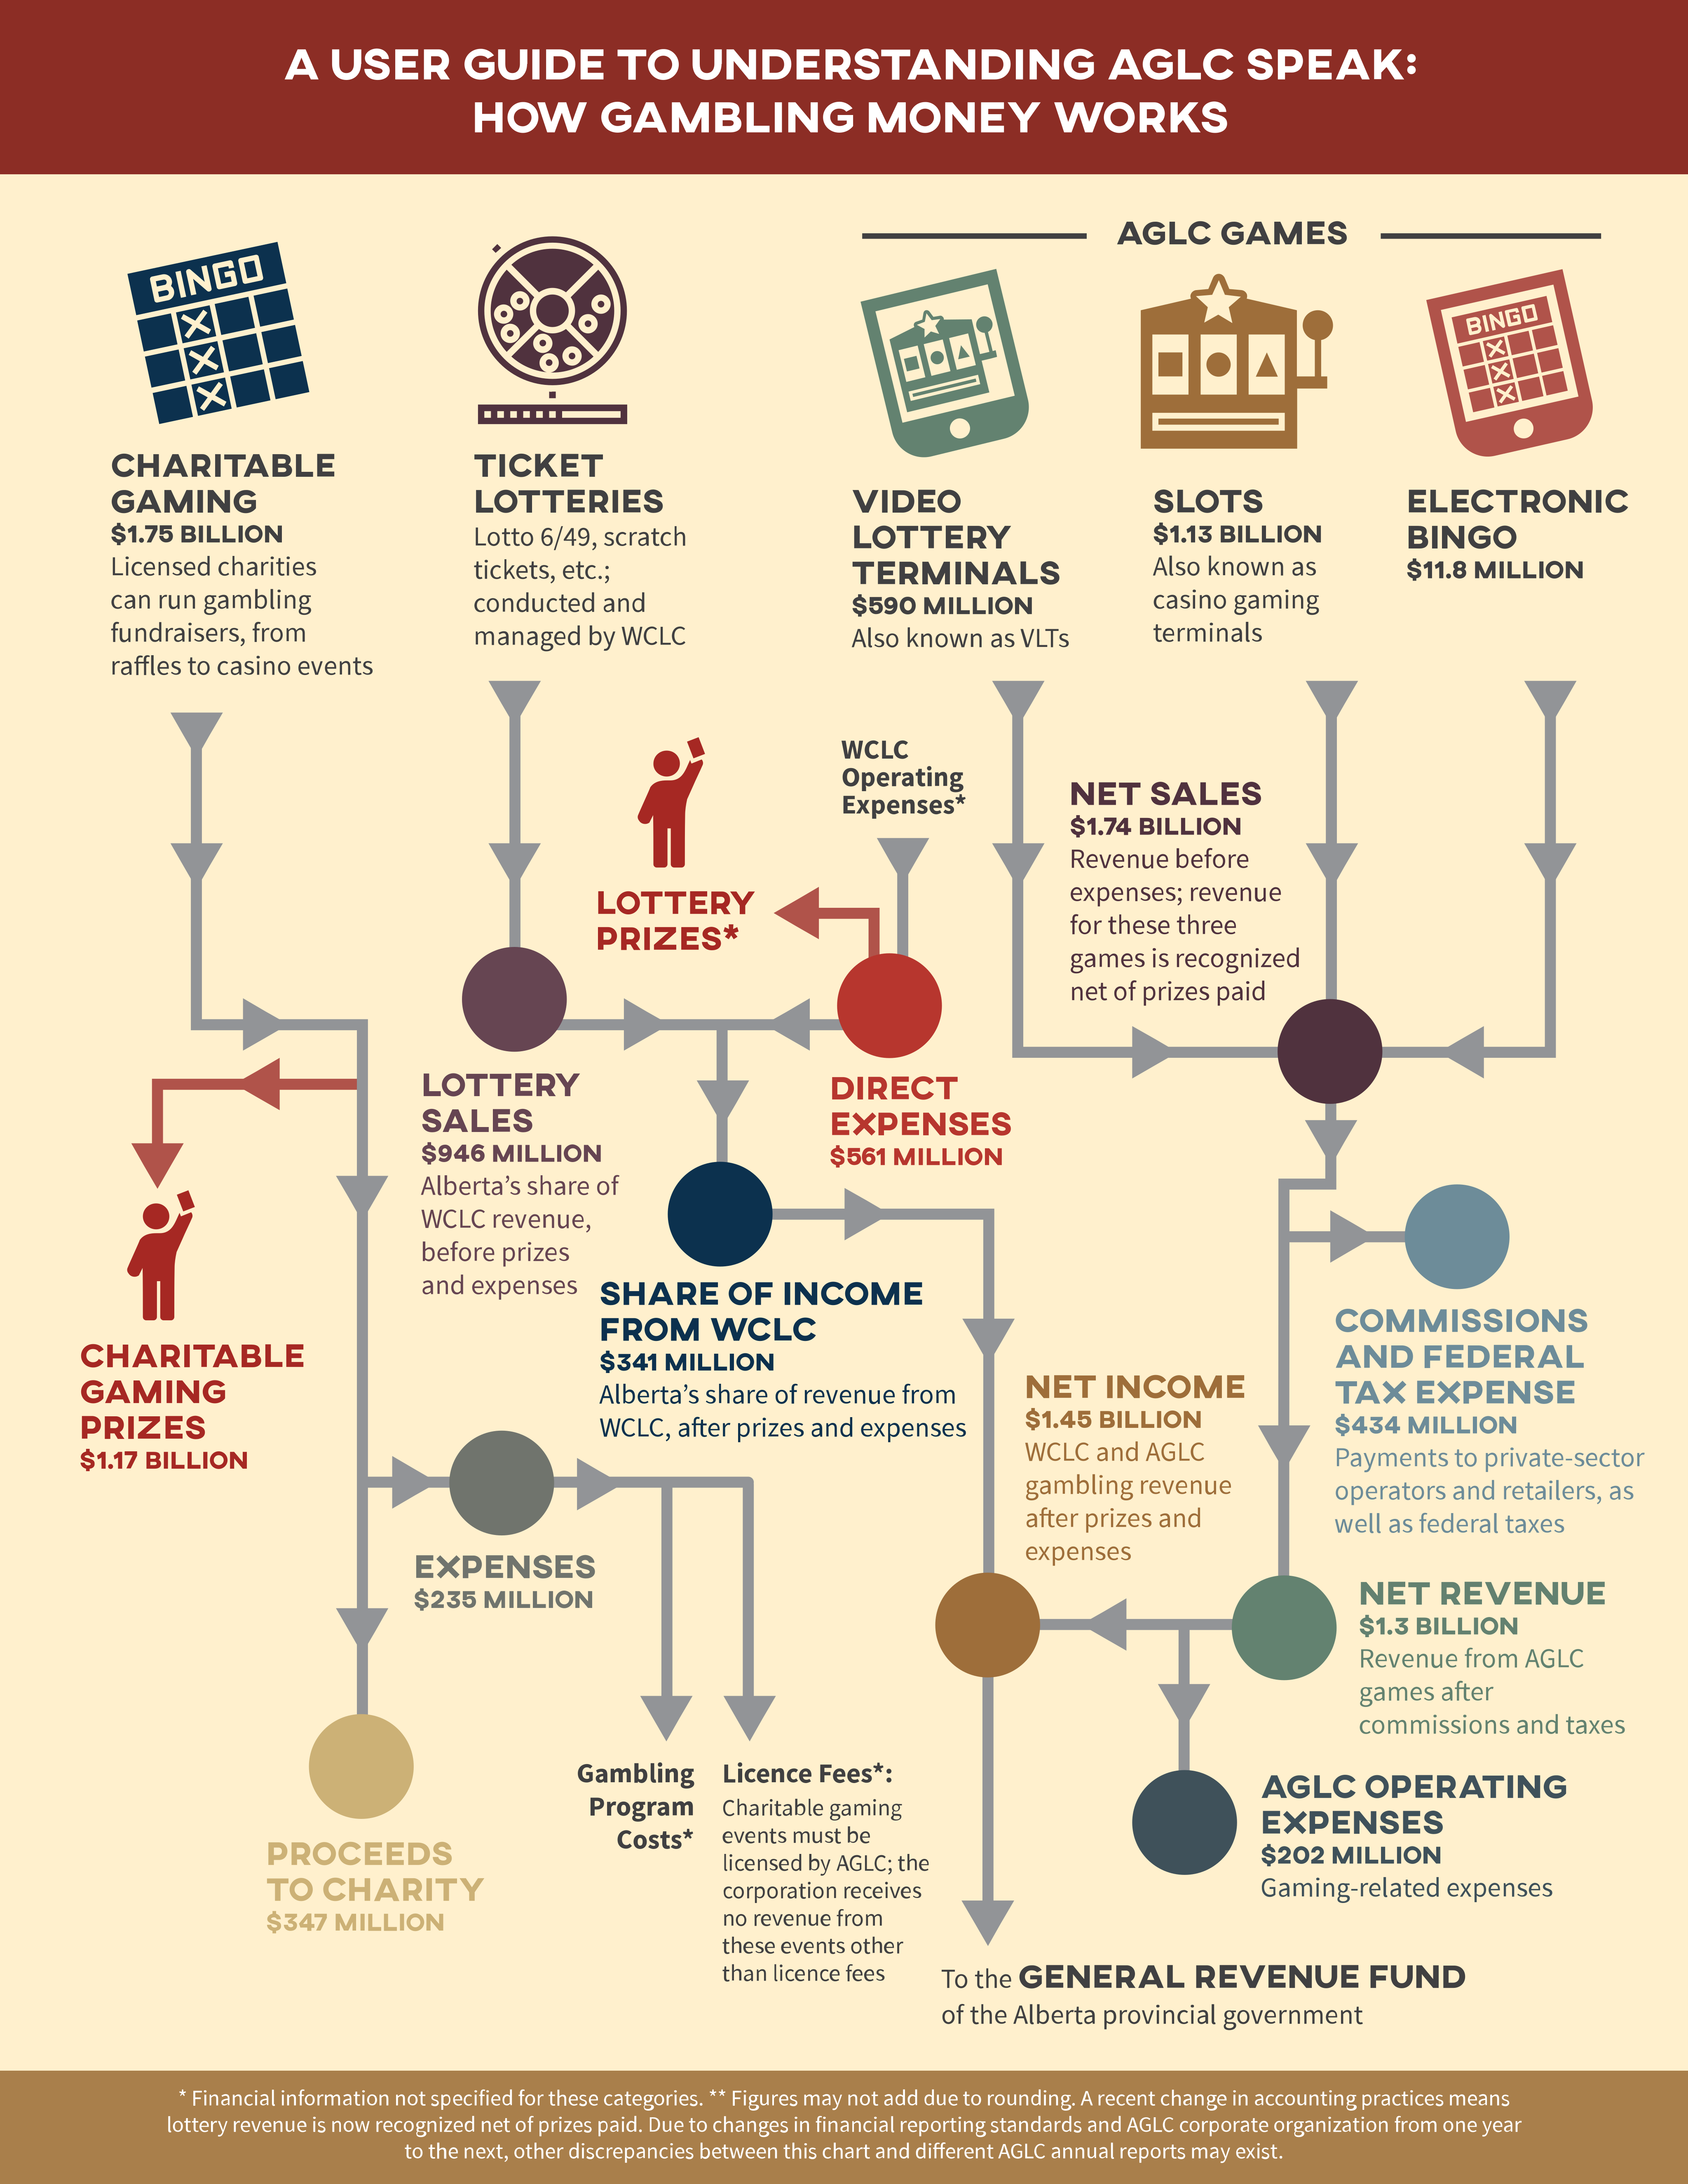
Alberta uses a charitable gaming model, the only province in Canada to do so. 1 1 AGLC, “Alberta’s Charitable Gaming Model,” https://aglc.ca/gaming/charitablegaming/albertas-charitable-gaming-model. Charitable organizations run bingo fundraisers and sell raffle and pull tickets; they also conduct and manage casino events, supplying volunteers to help staff casinos in exchange for a share of casino proceeds. 2 2 If a charity’s application to run a casino event is successful, it is assigned by AGLC to one of ten designated casino regions in the province (all of which have wait times from eighteen months to three years). All charities must hire one or two casino advisors to assist them with running their event. Proceeds are distributed to charities by region and quarter: all charities that conduct a casino event in a given region and quarter receive an equal share of that region’s quarterly casino profits. AGLC, “Gaming Licenses: Casino,” https://aglc.ca/gaming/licences/casino. Charitable-gaming profits are kept by charities—none of the revenue goes to the provincial government—and their use of these profits is restricted to charitable purposes. Charities raised $347 million through gambling in 2018–19, nearly three-quarters (71 percent) of which came from casino events. 3 3 AGLC, “Annual Report 2018–19,” 43, https://aglc.ca/sites/aglc.ca/files/aglc_files/AGLC_AnnualReport_2019.pdf. In addition to issuing gaming licenses to charities and regulating charitable gaming, Alberta Gaming, Liquor & Cannabis (AGLC) is responsible for conducting and managing all video lottery terminals (VLTs) in the province. 4 4 AGRI, “Government & Gambling—Canada,” https://abgamblinginstitute.ca/resources/reference-sources/government-gambling-canada.
Western Canada Lottery Corporation (WCLC) works on behalf of Alberta, Saskatchewan, and Manitoba to manage, conduct, and operate ticket lotteries in those provinces (Yukon, NWT, and Nunavut also participate as associate members). 5 5 WCLC, “About WCLC,” https://www.wclc.com/about-us/about-wclc.htm. Before 2019, net revenues from VLTs, slot machines, and ticket lotteries went into the Alberta Lottery Fund. This fund was administered by AGLC, the province’s gambling regulator. 6 6 AGRI, “Government & Gambling—Canada.” The Fiscal Measures and Taxation Act, 2019 transferred gambling funds into the province’s general revenues, to be spent by the provincial government however it sees fit. 7 7 Government of Alberta “Implementing Budget 2019,” https://www.alberta.ca/implementing-budget-2019.aspx.
Operations
Where the Money Comes From
AGLC generated close to $1.7 billion in gambling revenue over the 2018–19 fiscal year. This revenue comes from three main game types: slots (also called casino gaming terminals), VLTs, and electronic bingo. AGLC also receives a share of income from WCLC based on Alberta’s proportion of ticket lottery sales. Of all four game types, the largest share of gambling sales comes from slots, which bring in about 42 percent of total sales, at $1.13 billion. The other major sales source is the ticket lottery, which took in another 35 percent, at $946 million. VLTs are a close third at 22 percent ($590 million); bingo, meanwhile, accounts for only 0.4 percent of sales ($12 million). A significant majority of gambling revenue thus comes from the most addictive medium, electronic gambling machines (EGMs): slots and VLTs, the control-inhibiting design elements of which are discussed below, bring in $1.72 billion, or 64 percent of revenue. AGLC also reported just under $5 million in other revenue (0.2 percent). Prize payments and operating expenses shift the overall profitability of these games; WCLC ticket lotteries account for more than a third (35 percent) of sales, but less than a quarter (24 percent) of net income (Figure 1). 8 8 AGLC, “AGLC Annual Report 2018–19.”

Where the Money Goes
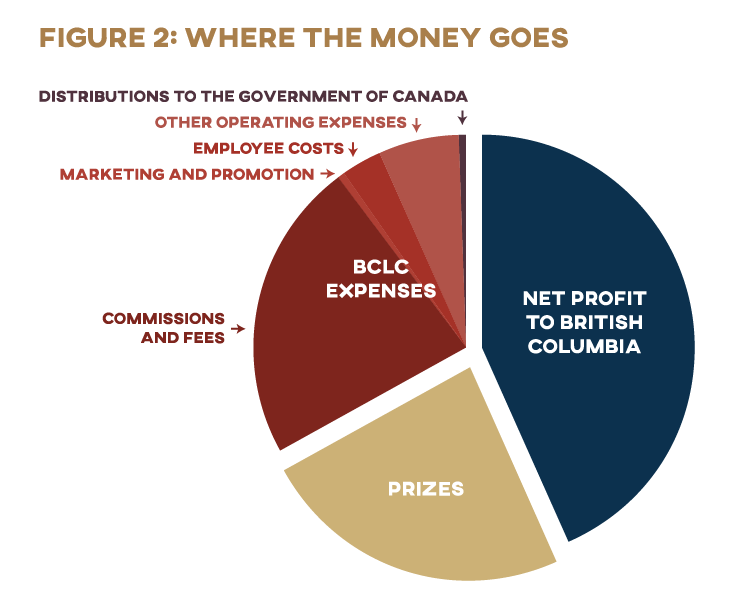
Approximately forty-six cents of every dollar of gambling sales in Alberta is used to cover the gambling industry’s various operating expenses. The difference between Alberta’s share of ticket lottery sales and its net income from these lottery games, representing prizes paid to players and WCLC operational costs, was $605 million (23 percent of sales) last year. Another $434 million (16 percent) was spent on commissions—many of which are paid to private-sector businesses such as facility service providers—and federal payments. AGLC’s other gaming-related operating expenses totaled $202 million (8 percent). Everything left over after these bills have been paid—just over half (54 percent) of gambling sales revenue—goes to the province (Figure 2). 10 10 AGLC, “AGLC Annual Report 2018–19.”
Who's Hooked? Gambling Profits as a Proportion of Provincial Revenue
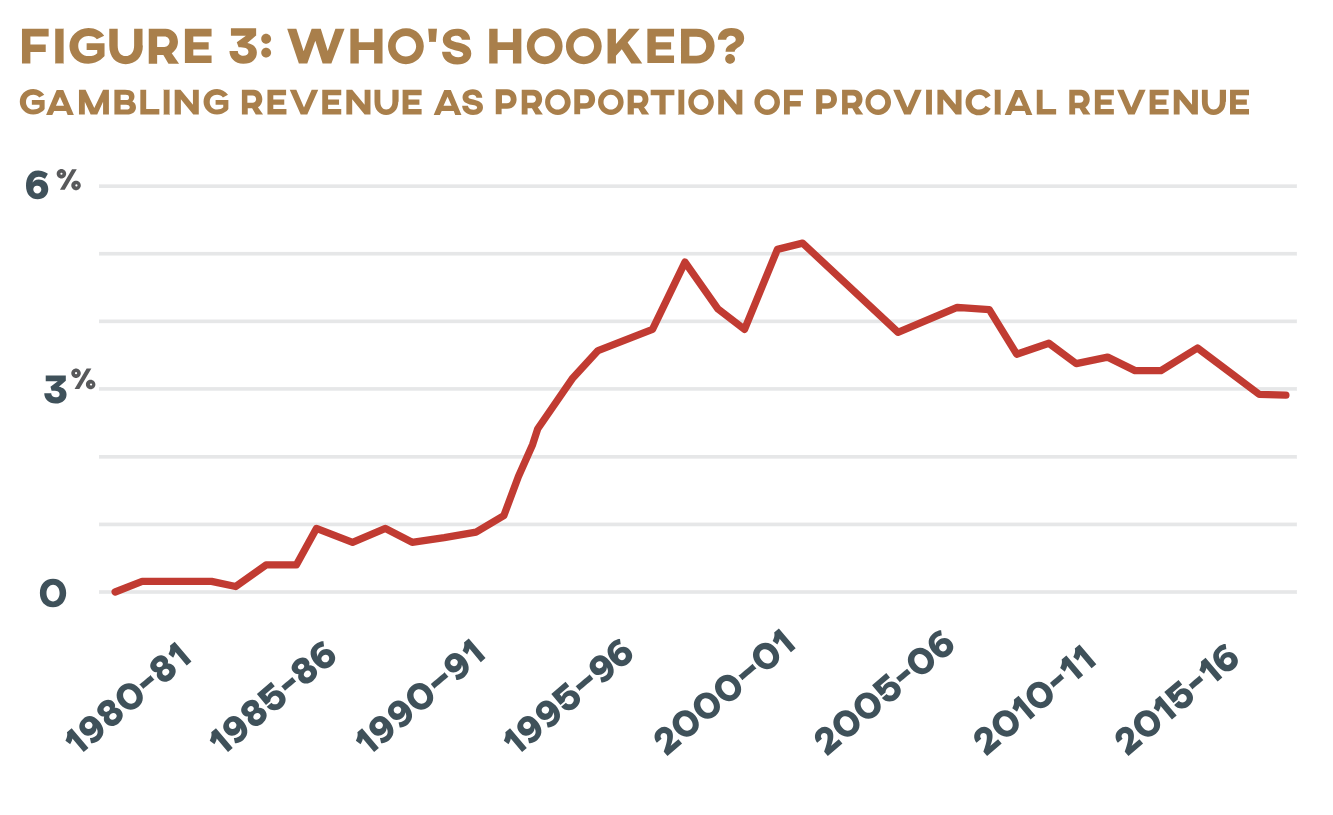
Gambling has become a lucrative source of funds since Alberta ran its first provincial lottery in 1974. As the gambling industry has grown in Alberta, so too has the provincial government’s reliance on it as a source of revenue. Though gambling funds were kept separate from general tax revenues until December 2019, nearly 3 percent of the Alberta government’s income is collected at slot machines, VLT lounges, and lottery checkout lanes (Figure 3). 11 11 Government of Alberta, “Government of Alberta Annual Reports,” https://www.alberta.ca/government-and-ministry-annual-reports.aspx.
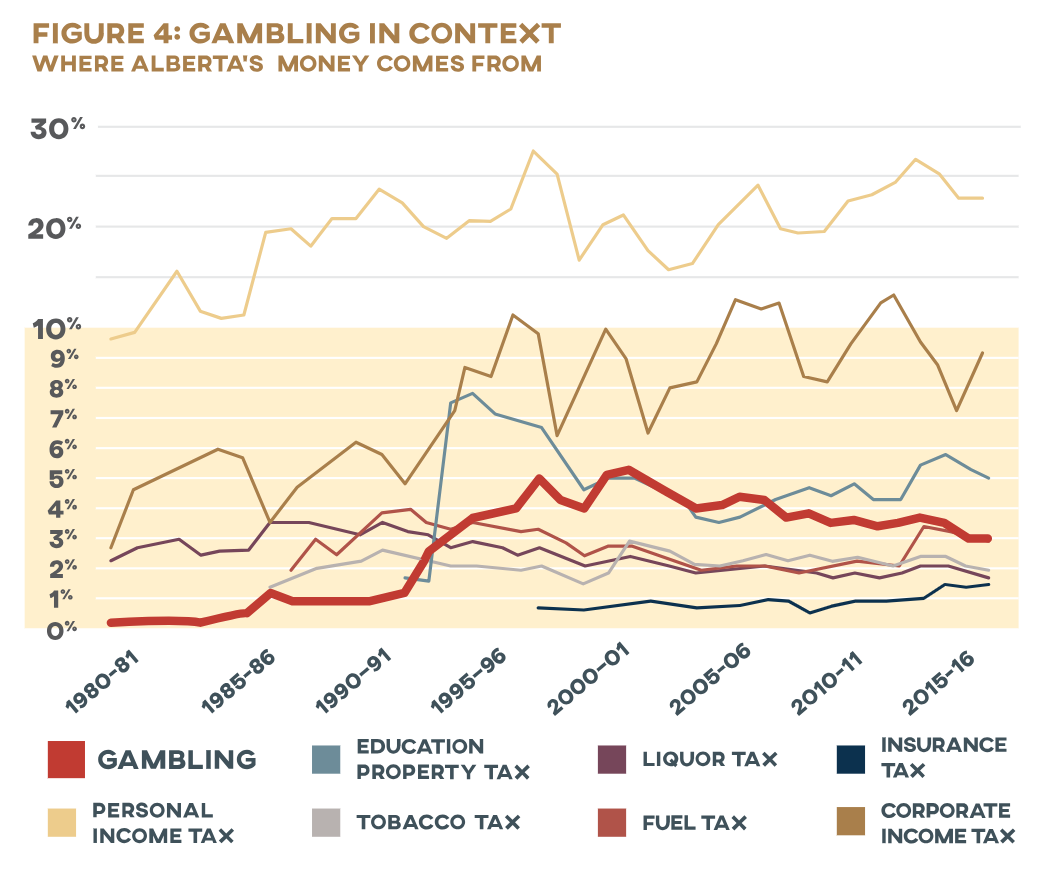
But where is this money coming from? Who, and what communities, are the source of these funds? (Figure 4)
P(l)ayer Profile: Gambling Demographics
Most of Alberta’s population is paying into the pockets of AGLC in one form or another. Survey data indicate that around three in four Albertans (70–74 percent) gamble in a given year, which has declined somewhat since the 1990s (87–90 percent). 12 12 Williams, Belanger, and Arthur, “Gambling in Alberta,” 103. This is roughly consistent with estimates of the Canada-wide average (which hover around 67–81 percent 13 13 Katherine Marshall, “Gambling 2011,” Statistics Canada, Perspectives on Labour and Income, Winter 2011, https://www150.statcan.gc.ca/n1/pub/75-001-x/2011004/article/11551-eng.htm, 6; John McCready et al., “Gambling and Seniors: Sociodemographic and Mental Health Factors Associated with Problem Gambling in Older Adults in Canada,” report on research award for the Ontario Problem Gambling Research Centre, April 2010, 57, https://www.greo.ca/Modules/EvidenceCentre/Details/gambling-and-seniors-sociodemographic-and-mental-health-factors-associated-problem-gamblin-1; M. MacDonald, J. L. McMullan, and D.C. Perrier, “Gambling Households in Canada,” Journal of Gambling Studies 20, no. 3 (Fall 2004): 194. ).
Money In, Money Out: Gambling Spending by Income
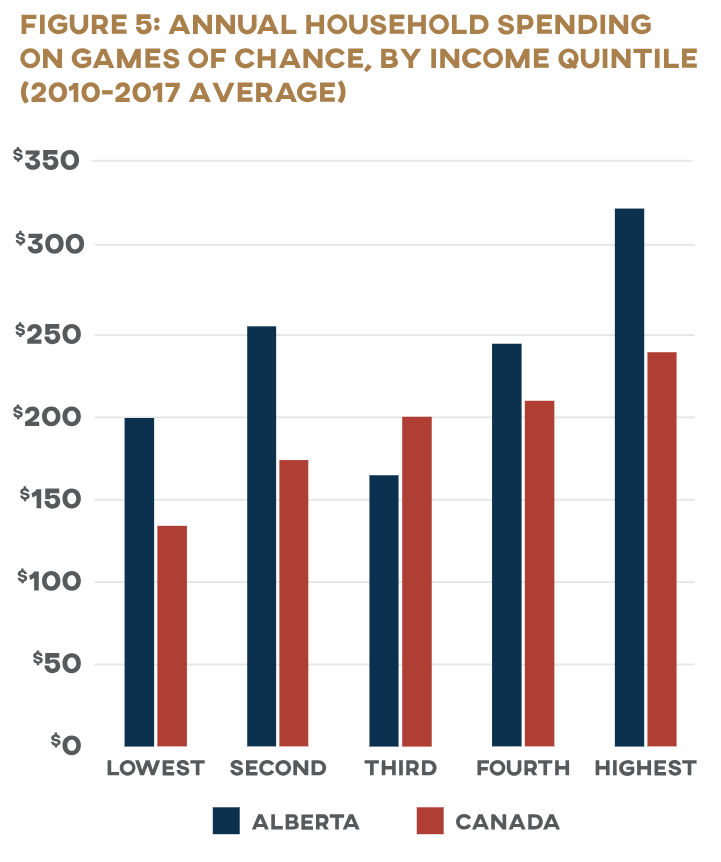
Alberta’s population is not, however, paying AGLC equally. The regressive nature of gambling revenue is hard to see on the surface. The data collected by Statistics Canada’s Survey of Household Spending (SHS) seem to show that those who have more money are more likely to gamble and to spend more money when they do: the average household in Canada’s highest income quintile spends $240 on gambling each year, while the average lowest-quintile household spends a mere $134. A similar pattern emerges for Alberta: highest-quintile households report spending $324, while those in the lowest quintile report spending only $198 (Figure 5). 14 14 Author’s calculations based on data from Statistics Canada, “Table 11-10-0223-01: Household Spending by Household Income Quintile, Canada, Regions and Provinces,” https://www150.statcan.gc.ca/t1/tbl1/en/tv.action?pid=1110022301. For detailed calculation methodology, see B. Dijkema and J. Wolfert, Pressing Its Luck: How Ontario Lottery and Gaming Can Work For, Not Against, Low-Income Households (Cardus, 2020), https://www.cardus.ca/research/work-economics/reports/pressing-its-luck/.
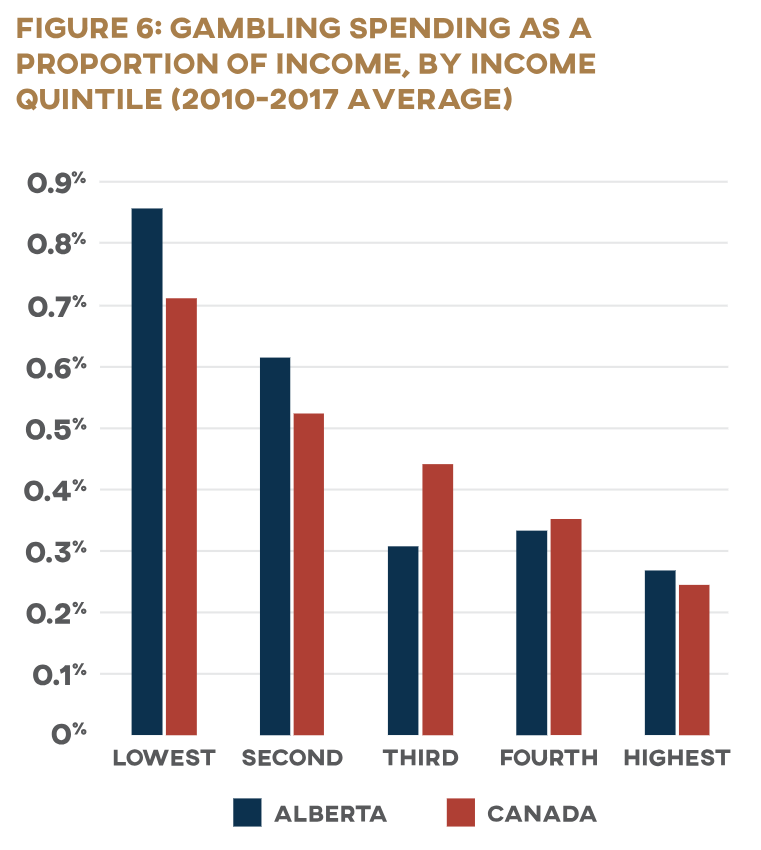
But first glances can be deceptive. Higher earners may be spending more of their paycheques at the casino, but gambling eats up a much higher proportion of the poor’s income (Figure 6). According to SHS data from 2010 to 2017, Alberta’s poorest households spent more than three times as much of their income on gambling as did the richest (0.85 percent compared to 0.26 percent). Households in Canada’s highest income quintile spend an average of 0.24 percent of their after-tax earnings on games of chance each year; those in the lowest quintile spent nearly three times as much, at 0.71 percent. 15 15 All figures are author’s calculations based on data from Statistics Canada’s Canada Income Survey and Survey of Household Spending. Statistics Canada, “Household Spending by Household Income Quintile, Canada, Regions and Provinces”; User Guide to the Survey of Household Spending, 2015 (Ottawa: Income Statistics Division, 2017), https://www150.statcan.gc.ca/n1/en/catalogue/62F0026M2017001; Statistics Canada, “Table 11-10-0193-01: Upper Income Limit, Income Share and Average of Adjusted Market, Total and After-Tax Income by Income Decile,” https://www150.statcan.gc.ca/t1/tbl1/en/tv.action?pid=1110019301. For detailed calculation methodology, see Dijkema and Wolfert, Pressing Its Luck.
Less than 1 percent of a household’s annual earnings may not seem like a lot of money, even for a low-income family. These seemingly low numbers, however, should not distract us from the highstakes problem at play: when Alberta collects lottery and casino money, it is digging deeper into the pockets of the poor than of the rich. Gambling may be a “voluntary” tax (more on the accuracy of this description below as well), but it’s a tax the Alberta government cannot do without, nonetheless— which means that the province is paying its bills in a way that hits low-income families hardest.
The regressive nature of gambling taxes is no secret: research both within Canada and internationally has consistently found that poor households spend a greater percentage of their income on gambling than their wealthier neighbours do.
16
16
See, e.g., R.J. Williams and R.A. Volberg, “Gambling and Problem Gambling in Ontario.” Report prepared for the Ontario
Problem Gambling Research Centre and the Ontario Ministry of Health and Long-Term Care, June 2013. http://hdl.handle.net/10133/3378; MacDonald, McMullan, and Perrier, “Gambling Households in Canada”; J.D. Wisman, “State Lotteries: Using State Power to Fleece the Poor,” Journal of Economic Issues (Association for Evolutionary Economics) 40, no. 4 (December 2006): 955–66; J. Orford et al., “The Role of Social Factors in Gambling: Evidence from the 2007 British Gambling Prevalence Survey,” Community, Work & Family 13, no. 3 (August 2010): 258; T. Bol, B. Lancee, and S. Steijn, “Income Inequality and Gambling: A Panel Study in the United States (1980–1997),” Sociological Spectrum 34, no. 1 (January 2014): 64; K.B. Lang and M. Omori, “Can Demographic Variables Predict Lottery and Pari-Mutuel Losses? An Empirical Investigation,” Journal of Gambling Studies 25, no. 2 (June 2009): 173; S. Castrén et al., “The Relationship Between Gambling Expenditure, Sociodemographics, Health-Related Correlates and Gambling Behavior: A Cross-Sectional Population-Based Survey in Finland,” Addiction 113, no. 1 (2018): 91–92.
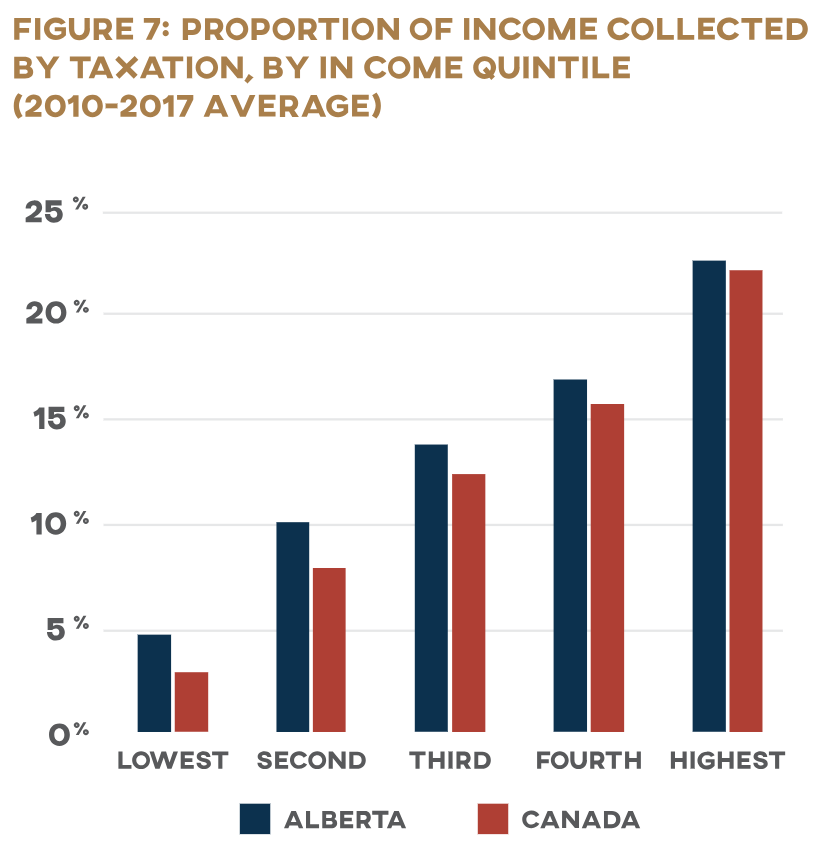
And yet this is exactly the opposite of how other tax revenue functions. Our progressive tax system is designed to tax the rich more heavily than the poor: those who have more pay more. The lowest income quintile in Alberta loses less than 5 percent of its total income to taxation, while the average household in the province’s highest-income quintile turns overto the government nearly five times more of its total income, at 23 percent (Figure 7).
17
17
Author’s calculations based on data from Statistics Canada, “Table 11-10-0193-01: Upper Income Limit, Income Share and Average of Adjusted Market, Total and After-Tax Income by Income Decile.” For detailed calculation methodology, see Dijkema and Wolfert, Pressing Its Luck.
The Demographics Data Gap
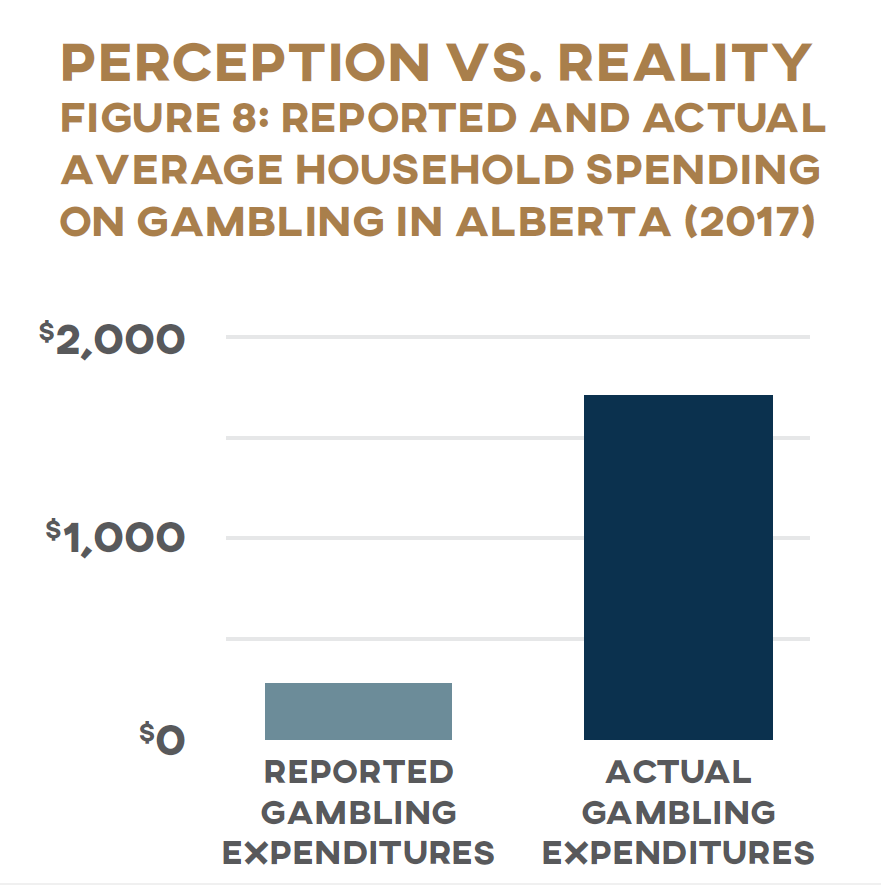
Statistics Canada’s data on spending and income across the country provide a window into the relationship between gambling and household earnings. But these figures are not without their limitations. According to SHS figures, the average Alberta household spent $282 on games of chance in 2017. Multiply this figure by the number of households in Alberta that year (1.5 million
18
18
Statistics Canada, “Table 36-10-0101-01: Distributions of Household Economic Accounts, Number of Households, by Income Quintile and by Socio-demographic Characteristic,” https://www150.statcan.gc.ca/t1/tbl1/en/cv.action?pid=3610010101#timeframe.
), though, and the province’s total gambling spending comes to only $434 million—a mere 16 percent of AGLC’s recorded gaming sales that year ($2.6 billion
19
19
AGLC, “Annual Report 2016–17,” https://aglc.ca/sites/aglc.ca/files/aglc_files/2016-2017_AGLC_Annual_Report.pdf. Figures
adjusted for inflation.
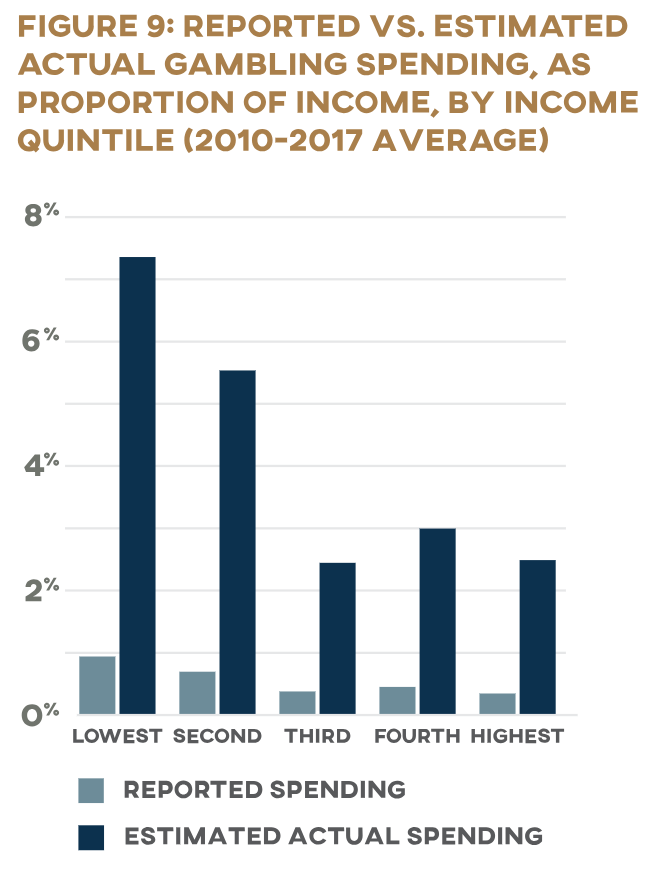
). Put another way, the average Alberta household would have had to gamble just over $1,700 in 2017 for AGLC’s books to balance. And yet the match between self-reported and actual revenue in 2017 was better than usual (Figure 8): the average match between AGLC earnings and SHS expenditure data was only 11.6 percent from 2010 to 2016. This inconsistency is not uncommon: in self-reported household-expenditure surveys, people consistently underestimate how much they actually spend gambling, often dramatically (Figure 9).
20
20
R.T. Wood and R.J. Williams, “‘How Much Money Do You Spend on Gambling?’ The Comparative Validity of Question Wordings Used to Assess Gambling Expenditure,” International Journal of Social Research Methodology 10, no. 1 (2007): 63–77.
Cause for Concern
Though SHS data must be interpreted with caution, what we believe to be the core issue at hand remains: gambling disproportionately burdens the poor, a finding that not only is consistent across provinces in SHS data but has been repeatedly borne out by other research as well. If households across all income quintiles underestimate their gambling spending by approximately the same margin in their SHS expenditure records, this would mean that Alberta’s lowest-income households are spending over 7 percent of their income—about $1,700 a year—on government-sponsored gambling (Figure 10). 21 21 Author’s calculations based on AGLC Annual Reports and Statistics Canada, “Table 11-10-0223-01: Household Spending by Household Income Quintile, Canada, Regions and Provinces.” For detailed calculation methodology, see Dijkema and Wolfert, Pressing Its Luck. The Alberta government uses income taxes, which are set through a transparent process for which it is held publicly accountable, to collect an average of $2,985 per month from households making $13,150 and only $96 from households making $2,040. At the same time, and away from the public eye, it takes another $141 of what remains in the poorest Albertans’ pockets—an average of $1,950 for the month—but just $104 more ($246) from those who have $10,160 of their paycheques left to pay their monthly bills.
There’s strong evidence that other vulnerable populations are paying disproportionately into the coffers of AGLC. Take, for example, Canadian and international studies that establish links between lower levels of education and higher levels of gambling participation. 22 22 See, e.g., M. Abdel-Ghany and D.L. Sharpe, “Lottery Expenditures in Canada: Regional Analysis of Probability of Purchase, Amount of Purchase, and Incidence,” Family and Consumer Sciences Research Journal 30, no. 1 (2001): 64–78; MacDonald, McMullan, and Perrier, “Gambling Households in Canada”; Castrén et al., “The Relationship Between Gambling Expenditure, Socio-demographics, Health-Related Correlates and Gambling Behavior”; A. Tan, S. Yen, and R. Nayga Jr., “Socio-demographic Determinants of Gambling Participation and Expenditures: Evidence from Malaysia,” International Journal of Consumer Studies 34 (2010): 316–25; T. Davidson et al., Gambling Expenditure in the ACT (2014): By Level of Problem Gambling, Type of Activity, and Socioeconomic and Demographic Characteristics (Canberra: Australian National University, 2016), 11,https://www.gamblingandracing.act.gov.au/__data/assets/pdf_file/0010/982774/2014-Gambling-Expenditure.pdf; J. Beckert and M. Lutter, “The Inequality of Fair Play: Lottery Gambling and Social Stratification in Germany,” European Sociological Review 25, no. 4 (August 2009): 475–88. Given that lower levels of education are also linked to lower earnings, 23 23 S. Speer, “Forgotten People and Forgotten Places: Canada’s Economic Performance in the Age of Populism,” Macdonald-Laurier Institute, August 2019, https://macdonaldlaurier.ca/files/pdf/MLI_Speer_ScopingSeries1_FWeb.pdf. the overrepresentation of less-educated groups in the lottery market is likely to amplify the lottery’s regressive effect. Indigenous peoples also have disproportionately lower incomes compared to majority populations and as such are disproportionately affected by the expansion of gambling. 24 24 An in-depth review of the literature on gambling among Indigenous communities is beyond the scope of this paper, but readers are encouraged to explore the substantial body of research on this topic. See, e.g., H. Breen and S. Gainsbury, “Aboriginal Gambling and Problem Gambling: A Review,” International Journal of Mental Health and Addiction 11 (2013): 75–96; D. Wardman, N. El-Guebaly, and D. Hodgins, “Problem and Pathological Gambling in North American Aboriginal Populations: A Review of the Empirical Literature,” Journal of Gambling Studies 17, no. 2 (2001): 81–100; R.J. Williams, R.M.G. Stevens, and G. Nixon, “Gambling and Problem Gambling in North American Indigenous Peoples,” in First Nations Gaming in Canada, ed. Y. Belanger (Winnipeg: University of Manitoba Press, 2011), 166–94; New Zealand Ministry of Health, “Gambling and Problem Gambling: Results of the 2011/12 New Zealand Health Survey,” 2015, https://www.health.govt.nz/publication/gambling-and-problem-gambling-results-2011-12-new-zealand-health-survey; L. Dyall, “Gambling: A Poison Chalice for Indigenous Peoples,” International Journal of Mental Health and Addiction 8 (2010): 205–13; Williams and Wood, The Demographic Sources of Ontario Gaming Revenue; M. Stevens and M. Young, “Betting on the Evidence: Reported Gambling Problems among the Indigenous Population of the Northern Territory,” Australian & New Zealand Journal of Public Health 33, no. 6 (December 2009): 556–65; C. Currie et al., “Racial Discrimination, Post Traumatic Stress, and Gambling Problems among Urban Aboriginal Adults in Canada,” Journal of Gambling Studies 29, no. 3 (2013): 393–415.
Research also suggests that Alberta’s gambling addiction is being fed disproportionately by gambling addicts. Those classified as problem gamblers make up an estimated 1.5 percent to 3 percent of Alberta’s total adult population, depending on how problem gambling is defined and measured in a given survey. 25 25 Williams, Belanger, and Arthur, “Gambling and Problem Gambling in Alberta,” 165. For a collected summary of provincial gambling prevalence studies conducted in Canada, see Alberta Gambling Research Institute, “Prevalence—Canada Provincial Studies,” last modified June 17, 2016, https://abgamblinginstitute.ca/resources/reference-sources/prevalence-canada-provincial-studies. As with other addictions, there is an abundance of evidence suggesting that problem gambling is more likely to afflict society’s vulnerable and marginalized, being linked to lower income, minority ethnic status, less formal education, alcohol abuse, and higher rates of psychiatric disorders. 26 26 For a concise overview of this research, see R. Volberg, L. McNamara, and K. Carris, “Risk Factors for Problem Gambling in California: Demographics, Comorbidities and Gambling Participation,” Journal of Gambling Studies 34 (2018): 360–63; see also F.K. Lorains, S. Cowlishaw, and S.A. Thomas, “Prevalence of Comorbid Disorders in Problem and Pathological Gambling: Systematic Review and Meta-Analysis of Population Surveys,” Addiction 106 (2011): 490–98; R. Williams, R. Volberg, and R. Stevens, “The Population Prevalence of Problem Gambling: Methodological Influences, Standardized Rates, Jurisdictional Differences, and Worldwide Trends,” report prepared for the Ontario Problem Gambling Research Centre and the Ontario Ministry of Health and Long-Term Care, February 2012, https://opus.uleth.ca/handle/10133/4838.
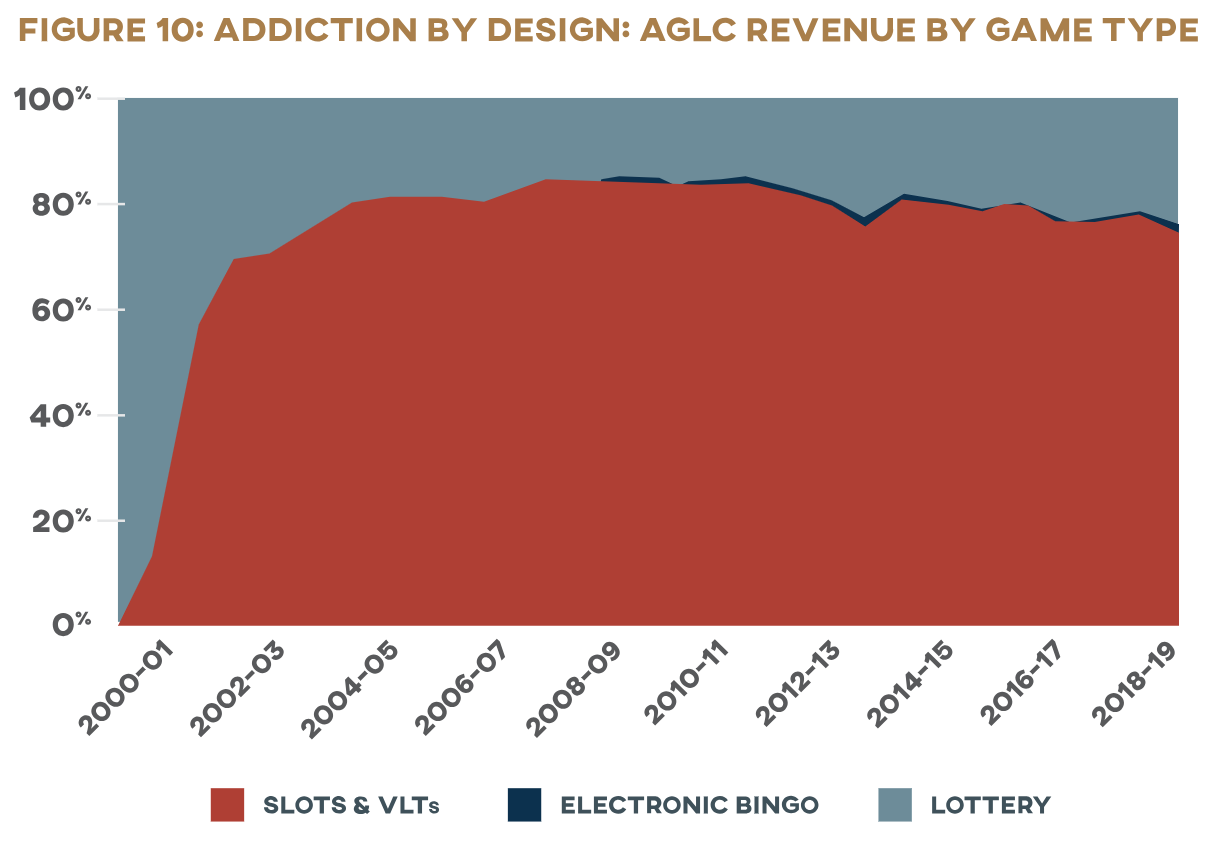
One of the most consistent correlates of problem gambling is game type (Figure 10): those who report gambling on electronic gambling machines (EGMs, usually known as slot machines when found inside casinos, and as video lottery terminals, or VLTs, when found in other venues such as pubs and bars) have a much higher risk of problem gambling than do gamblers who report never playing EGMs. 27 27 Williams et al., “Gambling in Alberta,” 105.
These machines have been particularly scrutinized for their addictive design. 28 28 N.D. Schüll, Addiction by Design: Machine Gambling in Las Vegas (Princeton: Princeton University Press, 2012), discussed in Matthew Crawford, “Autism as a Design Principle: Gambling,” in The World Beyond Your Head: On Becoming an Individual in an Age of Distraction (New York: Farrar, Straus and Giroux, 2015), 89–112. EGMs have provocatively been described by some researchers as “the crack cocaine of gambling” (N. Dowling, D. Smith, and T. Thomas, “Electronic Gaming Machines: Are They the ‘Crack-Cocaine’ of Gambling?,” Addiction 100 [2005]: 33–45), though Dowling et al. conclude that despite the consistent association in the literature between EGMs and “the highest level of problem gambling,” the empirical evidence available at time of writing was insufficient to definitively “establish the absolute ‘addictive’ potential of EGMs” (42). See also V.V. MacLaren, “Video Lottery Is the Most Harmful Form of Gambling in Canada,” Journal of Gambling Studies 32, no. 2 (June 2016): 459–85; Gambling Research Exchange Ontario, “Slots and VLTs,” https://www.greo.ca/en/topics/slots-and-vlts.aspx; Centre for Addiction and Mental Health, “About Slot Machines,” https://www.problemgambling.ca/gambling-help/gambling-information/about-slot-machines.aspx; J. Rosengren, “How Casinos Enable Gambling Addicts,” The Atlantic, December 2016, https://www.theatlantic.com/magazine/archive/2016/12/losing-it-all/505814/. EGMs are built with features that impair players’ rational control, such as losses disguised as wins—where audio and visual effects celebrate a player’s “winning” an amount less than he or she wagered, even though the player lost money—and near misses, where the display of symbols makes it appear that the player was close to winning, even though the outcome of each play is completely random. These structural characteristics manipulate players’ emotional and cognitive perceptions of the game to keep them playing longer and spending more. 29 29 C. Livingstone, “How Electronic Gambling Machines Work,” 2, https://aifs.gov.au/agrc/sites/default/files/publication-documents/1706_argc_dp8_how_electronic_gambling_machines_work.pdf; see also K.A. Harrigan et al., “Research Briefing Note: Summary of the Effect and Regulation of Electronic Gaming Machine Near Misses and Losses Disguised as Wins (LDWs) on Players,” Gambling Research Exchange Ontario, August 24, 2016, https://www.greo.ca/Modules/EvidenceCentre/Details/research-briefing-note-summary-effect-and-regulation-electronic-gaming-machine-near-misses; Harrigan, “Gap Analysis: Structural Characteristics of EGMs as Indirect Risk Factors for Problem Gambling Versus the Gaming Regulations,” Gambling Research Exchange Ontario, https://www.greo.ca/Modules/EvidenceCentre/Details/gap-analysis-structural-characteristics-egms-indirect-risk-factors-problem-gambling-versus-1; C. Jensen et al., “Misinterpreting ‘Winning’ in Multiline Slot Machine Games,” International Gambling Studies 13, no 1 (2012): 112–26, DOI: 10.1080/14459795.2012.717635. AGLC collects a substantial majority of its gambling revenue from EGMs: 76 percent of the corporation’s net income came from slot machines and VLTs last year. If more than three-quarters of the province’s gambling tax is collected by machines designed to override players’ conscious control, can this tax really be called “voluntary”?
Gaming Out a Government Gaming Policy
Alberta’s government is addicted to gambling. AGLC money is treated exactly the same way as general tax revenue is—even though this “voluntary tax” is not collected equitably, as the data show. Through the gambling industry, the state is digging deeper into the pockets of those who have the least, so that it can keep public programs and services for the rest of the province artificially cheap. How, then, can the government be weaned off this unhealthy and unjust dependency?
Getting Clean: Cold Turkey
We suggest that the massive economic upheaval created by the COVID-19 pandemic and its containment measures represents a unique opportunity for the provincial government to cut its addiction to gambling money cold turkey. At time of writing, the total cost of the outbreak on Alberta’s finances is impossible to predict, but the $1.4 billion Alberta stands to lose in gambling income is certain to pale in comparison. The province’s finances will need to be rebuilt after the COVID-19 crisis subsides, and this rebuilding project should include structures preventing the government from depending on AGLC profits to pay its bills. Social-distancing measures have already cut off the province’s flow of gambling money: casinos have been shut down just as most other public gathering facilities have, and the amount of revenue going into public coffers from gambling is likely to be at historic lows. 30 30 Global News, “Province orders Alberta casinos to Close amid COVID-19 Pandemic,” March 17, 2020, https://globalnews.ca/news/6690441/coronavirus-alberta-casinos-mass-gathering-limits/. COVID-19 provides the province with an unprecedented opportunity for it to start clean. The costs to the treasury will never be lower. Moving gambling revenue out of the general fund and into a specific fund—preferably aimed at relief of poverty—would be the equivalent of the government admitting it has a problem, admitting that it has harmed the public it is intended to serve, and forming the first steps to making direct amends. 31 31 Gamblers Anonymous, “Recovery Program,” http://www.gamblersanonymous.org/ga/content/recovery-program.
Habit Forming
Once AGLC funds have been disentangled from legitimate tax revenue, then, how could they be used to advance the state’s responsibility to administer justice for the most vulnerable? One approach is to redistribute gambling money back to the poor directly. A second strategy is to use AGLC profits to incentivize saving in accounts geared toward financially fragile households. The economic fallout of the COVID-19 outbreak, involving sudden layoffs on an unprecedented scale, has drawn attention to the importance of assets like emergency savings to cover an unexpected loss of income 32 32 Many Canadians are asset-poor, making them particularly vulnerable to the loss of income accompanying an unexpected layoff. See J. Robson, “Assets in the New Government of Canada Poverty Dashboard: Measurement Issues and Policy Implications,” presentation to the Canadian Economics Association, May 31, 2019, https://www.dropbox.com/s/4ty0pqay5vkuq7j/Presentation_Robson_CEA2019.pdf?dl=0, https://www.compassworkingcapital.org/why-asset-poverty-matters, https://www.mcgill.ca/newsroom/channels/news/half-canadians-dont-have-enough-savings-250447. Yet close to half of Canadians do not have enough to cover their living expenses for three months. 33 33 D. Rothwell and J. Robson, “The Prevalence and Composition of Asset Poverty in Canada: 1999, 2005, and 2012,” International Journal of Social Welfare 27, no. 1 (2018): 17–27; McGill Newsroom, “Half of Canadians Don’t Have Enough Savings,” May 11, 2015, https://www.mcgill.ca/newsroom/channels/news/half-canadians-dont-have-enough-savings-250447; Erica Alini, “Coronavirus: Nearly 1 Million Canadians Applied for EI Last Week,” Global News, March 24, 2020, https://globalnews.ca/news/6726111/coronavirus-ei-claims-1-million/. Why not channel Albertans’ desire for the excitement of chance toward activities that help them build up an emergency fund? Prize-linked savings (PLS) products, in which accountholders forgo some or all of the interest they would normally earn on their savings in exchange for the chance to win a prize, have met with notable success in other jurisdictions, from Britain’s national lottery bonds to the “Save to Win” program offered by credit unions across the United States. 34 34 National Savings and Investments, “Premium Bonds,” https://www.nsandi.com/premium-bonds-25?ccd=NQBPAC; Save to Win, “History of Save to Win,” http://www.savetowin.org/product-info/history-of-save-to-win; Michigan Credit Union League, “Save to Win Celebrates 10 Years, $50 Million Saved in First Half of 2019,” July 23, 2019, https://www.mcul.org/News?article_id=29123.
Making Sure the Right House Wins
One of the responsibilities of government is to enable and encourage good habits, including economic ones, and to shape structures that promote the economic well-being of its citizens. It is important to remember that the saturation of our society with gambling fosters in its inhabitants a distinct set of habits, attitudes, and dispositions that have social and economic consequences. Gambling is not the way to financial security, neither for individuals nor for the province.
35
35
L. Dadayan, “State Revenues From Gambling: Short-Term Relief, Long-Term Disappointment,” The Nelson A. Rockefeller
Institute of Government, April 2016, https://rockinst.org/issue-area/state-revenues-gambling-short-term-relief-long-term-disappointment/.
Contrary to what lottery ads would have us believe, people shouldn’t hope to get something for nothing—nor should the state encourage this insidious get-rich-quick impulse. When the state does its part to advance a positive vision of economic life, it nurtures in its citizens virtues that benefit not just pocketbooks (both private and public) but society as a whole.
36
36
D.N. McCloskey, “Bourgeois Virtues?,” Cato Policy Report, May 18, 2006, https://www.deirdremccloskey.com/articles/bv/cato.php.
It’s time for government to fulfill its responsibility to turn bad habits into good.