
Table of Contents
Table of Contents

Executive Summary
The federal budget of 2021 offers national daycare at a cost of $30 billion over five years, with an annual cost of $9.2 billion after that. This sounds like a lot of funding, but is it enough?
This research report offers a detailed assessment of the real cost of national daycare and the amounts that provincial governments will realistically be responsible for contributing once the federal funding is spent.
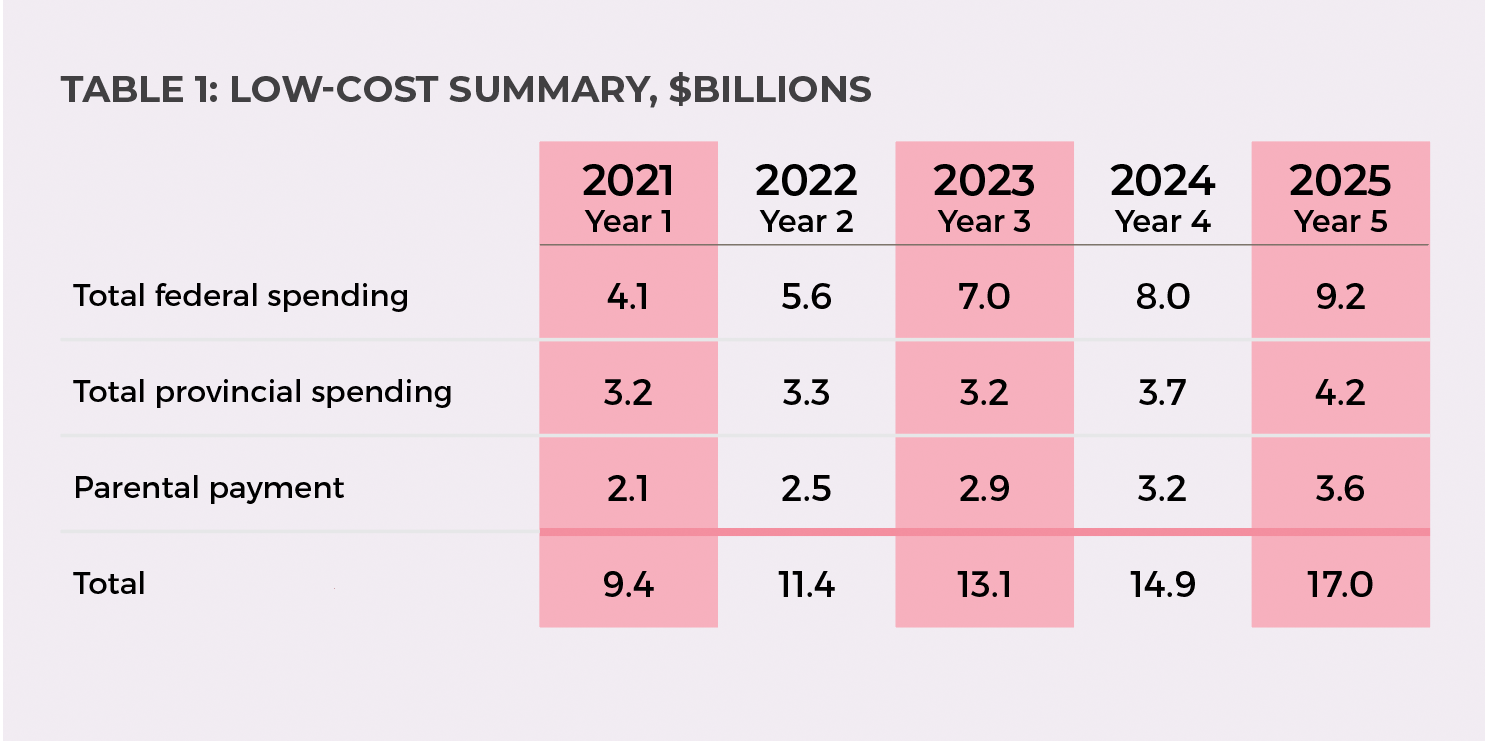
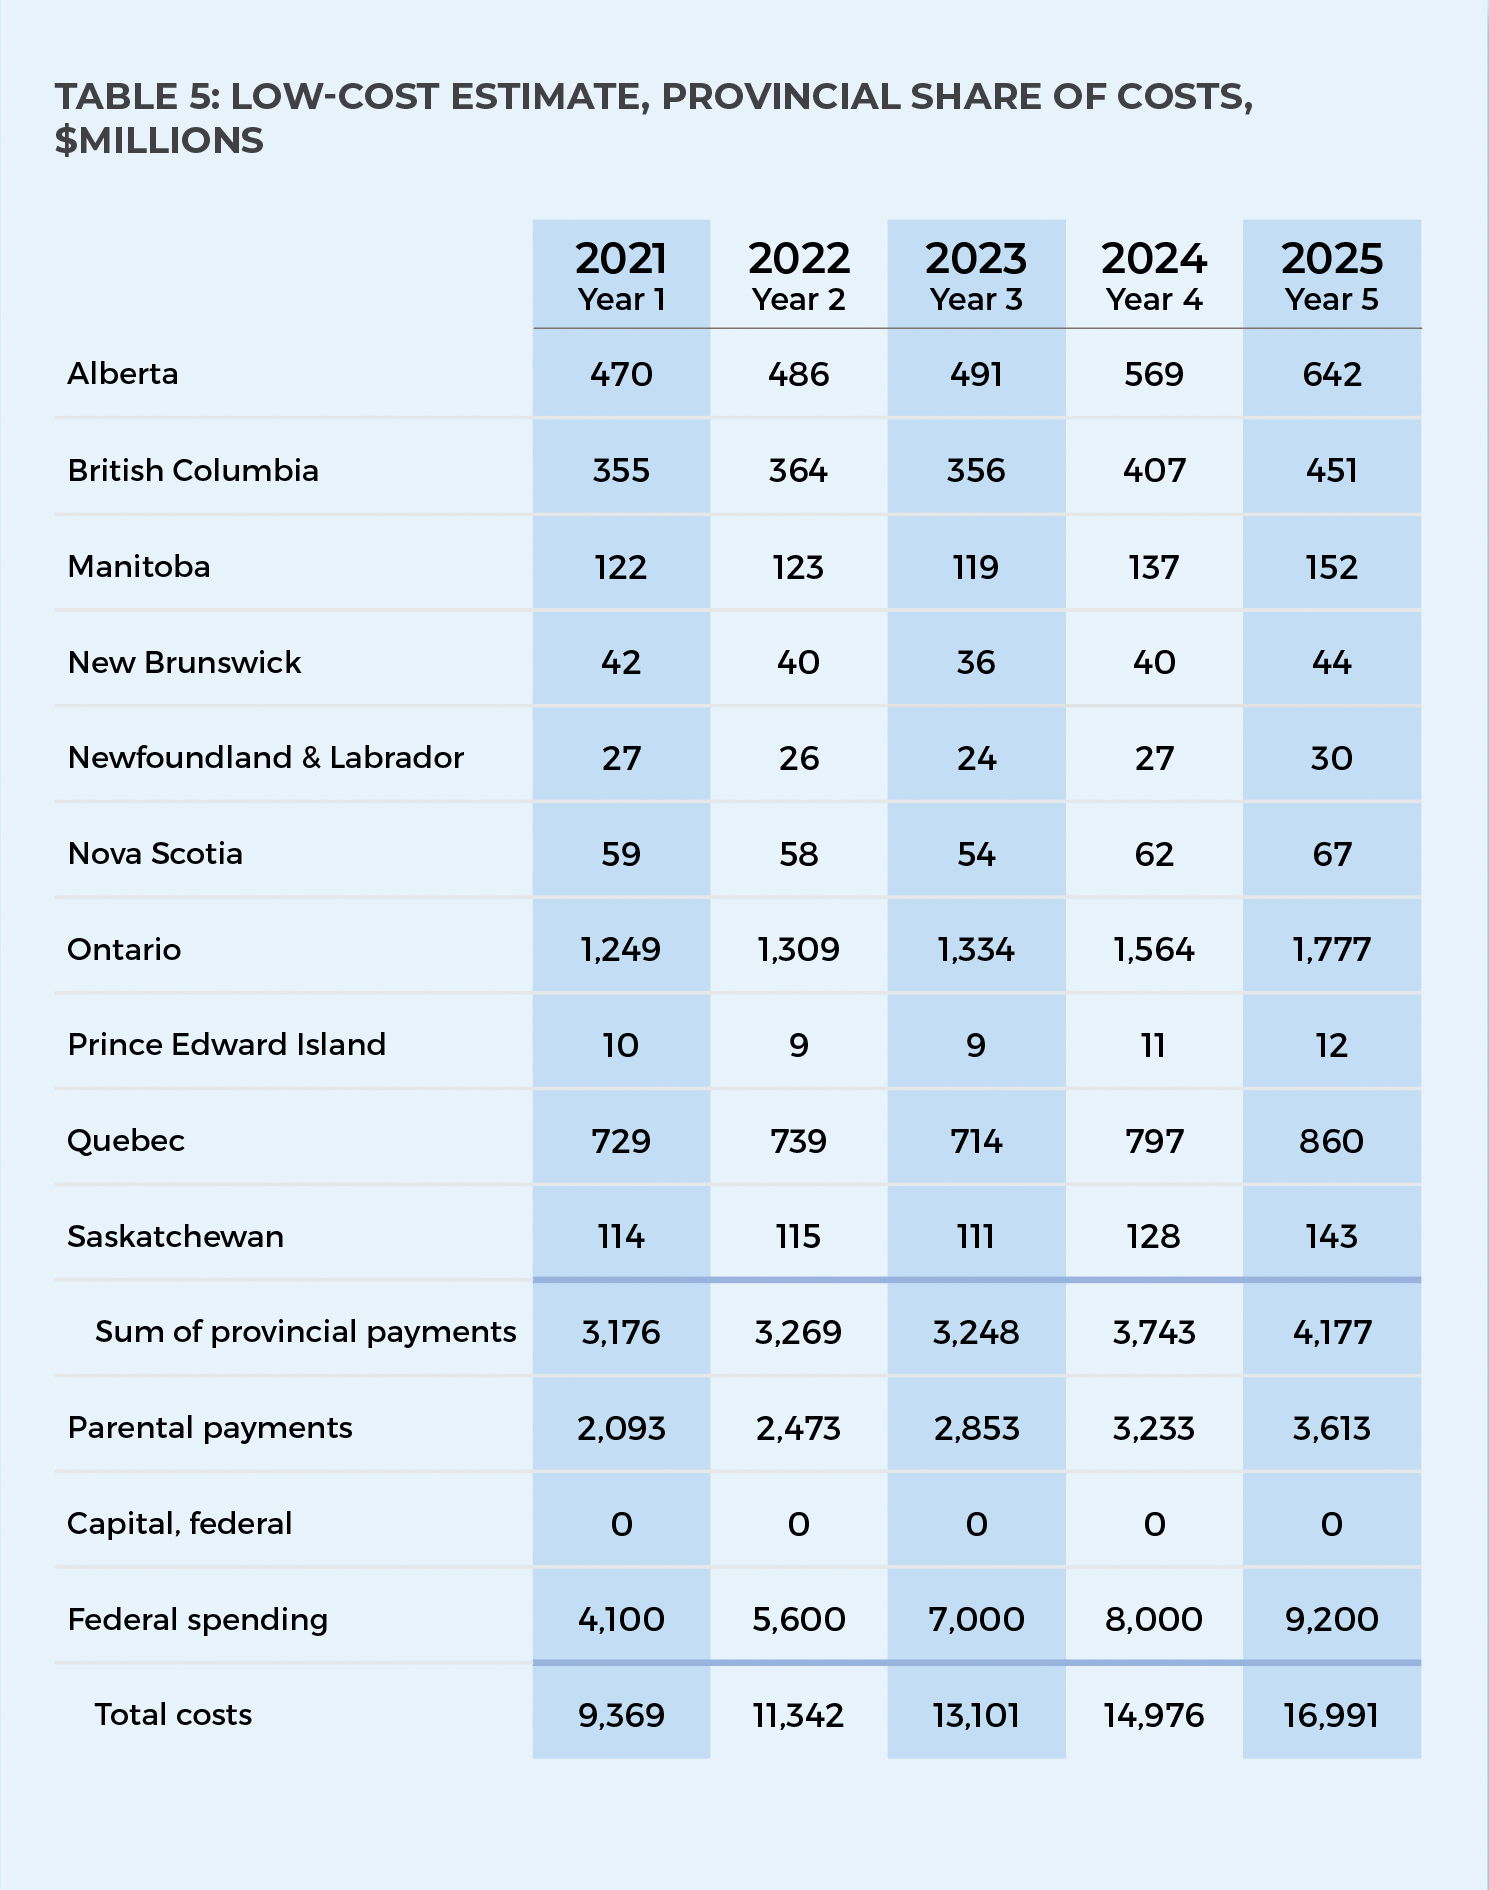
Our low-cost model is estimated at $17 billion total in year five, with the federal contribution being $9.2 billion and parents covering $3.6 billion through user fees. This leaves the provincial governments to fund the remaining $4.2 billion.
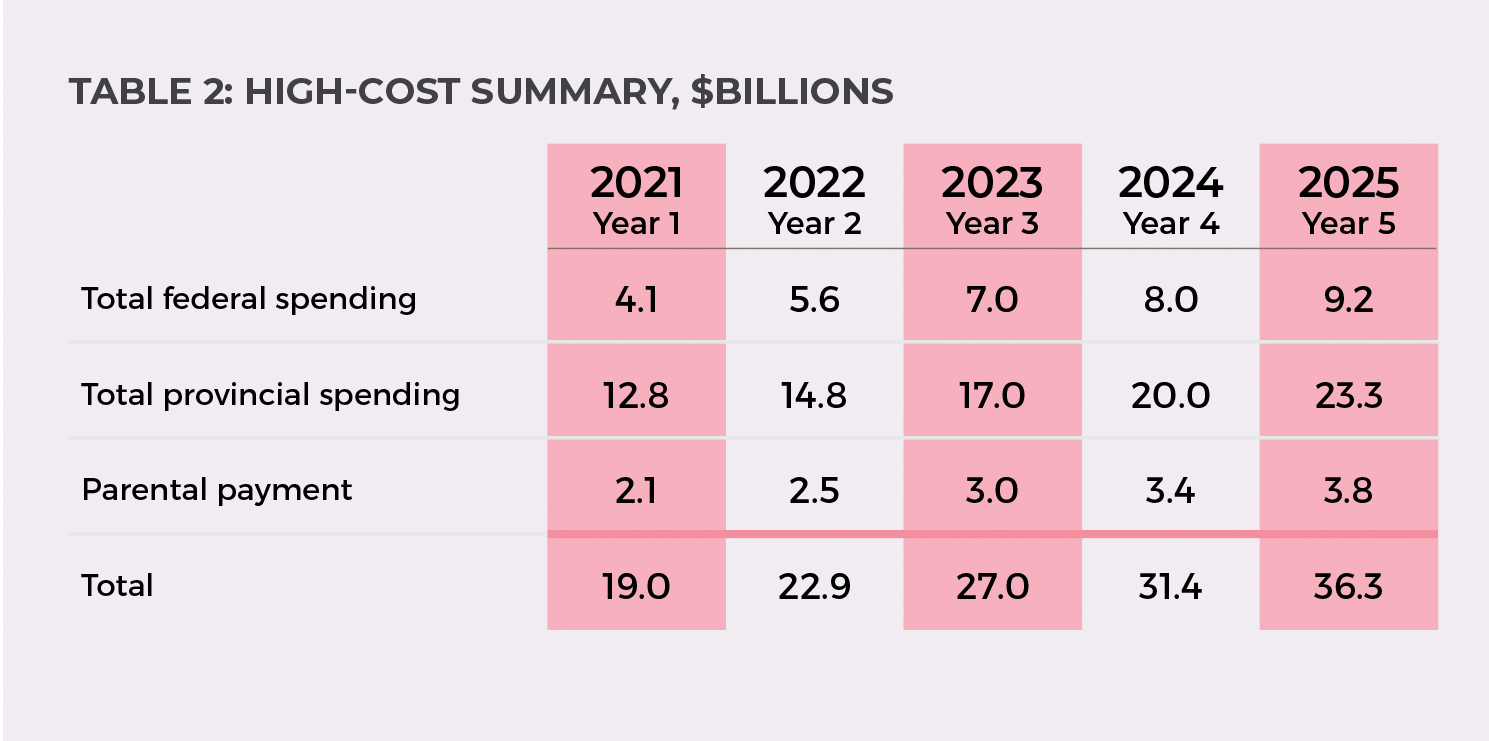
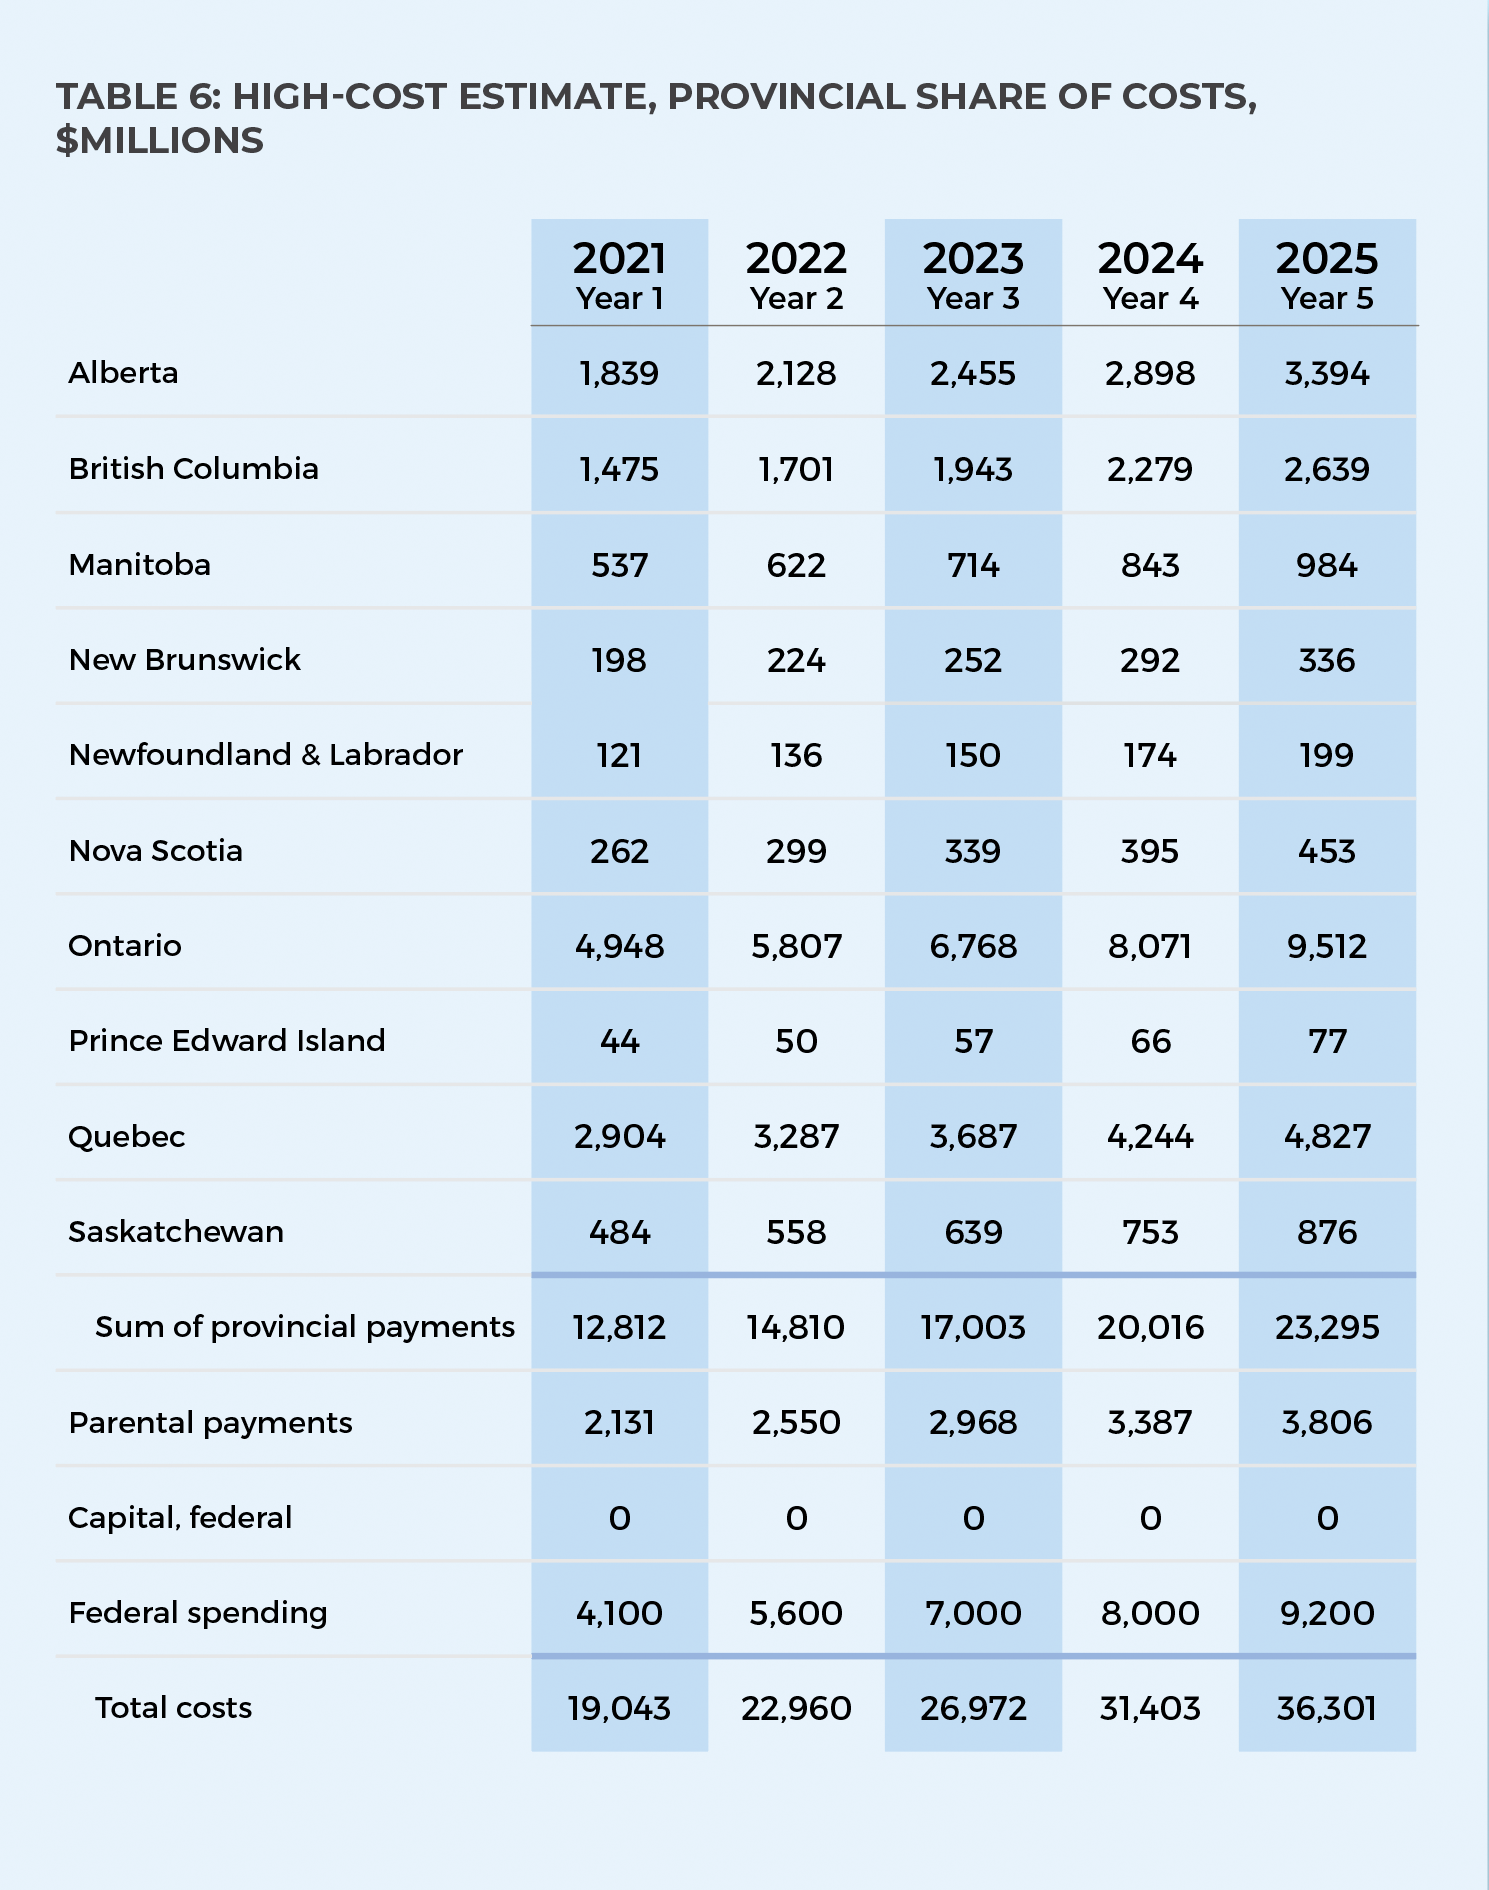
Our high-cost model rings in at $36.3 billion total in year five, with the federal government again covering $9.2 billion and parents covering $3.8 billion through user fees. In this scenario, the provinces are left to cover $23.3 billion.
Our high and low estimates reflect different assumptions primarily relating to staff-to-child ratios, per-space payments for home daycares, square footage per child, and Early Childhood Educator (ECE) salary growth in child-care centres over time. Different numbers of infants in care are also assumed, and infant care is particularly expensive.
Our low-cost estimate assumes the staff-to-child ratios that are currently found in Quebec, which is the province with the highest numbers of children per staff member. Given these high ratios, and the peer-reviewed research suggesting that children in Quebec have experienced poorer outcomes after the introduction of the system, we must ask whether we will experience these same outcomes on a national level if our low-cost estimate, and, by implication the federal government’s current proposal, is implemented.
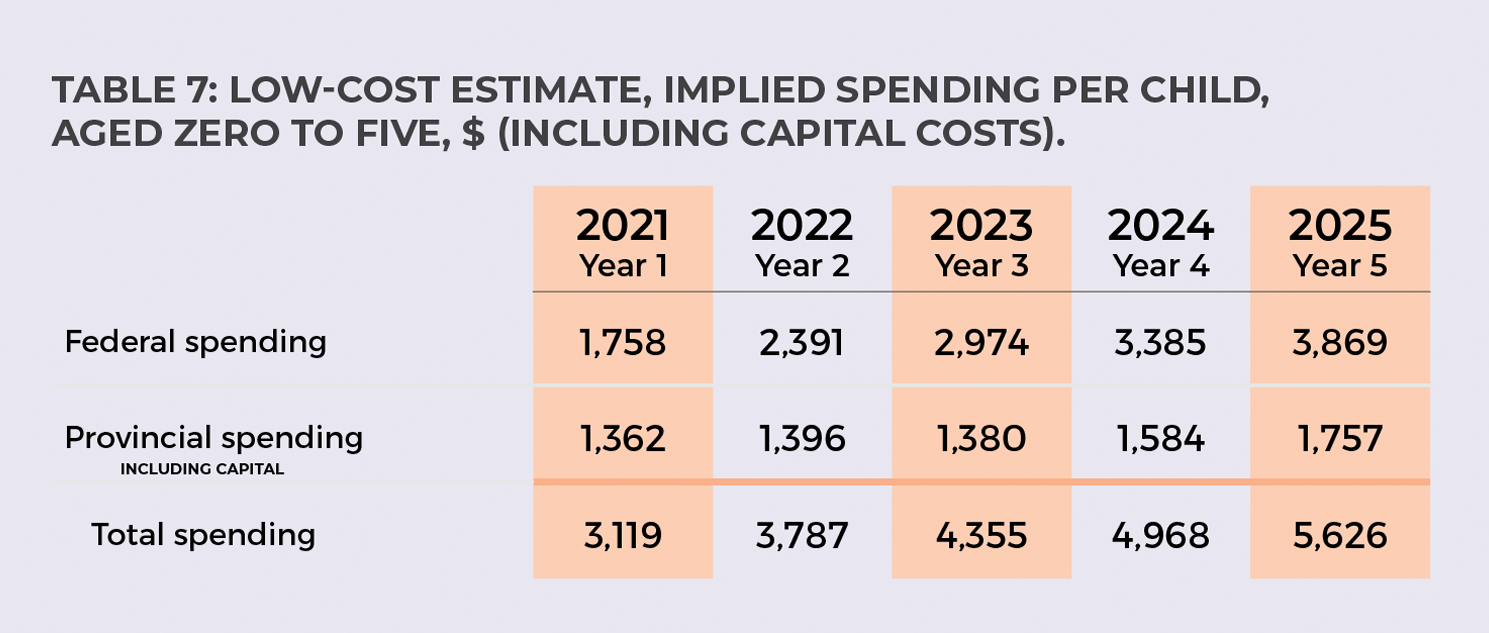
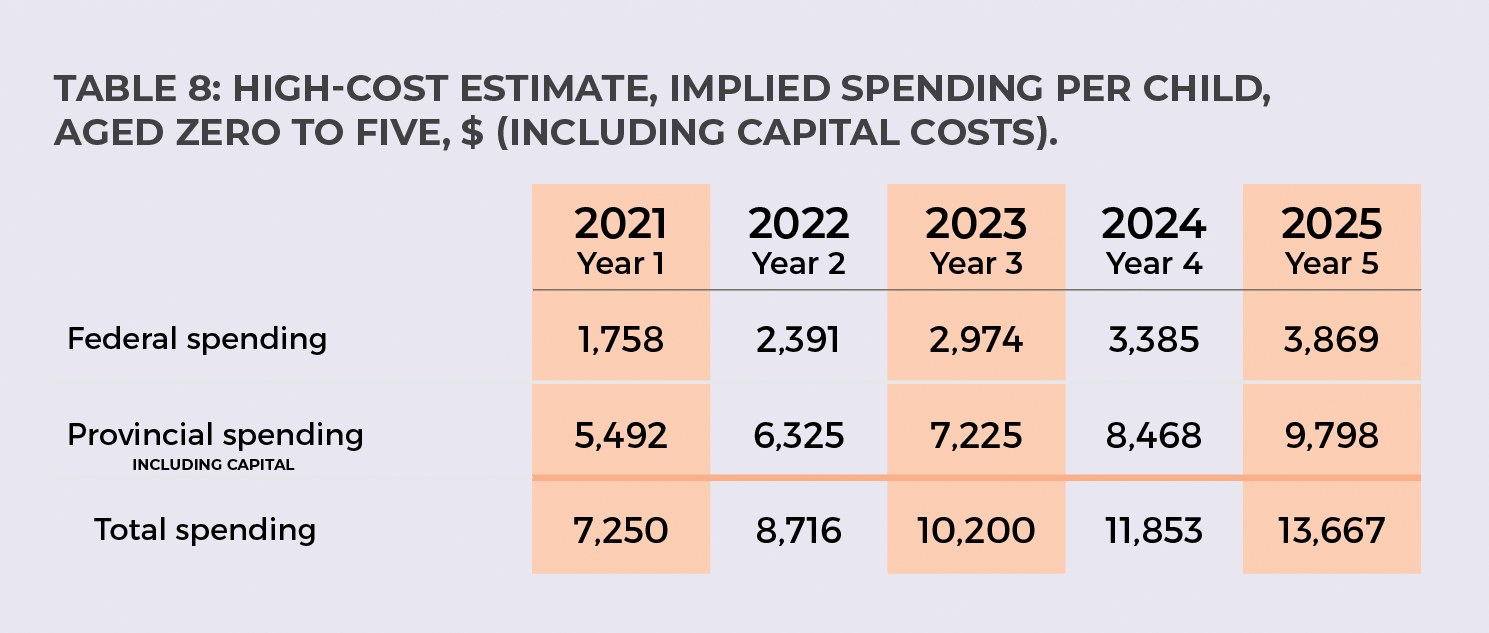
The government is choosing to spend money on daycare spaces in a national system, instead of strengthening the full ecosystem of care that Canadian families currently use, that many prefer because it better meets their needs, and that exists throughout the country regardless of population density. Further, it treats all families the same, regardless of financial need. If the federal money alone were allocated to children rather than to spaces, the per-child amount would be $3,869 annually. If the federal and provincial monies allocated in our low estimate went to children under age six, each could receive $5,626 annually. If the monies allocated in our high estimate went to children under age six, each could receive $13,667 annually. If the payments were allocated via a means-tested vehicle like the Canada Child Benefit, those with the lowest incomes would stand to receive significant benefit.
Our model calculates the provincial share of daycare funding as the difference between the federal and parent contribution and our cost estimates. The federal government promises a fifty-fifty cost sharing with the provinces, but this sharing is not guaranteed over time. How the provinces will handle funding shortfalls is unknown. Thus the risk of an uneven distribution of care, or care of mediocre or poor quality, is a significant possibility.
Since our real-cost estimates exceed the funding promised in the federal budget, we have determined the cost to the provinces to make up the gap. In the high estimate, the ongoing annual costs for the provinces range from a low of $76 million in Prince Edward Island to a high of $9.5 billion in Ontario.

Introduction
Many families in Canada struggle with the high cost of child care. Indeed, for some households it may be the largest expenditure after the essentials of food, clothing, and shelter. Particularly for parents in low-wage occupations, child care may consume the majority of the income gained from employment, leading to a rational decision to forgo work outside the home. It is understandable, therefore, that governments consider policies to alleviate the financial burden of child care and boost labour-force participation.
The federal budget of 2021 has allocated substantial funding to a national daycare system: $30 billion over five years, progressively increasing to $9.2 billion annually beyond the initial five-year commitment. But what will be the real cost of national daycare in Canada? The short answer: a lot more than what the federal government is offering.
By our calculations, the federal government’s funding is insufficient for a high-quality, universal program. Either few Canadian families will benefit, or the program will provide widely accessible but low-quality care. In this study, we provide a detailed assessment that decision-makers (and Canadian families) can use to better understand what national daycare truly costs—and how those costs are calculated.
Our low-cost model amounts to $17 billion by the fifth year and estimates that the annual federal payments for the system are $9.2 billion, with parents covering $3.6 billion through user fees. This leaves the provincial governments funding $4.2 billion beyond the federal payments. It is worth noting that this cost is possible only at the poorest staff-to-child ratios currently in place in Canada, in the province of Quebec. Peer-reviewed research consistently shows that the Quebec system is of poor quality and has negative outcomes for children and parents alike. 1 1 M. Baker, J. Gruber, and K. Milligan, “The Long-Run Impacts of a Universal Child Care Program,” American Economic Journal: Economic Policy 11, no. 3 (August 2019): 1–26, https://doi.org/10.1257/pol.20170603; M. Baker, J. Gruber, and K. Milligan, “Universal Child Care, Maternal Labor Supply, and Family Well‐Being,” Journal of Political Economy 116, no. 4 (August 2008): 709–45, https://doi.org/10.1086/591908; M.J. Kottelenberg and S.F. Lehrer, “New Evidence on the Impacts of Access to and Attending Universal Childcare in Canada,” Working Paper, National Bureau of Economic Research (February 2013), https://doi.org/10.3386/w18785; M.J. Kottelenberg and S.F. Lehrer, “Does Quebec’s Subsidized Child Care Policy Give Boys and Girls an Equal Start?,” Canadian Journal of Economics / Revue Canadienne d’économique 51, no. 2 (2018): 627–59, https://doi.org/10.1111/caje.12333.
The high-cost model rings in at $36.3 billion by the fifth year, with the federal government again covering $9.2 billion and parents covering $3.8 billion through user fees. The provinces are left to cover the remaining $23.3 billion.
For both our low- and high-cost estimates, we list the realistic expenses that we were not able to include in our assessment. This makes our cost estimates more conservative.
Proponents of national daycare advocate for a universal program for various reasons. The recent heavy emphasis on increasing female labour-force participation, to the exclusion of other considerations however, along with the low funding allocation, should ring alarm bells for parents about the quality of care their children will receive. A truly universal program for Canada will cost as much as four times the annual budgeted amount for year five of $9.2 billion at the federal level.
Advocates for all kinds of child care can agree that high-quality child care in the early years has developmental benefits and that low-quality child care can do harm. There is little Canadian research about the developmental benefits of family-based care. In the words of economist James Heckman, “It’s amazing to me, when we see these high rates of return on early childhood programs, and I’ve written about them, we get returns of about 13% per annum. I’m willing to bet that if we really evaluated what the benefits were of a mother working with the child, we’d find rates of return of more like 30 or 40%. But nobody has ever studied it.” 2 2 A. Mrozek, “Nobel Laureate James Heckman: ‘The Family Is the Whole Story,’” Institute for Family Studies, March 15, 2021, https://ifstudies.org/blog/nobel-laureate-james-heckman-the-family-is-the-whole-story-.
Thus, our primary concern in doing this study is not with costs, GDP, or female labour-force participation. Our concern is with how national daycare will meet the needs of Canadian families, whether it can provide quality care for children efficiently and equitably, and whether it can address the diversity of care needs across a country as large as ours. The national plan as currently conceived provides no assistance, and may indeed harm, other forms of care that children are now receiving due to arrangements made with family members, neighbours, and community, as well as home-based and centre-based providers—forms of care that parents are choosing because it is what works best for them and for their child. Instead, the plan focuses on economic growth by promoting labour-force participation and some forms of care over others. While it is reasonable for governments to seek economic growth, they should also be interested in Canadians’ well-being in all its dimensions. When given a choice, most parents make decisions about work and child care not with a view to GDP expansion but according to what they believe to be best for their family.
The Numbers
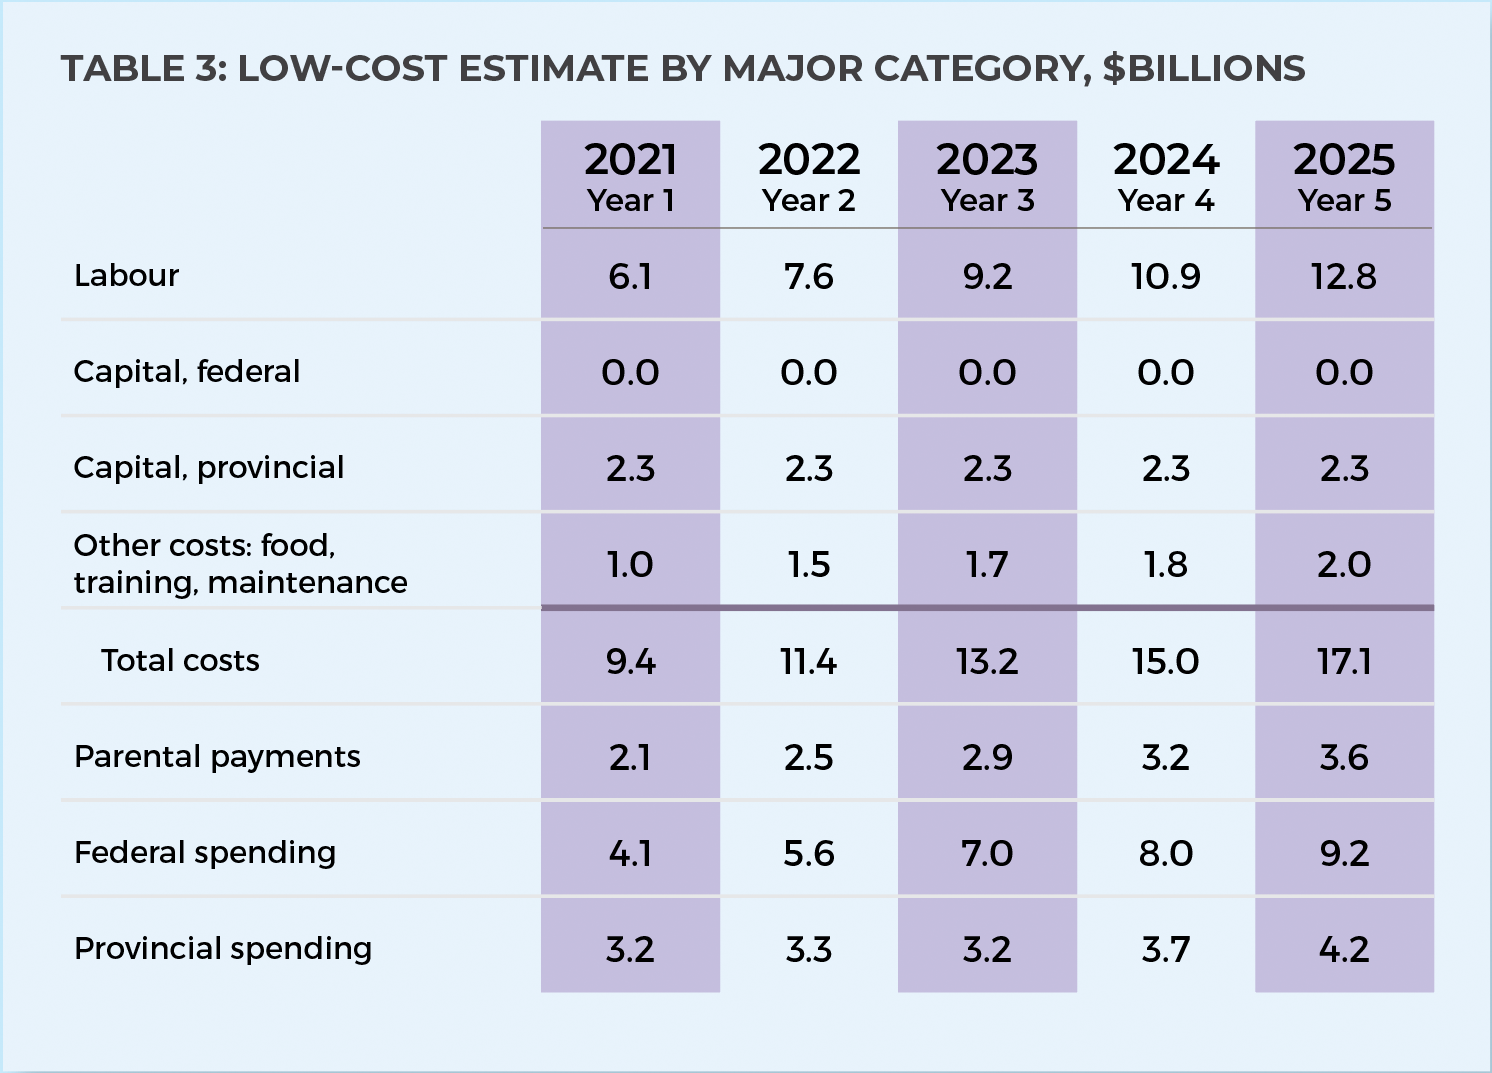
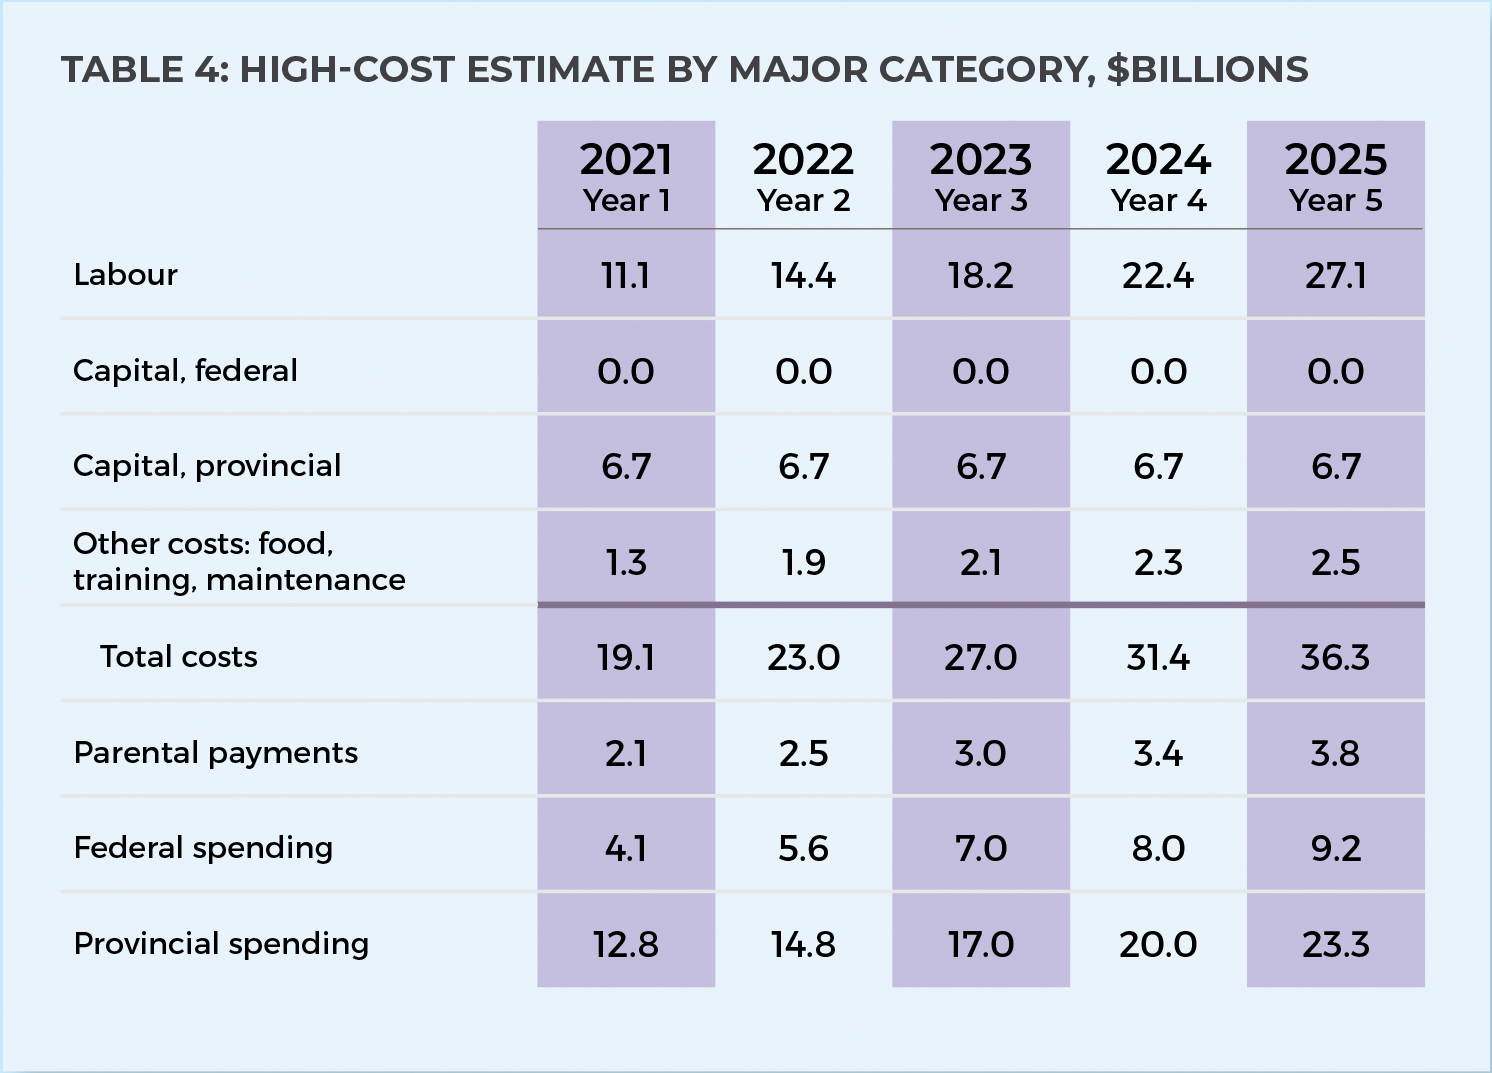
The tables below provide estimated annual funding, as well as the estimated annual costs by major category. We also outline annual provincial costs and annual per child spending. Each of these is calculated with a low and a high estimate. Note that numbers may not add up due to rounding.
Direct Costs Excluded
There are significant costs beyond the scope of our estimates:
- Costs associated with a separate approach for Canada’s Indigenous peoples. This deserves its own real-cost estimate. Budget 2021 includes $2.5 billion over the next five years for Indigenous families. 7 7 Government of Canada, Department of Finance, “Budget 2021,” April 19, 2021, https://www.budget.gc.ca/2021/home-accueil-en.html. Neither are Canada’s territories included.
- Before- and after-school care for children aged six and over. This is a reasonably foreseeable area of system growth, which will come with a significant price tag.
- The development of full-day kindergarten for four- and five-year-olds for provinces currently without this—a significant, and complex, cost in its own right. 8 8 Walberg and A. Mrozek, “The Cost of a Free Lunch,” Cardus (blog), November 25, 2009, https://www.cardus.ca/research/family/articles/the-cost-of-a-free-lunch/.
- Costs associated with bureaucratic oversight. The federal budget mentions a Federal Secretariat on Early Learning and Child Care, costing $34.5 million over five years and $3.5 million ongoing. 9 9 Government of Canada, “Budget 2021.” Similar expenditure at the provincial level is also a reasonable assumption.
- Certain operational items such as liability insurance, education-related equipment, office supplies, transportation, and increased sanitation and hygiene costs after the pandemic.
Indirect Costs Excluded
There are numerous analyses of the costs and benefits of early-intervention / child care. While there can be benefits to high-quality interventions, there are also risks. In this section, we identify risks that have financial implications. While our model omits these costs, policymakers should consider that these additional costs may arise, particularly in the case of low-quality care.
- Children in child care (even before the pandemic) are more susceptible to illness in daycare, which results in costs associated with more trips to the doctor and more sick time taken by parents, among other factors. 10 10 Baker, Gruber, and Milligan, “Universal Child Care, Maternal Labor Supply, and Family Well‐Being.” One Canadian study found that children in daycare are at greater risk of obesity, which also comes with increased health risks and thus health costs. 11 11 Pearce, “Daycare Linked to Obesity Risk in Kids, Quebec Study Finds,” Globe and Mail (November 19, 2012), https://www.theglobeandmail.com/life/the-hot-button/daycare-linked-to-obesity-risk-in-kids-quebec-study-finds/article5428334/.
- Economists Baker, Gruber, and Milligan reported in 2008 that the introduction of the universal child-care program in Quebec was associated with an increase in early-childhood anxiety and aggression. 12 12 Baker, Gruber, and Milligan, “Universal Child Care, Maternal Labor Supply, and Family Well‐Being.” This means an increase in mental-health responses in schools and hospitals.
- The same economists in 2019 examined the persistence of negative outcomes in a follow-up study, finding significant decline in self-reported health and life satisfaction in the teen years. Strikingly, the study discovered a sharp increase in criminal behaviour compared to that of teens in other provinces. 13 13 Baker, Gruber, and Milligan, “The Long-Run Impacts of a Universal Child Care Program.” This too, will come with increased public costs.
- Economists Kottelenberg and Lehrer found that the negative outcomes in Quebec were not merely a relic of the first few years of the program but persisted with later cohorts of children. 14 14 J. Kottelenberg and S.F. Lehrer, “New Evidence on the Impacts of Access to and Attending Universal Child-Care in Canada,” Canadian Public Policy 39, no. 2 (2013): 263–86, https://ideas.repec.org/a/cpp/issued/v39y2013i2p263-286.html. Further study found that the negative outcomes were larger for children entering the program at younger ages. 15 15 M.J. Kottelenberg and S.F. Lehrer, “Do the Perils of Universal Childcare Depend on the Child’s Age?,” CESifo Economic Studies 60, no. 2 (June 1, 2014): 338–65, https://doi.org/10.1093/cesifo/ifu006. The Quebec program increased employment among mothers with young children. 16 16 Kottelenberg and Lehrer, “Does Quebec’s Subsidized Child Care Policy Give Boys and Girls an Equal Start?” It is reasonable a national program will increase the number of young children entering the system.
- Baker, Gruber, and Milligan found that in addition to these child outcomes, parents had negative outcomes as well, experiencing more difficulties in parenting. Parents reported increased maternal depression and lower satisfaction in the spousal relationship. 17 17 Baker, Gruber, and Milligan, “Universal Child Care, Maternal Labor Supply, and Family Well‐Being.” These findings have implications for public health services.
- In Quebec, private care collapsed with the advent of the provincial system. 18 18 Fortin, L. Godbout, and S. St-Cerny. “Impact of Quebec’s Universal Low-Fee Childcare Program on Female Labour Force Participation, Domestic Income, and Government Budgets.” Université de Sherbrooke, May 2012, 3. https://www.oise.utoronto.ca/atkinson/UserFiles/File/News/Fortin-Godbout-St_Cerny_eng.pdf. If this occurs in the rest of Canada, there will be costs associated with rectifying the disruption to the ecosystem of care. As a side note, this loss of private care will also mean that many female entrepreneurs will lose their businesses, 19 19 A. Munday and J. Weisz, “Opinion: $10-a-Day Child Care Needs to Serve All Working Parents,” Globe and Mail (April 20, 2021), https://www.theglobeandmail.com/business/commentary/article-10-a-day-child-care-needs-to-serve-all-working-parents/. despite Budget 2021 expressly aiming to encourage women’s labour-force participation.
- After the introduction of the Quebec system, 72 percent of families received less financial assistance from the provincial government than they did before. 20 20 Baril, P. Lefebvre, and P. Merrigan, “Quebec Family Policy: Impact and Options,” IRPP (January 2000), https://irpp.org/research-studies/quebec-family-policy-impact-and-options/. There is a risk that funding the real costs of a national program will require funding cuts to other services, such as health care. 21 21 J. Ibbitson, “Provincial Governments Should Be Wary of Liberals’ Cost-Shared Child Care Pledge,” Globe and Mail, April 27, 2021, https://www.theglobeandmail.com/politics/article-provincial-governments-should-be-wary-of-liberals-cost-shared-child/; G. Roth, “Ginny Roth: Massive-Spending Liberal Budget Cynically Ignores Health-Care Transfers,” National Post (April 23, 2021), https://nationalpost.com/opinion/ginny-roth-massive-spending-liberal-budget-cynically-ignores-health-care-transfers.

Methodology
General
Our models assumes a five-year phase in of new child-care spaces, for 70 percent of children aged one through five, a percentage suggested by national-daycare proponents. 22 22 This is based on work from A. Yalnizyan and K. McCuaig, “Investing in Early Learning and Child Care: A Framework for Federal Financing,” Atkinson Foundation (September 16, 2020), https://atkinsonfoundation.ca/atkinson-fellows/posts/investing-in-early-learning-and-child-care/. We include staff compensation costs in daycare centres, as well as some smaller items such as food, training, utilities, and maintenance. We include capital costs for building roughly 837,000 new, licensed spaces, which is the number of additional spaces that will be required to accommodate the children as defined above. Capital costs were adapted with some variation from a recent report from the Centre for Future Work. 23 23 J. Stanford, “Child Care Expansion Would Boost Economic Recovery, Study Finds,” Centre for Future Work (November 25, 2020), https://centreforfuturework.ca/2020/11/25/child-care-expansion-would-boost-economic-recovery-study-finds/. We also include payments to home-daycare operators, which are calculated differently from the centre costs and are explained below. While Budget 2021 does not specify whether the government is considering centre-based care only, or centre-based and home daycare, our model includes both of these.
During the five-year phase in, costs are added incrementally. A key driver of the costs in our model is the assumption that Early Childhood Educator salaries rise to compete with kindergarten teacher salaries in order to retain ECEs—a point we explain in detail later in this section. Other wages and salaries in the calculations grow at 1 percent per year, based on observed growth in teacher salaries in Canada over the period 2013 through 2019. 24 24 OECD Stat, “Teachers’ Actual Salaries,” https://stats.oecd.org/Index.aspx?DataSetCode=EAG_TS_ACT. While we do not explicitly account for inflation in our estimates, the growth of ECE salaries described below does account for cost-of-living increases. Labour compensation is the bulk of the costs in national daycare.
We incorporate user payments of $10 per space, per day, as given in Budget 2021. Existing federal funding, plus an assumed new federal contribution growing to $8.4 billion per year, for a total federal contribution of $9.2 billion in year five are taken from the recent federal budget.
We provide a low-cost and a high-cost estimate. The main differences involve differing assumptions about staff-to-child ratios, per-space payments for home daycares, and square footage per child and cost per square foot in the capital costs. There is also a different expectation of ECE salary growth in centres, over time. We also offer differing assumptions about the percentage of infants in care, and infant care is more expensive compared to the care of older children.
Provincial Cost-Sharing
Total costs, less the parental and federal contributions, yield our estimates of the amount the provinces will be expected to contribute to the national plan. We do not attempt to quantify how much the provinces are already spending on childcare. Given that Quebec already has a system, Budget 2021 “proposes to proceed with an asymmetrical agreement with the province of Quebec that will allow for further improvements to their system.” Our assumption is that Quebec will receive the same level of federal funding as the other provinces.
The federal payments have been set in the Budget 2021. Thus, it is the provincial contribution that changes in our cost assessment, as a reflection of the fact that the federal contribution has already been made clear but the costs of an actual daycare program far exceed these contributions. We assume that the provinces will be left to cover the remaining cost of a national daycare system, especially after the five years of federal funding delineated in Budget 2021 ends. This is a real concern when we consider that the budget did not respond to provincial calls for a federal infusion to provincial health care budgets. 25 25 J. Ibbitson, “Provincial Governments Should Be Wary of Liberals’ Cost-Shared Child Care Pledge”; Roth, “Ginny Roth.”
Rollout
Proponents of national daycare plans have suggested both five-year 26 26 Yalnizyan and McCuaig, “Investing in Early Learning and Child Care.” and ten-year 27 27 Stanford, “Child Care Expansion Would Boost Economic Recovery, Study Finds.” rollouts. We assume a five-year rollout, given political expectations and the significant risk that subsidizing certain types of care could distort the existing ecosystem of care. If care options for parents are lost as a result of the government’s distortion of this ecosystem, as they were in Quebec, 28 28 Fortin, Godbout, and St-Cerny, “Impact of Quebec’s Universal Low-Fee Childcare Program on Female Labour Force Participation, Domestic Income, and Government Budgets,” 3. governments will need to move rapidly to fix the problem.
Population
Baseline population (by single year of age) in 2020 is taken from Statistics Canada’s current estimates. 29 29 Statistics Canada, Table 17-10-0057-01 Projected population, by projection scenario, age and sex, as of July 1 (x 1,0000), https://www150.statcan.gc.ca/t1/tbl1/en/tv.action?pid=1710000501. Population projections (by single year of age) for 2021 through 2030 are from Statistics Canada’s projections. 30 30 Statistics Canada, Table 17-10-0057-01, M2 scenario, medium growth. The M2 population projection scenario was used as we consider the assumptions underlying it to produce a reasonable approximation of how population will grow. The 2020 baseline population values are combined with projections by adding year-to-year growth in projected values to the previous year.
No attempt has been made to account for any disruptions to this estimate caused by Covid-19. 31 31 Other disruptions caused by Covid-19 are also unaccounted for, such as an increase in the cost of building supplies.
Population in Care, Children Aged One through Five
The population in child care is determined as the product of population (by single year of age) and the assumed share of the population needing the care. The assumed share for children aged one through five is set at 70 percent in both the low-cost and high-cost scenarios. Budget 2021 is unclear about just how many children will be incorporated into the national daycare program. Our share is based on the average share observed in OECD countries, as cited by some Canadian national-daycare advocates. 32 32 Yalnizyan and McCuaig, “Investing in Early Learning and Child Care.”
Percentage of Infants (12 Months and Younger) in Care
An assumption of 70 percent of children in care makes little sense for infants, however, given Canada’s eighteen months of parental leave available after the birth of a child. Creating spaces for 70 percent of infants would inflate costs, as infant care is more expensive.
In the low-cost estimate, we assume spaces for 13 percent of infants. Statistics Canada reports that 24 percent of infants are in non-parental care, 33 33 “Participation in child care also differed based on the child’s age. About two-thirds of 1 to 3 year olds (68%) and 4 and 5 year olds (65%) were in child care, compared with about one-quarter of children under the age of 1 (24%). The lower participation rate of infants reflects the fact that some parents have access to parental leave.” Statistics Canada, “The Daily—Survey on Early Learning and Child Care Arrangements, 2019” (April 10, 2019), https://www150.statcan.gc.ca/n1/daily-quotidien/190410/dq190410a-eng.htm. with a high percentage of these being cared for by relatives. Statistics Canada states that “Children who were under the age of 1 were most likely to be cared for by a relative (46 percent of infants in child care).” That means that 54 percent of infants are in care that is not a parent or relative. Fifty-four percent of 24 percent amounts to 13 percent of infants under age one who will need a daycare space. 34 34 Statistics Canada, “The Daily,” Table 2.
In the high-cost estimate, we assume that 33 percent of infants need a child-care space—a significant increase over the current reality in Canada. We derive this from examining the data in Quebec, which has its provincial system. A recent report notes 74,400 children under age one in Quebec; 13,502 of these are in regulated family child-care, and 10,825 are in CPEs and garderies. 35 35 M. Friendly et al., “Early Childhood Education and Care in Canada,” Childcare Resource and Research Unit, 58, https://childcarecanada.org/sites/default/files/ECEC-Canada-2019-full-publication-REV-12-2-21.pdf. This makes for a total of 24,327 infants in some form of family child-care, CPE, or other daycare. Thirty-three percent of infants therefore are in non-parental or non-family care.
Population in Care, in Home Daycare vs. Daycare Centres
Canada has a diverse ecosystem of care, but direct funding and licensing is limited to home daycare and centre-based care.
The share of population in care that is in home daycare, rather than centre-based care, is the same in the high and low estimates. Of children in care, Statistics Canada reports that 24.4 percent of children under age one are in a home daycare, and 23.7 percent of children aged one to three are in a home daycare. Of children aged four and five, 14.2 percent are in a home daycare. 36 36 Statistics Canada, Table 42-10-0005-01, “Type of Child Care Arrangement, Household Population Aged 0 to 5 Years,” April 9, 2021, https://www150.statcan.gc.ca/t1/tbl1/en/tv.action?pid=4210000501.
Whether home daycare use stays the same, increases, or decreases as a result of federal distortion of the existing ecosystem of child care remains unclear. For further discussion of this point, see “Questions for Parents and Provinces,” in the final section of this report.
We assume that spaces are added to home daycares and daycare centres such that the proportions in the base year are consistent throughout the analysis period.
Number of Home-Daycare Operators Required
The number of operators required to take care of the children in home daycares is based on the population that are in home daycare (by single year of age) and assumed operator-to-child ratios. The assumed ratios explained below do not fit neatly within the single year of age breakdowns, so several of the population categories are split and we assume that births are spread evenly throughout the year to facilitate these splits.
We also assume that children aged four and five are in full-day kindergarten and therefore only require before- and after-school care. Given that full-day kindergarten for four- and five-year-olds is not available uniformly across Canada at present, this assumption makes our cost assessment conservative in both the high and the low estimates.
The assumed operator-to-child ratios in home daycare are the same in the low- and the high-cost scenarios. For ages zero to eighteen months, the assumed ratio is one staff for two infants. Our ratio for children aged nineteen months to twenty-four months is one staff to three babies, and for twenty-five months to age five it is one staff for six children, based on an average of existing legal ratios for home daycares across Canada. Provinces have different regulations about how many children a home operator can care for. For example, in Saskatchewan a home provider, whether licensed or unlicensed, can care for up to eight children, including the provider’s own children. 37 37 Government of Saskatchewan, “How Child Care Works in Saskatchewan.” https://www.saskatchewan.ca/residents/family-and-social-support/child-care/how-child-care-works. In neighbouring Manitoba, this drops to four children in an unlicensed private home. 38 38 Government of Manitoba, “A Guide to Child Care in Manitoba.” https://www.gov.mb.ca/fs/childcare/families/guide_childcare/index.html.
The costs associated with home daycares for each age category are calculated as the number of daycare operators times the number of children allowed, multiplied by the annual per-space funding. Summing across all age categories yields the total cost for the year.
Per-Space Payment for Home Daycares
The costs of care in home daycares are built around an operator, working from home. Because this labour is not measurable in the same way that it is in centres, we chose a “per space” amount. In the low estimate, we have assumed a per-space cost of $12,400. 39 39 Yalnizyan and McCuaig, “Investing in Early Learning and Child Care.” This is equivalent to the annual per-space funding in Quebec.
The per-space funding in the high estimate is $21,500. This represents a recent per-space cost in Swedish daycare, 40 40 S. Garvis, “Quality of Employment in Childcare. Country Report: Sweden.” European Commission, 2018. https://www.epsu.org/sites/default/files/article/files/Country%20report%20Sweden%20childcare.pdf. a country with national daycare that is often cited as an example for Canada to emulate. While this amount may sound high, it is representative of real costs for some home daycares, likely in urban centres. In the fall of 2019, the Child Care Providers Resource Network surveyed home-daycare providers about their projected fees for 2020. The average of these fees was $47 a day for full-time care. Responses ranged from $30 to $90 per day. A rate of $90 per day would be slightly more than $21,500 per year, 41 41 Personal communication with the Child Care Providers Resource Network, April 27, 2021. making this a reasonable per-space annual amount for the high-cost estimate.
Staff Costs in Daycare Centres
Costs in daycare centres consist mainly of staff costs for front-line Early Childhood Educators (ECEs) and assistants, and for supervisors and support staff (administration, cooking, cleaning, and maintenance).
The number of front-line staff required is the population in childcare centres divided by the number of children permitted per centre, multiplied by the number of staff required based on the staff-to-child ratios, which vary by age category. As noted above, the number of spaces required for children aged four and five is reduced by half, on the assumption that they need before- and after-school care only.
The ratios in the low-cost assessment are all drawn from current legal ratios in Quebec. We chose Quebec for the low-cost assessment because this province has the least-expensive ratios in the country, that is, the highest number of children per staff. For infants eighteen months and below in centre-based care, this means one staff for five infants. For children aged nineteen months to four years, this means one staff for eight children. And for children aged four to five years, this means one staff for every ten children. 42 42 Friendly et al., “Early Childhood Education and Care in Canada,” chapter on Quebec, https://childcarecanada.org/sites/default/files/ECEC-Canada-2019-Quebec.pdf.
The ratios of staff to child in centre-based daycare in the high-cost estimate are based on current legal ratios in Ontario with minor variation. While this choice of province is somewhat arbitrary, child-care ratios in Ontario are broadly representative of ratios across the country and therefore realistic for application in a national study. It is possible that the Atlantic provinces may choose to keep their better, and therefore more costly, ratios. Our Ontario-based ratios allow one staff for three infants, zero to eighteen months. For toddlers aged nineteen months to thirty months, the ratio is one staff for four children. For toddlers aged thirty-one to thirty-six months, the ratio is one staff for five children, and for children aged thirty-seven months to six years, the ratio is one staff for eight children. 43 43 Government of Ontario, “Child Care Rules in Ontario.” https://www.ontario.ca/page/child-care-rules-child-care-and-early-years-act.
Staff Compensation in Daycare Centres
For the salary for front-line workers in the base year we have used the median annual employment income for ECEs and assistants (full-time, full-year) by province, using a special run of 2016 Census data. 44 44 Friendly et al., “Early Childhood Education and Care in Canada.” These incomes were scaled up to match the median salary for child-care workers reported in the federal budget.
Front-line worker salaries are assumed to grow to be more competitive with the average salary of a teacher with ten years’ experience (by province). 45 45 Statistics Canada, “Education Indicators in Canada: An International Perspective,” (December 14, 2020), https://www150.statcan.gc.ca/n1/en/pub/81-604-x/81-604-x2020001-eng.pdf?st=zWR_W9or.
Payments for benefits, pension, and employer contributions to EI and CPP are added to salaries, to arrive at total compensation estimates. Enhanced CPP/QPP contributions are not estimated. Benefits are assumed at 10 percent of salary, using data from the Conference Board. 46 46 M. Haberl and M. Stewart, “Benefits Benchmarking 2019 Identifies New Trends,” Conference Board of Canada (February 28, 2019), https://www.conferenceboard.ca/press/newsrelease/2019/03/11/benefits-benchmarking-2019-identifies-new-trends. This is a conservative assumption, since the 10 percent average is of payroll, not just salary. Pension costs are assumed at 13.1 percent of salary, based on “direct government expenditures on contributions to public school board teachers’ pension funds” in Ontario 47 47 Statistics Canada, Table 37-10-0066-01, “Public and Private Elementary and Secondary Education Expenditures (x 1,000), https://www150.statcan.gc.ca/t1/tbl1/en/tv.action?pid=3710006601. and the number of full-time equivalent (FTE) teachers and FTE long-term occasional teachers in Ontario, 48 48 Government of Ontario, Ministry of Education, “Education Facts, 2019–2020 (Preliminary),” http://www.edu.gov.on.ca/eng/educationFacts.html. relative to Ontario teachers’ salary after ten years of experience.
Total compensation costs for daycare centres also include values for supervisors and support staff. These are calculated in essentially the same way as costs for ECEs and assistants, in that we add benefits, pensions, and employer EI and CPP/QPP contributions to the salary paid directly to employees. Supervisors’ salaries are set at 20 percent above the front-line salary, so are also affected by convergence to teacher salaries. We assume one supervisor for every 17.2 front-line workers, based on the ratio of administrators to teachers in Ontario. 49 49 Government of Ontario, Ministry of Education, “Education Facts.”
Support-staff salaries are assumed as the median school administrative-assistant salary 50 50 Talent.com, “School Administrative Assistant Average Salary in Canada 2021,” https://ca.talent.com/salary?job=school+administrative+assistant. in the base year and then grow by the 1 percent salary adjustment, with no convergence adjustment. We assume one support worker (administrative, cook, maintenance) for every fifteen front-line staff.
ECE Staff and Supervisors: Attraction and Retention
The only difference between the high and low estimates here is the level of salary growth that ECEs experience. If national daycare is fully enacted, there will remain challenges with Early Childhood Educator attraction and retention. In fact, the challenge is likely to grow, because education requirements for ECEs under a national system are likely to rise, given that qualified educators are a mainstay of higher-quality system requirements. Once these requirements for ECEs increases, candidates for such work may decide it’s worth doing a bit more education to become a kindergarten teacher instead, because they can earn more in that role. We assume that to combat losing potential ECEs to other fields, there will be an effort to unionize ECEs and increase their pay to come closer to that of pre-school and kindergarten teachers. One must also keep in mind that influential advocates for national daycare call for child care to be placed within ministries of education, as extensions of the public-school system, which suggests that salaries will move closer toward those of primary-school or kindergarten teachers. 51 51 Charles Pascal, educator and author, is one who is calling for child care to flow out of public education systems. Inresponse to Budget 2021, he wrote, “Childcare needs to be positioned as an extension of publicly funded education under the auspice of a single provincial ministry.” See C. Pascal, “National Childcare Program? Unequivocally Maybe!,” Leading & Learning Together, https://www.charlespascal.com/blog/a-national-childcare-programunequivocallyy-maybe.
Our high-cost estimate assumes ECE salaries converge from the starting point based on the existing ECE to teacher salary to one that adds twenty percentage points to the ratio. For example, in Ontario the ratio starts at 41.5 percent and grows to 61.5 percent. A recent assessment of how to compensate ECEs suggests convergence to two thirds of a teacher salary. 52 52 Yalnizyan and McCuaig, “Investing in Early Learning and Child Care.” Our high-cost estimates produce ratios below this level in each province except Quebec. Quebec moves from 62.2 to 82.2 because teacher salaries are well below the national average while ECE salaries are slightly above average.
For the low-cost estimate, we assume that average ECE salaries will grow from the same starting ratio but end up 10 percentage points higher, rather than 20 points.
While this assumption can be debated, and certainly the time frame in which it occurs may be longer than five years, the fact remains that attracting and retaining ECEs in the new system will be a significant challenge. ECE salaries will rise, by design—Budget 2021 notes that over 95 percent of child-care workers are women and that many are making low wages, with a median of $19.20 per hour. 53 53 Government of Canada, “Budget 2021.” The budget also states that the federal government will work to ensure that ECEs are central to the system being developed, that their work will be valued, and that they will receive training and development opportunities.
There will certainly be pressure to raise ECE salaries to compete with other early-primary teachers—the open debate is only about how much, and whether kindergarten and primary-school teacher salaries will also rise in turn. This is another area of provincial funding responsibility.
Non-Standard Hours and Special-Needs Children
One estimate suggests that 25 percent of Canadians work “non-standard” hours, 54 54 S. Halfon and M. Friendly, “Work Around the Clock: A Snapshot of Non-standard Hours Child Care in Canada, Occasional paper No. 29.” Childcare Resource and Research Unit (September 2015), https://childcarecanada.org/sites/default/files/Occasional%20paper%20No.29%20%5BRevised,%20Sept%2016%29.pdf. and we might argue that for mothers who lost their jobs during the pandemic this percentage is even higher, given the disproportionate job losses in retail, personal care, restaurants, and tourism. We have chosen to incorporate costs associated with non-standard hours and special-needs children by including a multiplier to front-line labour costs in centres, as labour is by far the largest cost driver and the one most affected by making arrangements for nonstandard hours and special-needs children.
Covering nonstandard hours increases costs by requiring more employees to cover swing shifts and night shifts than are needed for a standard-hours centre with an equivalent number of spaces. Each employee comes with fixed costs. Qualified employees are also likely to demand and to receive higher pay to work these hours. Although we don’t alter our existing estimates, operating on nonstandard hours will also increase utility and maintenance costs. Such hours will also be likely to increase capital costs if centres with overnight care require space for beds.
Manitoba gives one-and-a-half times funding to child-care programs with nonstandard hours, and Saskatchewan gives nonstandard programs 25–50 percent more funding per space. 55 55 Halfon and Friendly, “Work Around the Clock.” A 2012 survey of Ontario child-care centres suggested that about 10 percent of centres operate before 7:00 a.m. or after 6:00 p.m. 56 56 Halfon and Friendly, “Work Around the Clock,” 5. Although not mentioned in Budget 2021, the Liberals have articulated a preference for at least 10 percent of spaces to cover extended hours. 57 57 Liberal Party of Canada, “More Accessible and Affordable Child Care: Our Platform,” https://liberal.ca/our-platform/more-accessible-and-affordable-child-care/.
For our low-cost estimate, we assume that 10 percent of daycare centres will operate with nonstandard hours, to replicate the current situation in Ontario. We also assume that an additional 2 percent of centres will operate for 24 hours a day. For our high-cost estimate we assume that 25 percent of daycare centres will operate with nonstandard hours, and that an additional 5 percent of centres will operate for 24 hours a day.
Quebec gives significant extra grants to centres for children with special needs, and Ontario requires that 4 percent of funding goes to special-needs resourcing. 58 58 Friendly et al., “Early Childhood Education and Care in Canada,” 79. We added in supplemental staff for children with special needs. Just under 2 percent of children in regulated childcare in Quebec have special needs, so we assume one supplemental worker per one hundred children in our low-cost estimate and four supplemental workers per one hundred children our high-cost estimate.
Capital Costs
Meeting the child-care needs of about 70 percent of the population aged one to five years, plus infants, will require about 840,000 additional spaces beyond the approximately 685,000 licensed spaces already in existence. 59 59 Stanford, “Child Care Expansion Would Boost Economic Recovery, Study Finds,” 15. This works out to about 167,000 spaces per year in each of the five years of the rollout.
High-cost estimates are based on one hundred square feet per child and construction costs of $400 per square foot. 60 60 Stanford, via Government of British Columbia, “Childcare BC New Spaces Fund: Funding Guidelines 2021/21,” https://www2.gov.bc.ca/assets/gov/family-and-social-supports/child-care/running-a-daycare-or-preschool/newspaces_fund_guide.pdf. One hundred square feet per child is defended as “a cautious benchmark, based on analysis of regulatory requirements in various jurisdictions regarding minimum program space for child care provision, supplemented by other space needed for administration, support services, and general building features.” 61 61 Stanford, “Child Care Expansion Would Boost Economic Recovery, Study Finds.”
Thus our low-cost estimate is likely too conservative, based on fifty-four square feet per space and construction costs of $250 per square foot. 62 62 Stanford, “Child Care Expansion Would Boost Economic Recovery, Study Finds.” The fifty-four square feet is an average of space requirements for different age groups, based on quality requirements from the European Commission Childcare Network. 63 63 J. Beach and M. Friendly, “Child Care Centre Physical Environments,” Childcare Resource and Research Unit, http://www.childcarequality.ca/wdocs/QbD_PhysicalEnvironments.pdf.

Questions for Parents and Provinces
Child care is not only about financial costs, a fact all too often lost in assessments such as this one. Given this reality, in this section we raise issues relating to the complexity of doing a system like this right, because the well-being of Canadian children and families is on the line.
Complexity
What will happen to the existing ecosystem of care when the federal government subsidizes some spaces and not others? With the advent of national daycare, one may assume that the number of home daycares will diminish, given that proponents of national daycare generally favour the Quebec model of the Centre de la Petite Enfance (CPE), or centre-based spaces. However, the result in Quebec was the opposite. Economist Pierre Fortin describes how “non-subsidized (but regulated)” daycares “crumbled,” and then bounced back and rose to new heights, due to a tax break beginning in 2009 for parents who couldn’t get the subsidized care from the Quebec government. 64 64 Fortin, Godbout, and St-Cerny, “Impact of Quebec’s Universal Low-Fee Childcare Program on Female Labour Force Participation, Domestic Income, and Government Budgets.” A look at the development of spaces in the Quebec system, as itemized by the government, demonstrates slow growth of the higher-quality CPEs, in contrast with the fast growth of private care after 2009. 65 65 Government of Quebec, Ministère de la famille, “Places existantes et en cours de réalisation dans les services de garde éducatifs à l’enfance reconnus,” https://www.mfa.gouv.qc.ca/fr/services-de-garde/portrait/places/Pages/index.aspx.
We have mused about possible distortions to the existing ecosystem of care in a recent article. As we say there, “Lowering the cost in one segment of the sector will push those already in the paid workforce but using unregulated care to seek out the cheaper, publicly subsidized care. Driving up demand by slashing prices for one type of care will likely result in supply issues, including long wait lists. It could also lead to job losses, as unregulated providers, like the neighbour down the street offering care for a handful of neighbourhood children, will not be able to compete.” 66 66 P.J. Mitchell and A. Mrozek, “Mitchell and Mrozek: A National Daycare System Is Simply a Bad Idea,” The Hub (blog), April 21, 2021, https://thehub.ca/2021-04-21/mitchel-and-mrozek-a-national-daycare-system-is-simply-a-bad-idea/.
If the rollout of the subsidized spaces is done by age, this might mean subsidizing care for pre-schoolers before toddlers, and toddlers before infants. In one Canadian report, this is referred to as “educating down.” 67 67 “There should be no barriers to P/Ts using federal funds to expand access to ELCC by ‘educating down,’ i.e., expanding high-quality access through public-school systems to kindergarten-aged children, and progressively younger.” A. Yalnizyan and K. McCuaig, “A Year-By-Year Approach to Investing in Early Learning and Child Care,” Atkinson Foundation (October 20, 2020), https://atkinsonfoundation.ca/atkinson-fellows/posts/a-year-by-year-approach-to-investing-in-early-learning-and-child-care/. In this case, other jurisdictions have experienced another unintended consequence of the government intervention: actually greater costs to parents for children in the lower age groups, or loss of care in the younger age ranges altogether. 68 68 S. Workman and S. Jessen-Howard, “Understanding the True Cost of Child Care for Infants and Toddlers,” Center for American Progress (November 15, 2018), https://www.americanprogress.org/issues/early-childhood/reports/2018/11/15/460970/understanding-true-cost-child-care-infants-toddlers/.
Early personal responses that we have received to the Budget 2021 announcement of a national system include private providers describing their alienation from the industry and planned exit strategies from child-care provision in the next three to five years, in part because they believe they will be pushed out anyway. 69 69 Personal email correspondence with Michaela Haney of Lil Gardeners Daycare, Kamloops, British Columbia, April 23, 2021. These stories point to a destabilization of the industry, albeit on an anecdotal level. This outcome is unpredictable, and any assumption about the future of care should recognize this.
This is, of course, but one aspect of the complexity embedded in child care. Each costing number in this report represents myriad assumptions about cost, quality, type of daycare, staffing numbers, staffing education requirements, and more. If a national daycare system is adopted, all of these assumptions will need to be considered at a federal level for application by the provinces, in communities ranging from Burnaby, British Columbia, to Corner Brook, Newfoundland.
Quality
In no small part, costs of daycare hinge on the ratio of staff to children. This is also one of the more easily measured indicators of quality. Thus, it is worth noting that the only province currently with a provincial system, Quebec, has the worst ratios in Canada. These poor ratios directly affect the quality of care for children: “The research has clearly shown that non-parental care is not harmful when it is provided by people who are warm and responsive to the child, have some understanding of child development, and are not responsible for too many children. In fact, child care may be beneficial, especially in the area of social and language skill development. However, the research is equally clear that non-parental child care has the potential to harm children, even those from middle-class homes. Children’s development can be stunted when child care has one or more of the following characteristics: a caregiver who is neglectful or harsh, caregivers who are unable to provide individualized attention because they are responsible for too many children, and/or situations where the children lack adequate stimulation.” 70 70 Cleveland and Krashinsky, “The Benefits and Costs of Good Child Care.” Emphasis added.
Psychologists Howes, Phillips, and Whitebook have examined the question of how many children are too many: “When five or more children were cared for by one adult in infant classrooms and nine children in toddler and preschool classrooms, at least 50% of the children were in classrooms rated as inadequate in caregiving. . . . Children in infant classrooms with 1:3 or less ratios, toddler classrooms with 1:4 or less ratios, and pre-school classrooms with 1:9 or less were more likely than children in classrooms with worse (higher) ratios to experience both caregiving and activities rated as good or very good.” 71 71 C. Howes, D.A. Phillips, and M. Whitebook, “Thresholds of Quality: Implications for the Social Development of Children in Center-Based Child Care,” Child Development 63, no. 2 (1992): 449–60, https://doi.org/10.2307/1131491.
What this research points to is that smaller group sizes enable better caregiving, and even the addition of one child into a group above the recommended group size can diminish quality. There are, of course, other factors that contribute to quality, including quantity of time in care. 72 72 Government of Canada, Employment and Social Development Canada, “Defining and Measuring the Quality of Early Learning and Child Care: A Literature Review,” June 27, 2019, https://www.canada.ca/en/employment-social-development/programs/early-learning-child-care/reports/2019-defining-measuring-quality.html; Belsky et al., The Origins of You.
While our low-cost estimate can rightly be viewed as delivering poor staff-child ratios, the high-cost estimate is not a commentary on ideal staff-child ratios. Ontario ratios are indeed better than those found in Quebec, but these ought not to be taken as an indicator of high quality per se. Rather, these are practical ratios to use within the context of existing Canadian regulation.
In debates over quality, it is important to note that quality of care in the home environment has never been measured, as was noted earlier in this report quoting the preeminent economist in this subject, James Heckman. 73 73 A. Mrozek, “Nobel Laureate James Heckman.” The question, particularly for parents, is whether a universal system engenders poorer quality, as government funding is either too slow or too static to address the influx of children in real time. For example, Ontario’s universal full-day kindergarten program has one staff for thirteen kids, a ratio far higher than what is legally allowable in the child-care sector in Ontario or other provinces. 74 74 Government of Ontario, “Child Care Rules in Ontario.”
Finally, in a national system that funds spaces instead of children, the per-space amount is just that: money for a space, whether a child is occupying it or not. Given that some spaces in centres are known to sit empty, 75 75 A. Mrozek and H. Ward, “Daycare Vacancy Rates in British Columbia: The Untold Story,” Cardus (December 4, 2017), https://www.cardus.ca/research/family/articles/daycare-vacancy-rates-in-british-columbia-the-untold-story/; A. Mrozek, “Toronto’s Increasing Daycare Surplus,” Cardus (April 25, 2017), https://www.cardus.ca/research/family/articles/torontos-increasing-daycare-surplus/. this cannot be called a per-child amount in the same way that money flows to children in the Canada Child Benefit, for example.
Conclusion
The federal government has cast its vision in Budget 2021, but has given little detail yet about how it national daycare will be operationalized. The research we present in this report is one effort to concretize the proposal. A low price tag for national daycare will correlate with constrained access, or poor quality, or both.
Our modeling suggests that national daycare will cost more than the federal government has budgeted and more than provinces (perhaps) realize. It is realistic to think that the provinces will be left on the hook to supply the bulk of the missing funding. Provincial governments looking to pursue an efficient and effective response to families’ child-care needs should be equipped with a solid understanding of the ongoing financial costs they will face, particularly beyond the five-year funding period that the federal government has delineated. When the political announcements are over and the hard work sets in, who will pay for this program? Our model calculates the provincial share of daycare funding as the difference between the federal and parent contribution and our cost estimates. The federal government has promised a fifty-fifty cost sharing, though we have prior examples of the provinces taking up more than half of the costs of other federal-provincial cost sharing programs, such as health care. 76 76 J. Ibbitson, “Provincial Governments Should Be Wary of Liberals’ Cost-Shared Child Care Pledge.” How the provinces will handle funding shortfalls is unknown. There is a significant risk of uneven distribution of care that is mediocre or low quality.

Were the government to switch course and deliver money to parents to assist with child care costs, our low estimate indicates that every child aged six and under could receive $5,626 annually. In our high estimate, by year five every child aged six and under could receive $13,667 annually. The federal government’s payments alone of $9.2 billion would amount to $3,869 for every child aged six and under. Low-income families could receive substantially more than these amounts, if payments were delivered via a means-tested mechanism. These amounts would provide substantive assistance, no matter where that child care occurs or who delivers it.
National daycare needs a rethink on the part of both the federal and provincial governments. There are obvious fiscal consequences to the plan, and also unintended consequences and opportunity costs that have received scant attention. Addressing these issues concretely is imperative before embarking on the path of national daycare.
Questions about the myriad complexities of national daycare abound, from where to put new spaces, to how to attract and retain the numbers of staff required, to the degree of quality in a massive, country-wide system. The norms of modern work, particularly that of modern working mothers, will be poorly addressed by a nation-wide system, rooted as it is in proposals that were first advanced in the 1970s. The billions of dollars spent to create this system of care would be better placed in the pockets of Canadian families, to meet their child-care needs in whatever ways are optimal for their child and their family situation, not only for their labour-force participation but also for the myriad of other reasons that make our lives meaningful. This is the way to build a stronger and more prosperous Canada.
References
Baker, M., J. Gruber, and K. Milligan. “The Long-Run Impacts of a Universal Child Care Program.” American Economic Journal: Economic Policy 11, no. 3 (August 2019): 1–26. https://doi.org/10.1257/pol.20170603.
———. “Universal Child Care, Maternal Labor Supply, and Family Well‐Being.” Journal of Political Economy 116, no. 4 (August 2008): 709–45. https://doi.org/10.1086/591908.
Baril, R., P. Lefebvre, and P. Merrigan. “Quebec Family Policy: Impact and Options.” IRPP, January 2000. https://irpp.org/research-studies/quebec-family-policy-impact-and-options/.
Beach, J., and M. Friendly. “Child Care Centre Physical Environments,” Childcare Resource and Research Unit. http://www.childcarequality.ca/wdocs/QbD_PhysicalEnvironments.pdf.
Belsky, J., A. Caspi, T.E. Moffitt, and R. Poulton. The Origins of You: How Childhood Shapes Later Life. Cambridge, MA: Harvard University Press, 2020.
Cleveland, G., and M. Krashinsky. “The Benefits and Costs of Good Child Care: The Economic Rationale for Public Investment in Young Children,” University of Toronto, 1998. https://childcarecanada.org/sites/default/files/bc.pdf.
Fortin, P., L. Godbout, and S. St-Cerny. “Impact of Quebec’s Universal Low-Fee Childcare Program on Female Labour Force Participation, Domestic Income, and Government Budgets.” Université de Sherbrooke, May 2012. https://www.oise.utoronto.ca/atkinson/UserFiles/File/News/Fortin-Godbout-St_Cerny_eng.pdf.
Fraser Mustard, J. “Early Human Development–Equity from the Start–Latin America.” Revista Latinoamericana de Ciencias Sociales, Niñez y Juventud 7, no. 2 (July 2009): 639–80.
Friendly, M., et al. “Early Childhood Education and Care in Canada 2019,” Childcare Resource and Research Unit. https://childcarecanada.org/sites/default/files/ECEC-Canada-2019-full-publication-REV-12-2-21.pdf.
Garvis, S., “Quality of Employment in Childcare. Country Report: Sweden.” European Commission, 2018. https://www.epsu.org/sites/default/files/article/files/Country%20report%20Sweden%20childcare.pdf.
Government of British Columbia.“Childcare BC New Spaces Fund: Funding Guidelines 2021/21.” https://www2.gov.bc.ca/assets/gov/family-and-social-supports/child-care/running-a-daycare-or-preschool/newspaces_fund_guide.pdf.
Government of Canada, Department of Finance. “Budget 2021,” April 19, 2021. https://www.budget.gc.ca/2021/home-accueil-en.html.
———, Employment and Social Development. “Defining and Measuring the Quality of Early Learning and Child Care: A Literature Review,” June 27, 2019. https://www.canada.ca/en/employment-social-development/programs/early-learning-child-care/reports/2019-defining-measuring-quality.html.
Government of Manitoba. “A Guide to Child Care in Manitoba.” https://www.gov.mb.ca/fs/childcare/families/guide_childcare/index.html.
Government of Ontario. “Child Care Rules in Ontario.” https://www.ontario.ca/page/child-care-rules-child-care-and-early-years-act.
Government of Ontario, Ministry of Education. “Education Facts, 2019–2020 (Preliminary).” http://www.edu.gov.on.ca/eng/educationFacts.html.
Government of Quebec, Ministère de la Famille. “Places existantes et en cours de réalisation dans les services de garde éducatifs à l’enfance reconnus.” https://www.mfa.gouv.qc.ca/fr/services-de-garde/portrait/places/Pages/index.aspx.
Government of Saskatchewan. “How Child Care Works in Saskatchewan.” https://www.saskatchewan.ca/residents/family-and-social-support/child-care/how-child-care-works.
Haberl, M., and N. Stewart. “Benefits Benchmarking 2019 Identifies New Trends.” Conference Board of Canada, February 28, 2019. https://www.conferenceboard.ca/press/newsrelease/2019/03/11/benefits-benchmarking-2019-identifies-new-trends.
Halfon, S. and M. Friendly. “Work Around the Clock: A Snapshot of Non-standard Hours Child Care in Canada, Occasional paper No. 29.” Childcare Resource and Research Unit, September 2015. https://childcarecanada.org/sites/default/files/Occasional%20paper%20No.29%20%5BRevised,%20Sept%2016%29.pdf.
Howes, C., D.A. Phillips, and M. Whitebook. “Thresholds of Quality: Implications for the Social Development of Children in Center-Based Child Care.” Child Development 63, no. 2 (1992): 449–60. https://doi.org/10.2307/1131491.
Ibbitson, J. “Provincial Governments Should Be Wary of Liberals’ Cost-Shared Child Care Pledge.” Globe and Mail, April 27, 2021. https://www.theglobeandmail.com/politics/article-provincial-governments-should-be-wary-of-liberals-cost-shared-child/.
Kottelenberg, M.J., and S.F. Lehrer. “Do the Perils of Universal Childcare Depend on the Child’s Age?” CESifo Economic Studies 60, no. 2 (June 1, 2014): 338–65. https://doi.org/10.1093/cesifo/ifu006.
———. “Does Quebec’s Subsidized Child Care Policy Give Boys and Girls an Equal Start?” Canadian Journal of Economics / Revue Canadienne d’économique 51, no. 2 (2018): 627–59. https://doi.org/10.1111/caje.12333.
———. “New Evidence on the Impacts of Access to and Attending Universal Childcare in Canada.” Working Paper. National Bureau of Economic Research, February 2013. https://doi.org/10.3386/w18785.
———. “New Evidence on the Impacts of Access to and Attending Universal Child-Care in Canada.” Canadian Public Policy 39, no. 2 (2013): 263–86. https://ideas.repec.org/a/cpp/issued/v39y2013i2p263-286.html.
Liberal Party of Canada. “More Accessible and Affordable Child Care: Our Platform.” https://liberal.ca/our-platform/more-accessible-and-affordable-child-care/.
Mitchell, P.J., and A. Mrozek. “Mitchell and Mrozek: A National Daycare System Is Simply a Bad Idea.” The Hub (blog), April 21, 2021. https://thehub.ca/2021-04-21/mitchel-and-mrozek-a-national-daycare-system-is-simply-a-bad-idea/.
Mrozek, A. “Nobel Laureate James Heckman: ‘The Family Is the Whole Story.’” Institute for Family Studies, March 15, 2021. https://ifstudies.org/blog/nobel-laureate-james-heckman-the-family-is-the-whole-story-.
———. “Toronto’s Increasing Daycare Surplus,” Cardus, April 25, 2017. https://www.cardus.ca/research/family/articles/torontos-increasing-daycare-surplus/.
Mrozek, A., and H. Ward. “Daycare Vacancy Rates in British Columbia: The Untold Story.” Cardus, December 4, 2017. https://www.cardus.ca/research/family/articles/daycare-vacancy-rates-in-british-columbia-the-untold-story/.
Munday, A., and J. Weisz. “Opinion: $10-a-Day Child Care Needs to Serve All Working Parents.” Globe and Mail, April 20, 2021. https://www.theglobeandmail.com/business/commentary/article-10-a-day-child-care-needs-to-serve-all-working-parents/.
OECD Stat. “Teachers’ Actual Salaries.” https://stats.oecd.org/Index.aspx?DataSetCode=EAG_TS_ACT.
Pascal, C. “National Childcare Program? Unequivocally Maybe!” Leading & Learning Together. https://www.charlespascal.com/blog/a-national-childcare-programunequivocallyy-maybe.
Pearce, T. “Daycare Linked to Obesity Risk in Kids, Quebec Study Finds.” Globe and Mail, November 19, 2012. https://www.theglobeandmail.com/life/the-hot-button/daycare-linked-to-obesity-risk-in-kids-quebec-study-finds/article5428334/.
RBC Economics. “Vaccine Progress Brightens Outlook for Provincial Economies.” March 21, 2021, http://www.rbc.com/economics/economic-reports/provincial-economic-forecasts.html.
Roth, G. “Ginny Roth: Massive-Spending Liberal Budget Cynically Ignores Health-Care Transfers.” National Post, April 23, 2021. https://nationalpost.com/opinion/ginny-roth-massive-spending-liberal-budget-cynically-ignores-health-care-transfers.
Stanford, J. “Child Care Expansion Would Boost Economic Recovery, Study Finds.” Centre for Future Work, November 25, 2020. https://centreforfuturework.ca/2020/11/25/child-care-expansion-would-boost-economic-recovery-study-finds/.
Statistics Canada. The Daily: Survey on Early Learning and Child Care Arrangements, 2019, April 10, 2019. https://www150.statcan.gc.ca/n1/en/daily-quotidien/190410/dq190410a-eng.pdf?st=72O7JQee.
———. “Education Indicators in Canada: An International Perspective,” (December 14, 2020). https://www150.statcan.gc.ca/n1/en/pub/81-604-x/81-604-x2020001-eng.pdf?st=zWR_W9or.
———. Table 17-10-0005-01 Population estimates on July 1st, by age and sex. https://www150.statcan.gc.ca/t1/tbl1/en/tv.action?pid=1710000501.
———. Table 17-10-0057-01 Projected population, by projection scenario, age and sex, as of July 1 (x 1,000). https://www150.statcan.gc.ca/t1/tbl1/en/tv.action?pid=1710005701.
———. Table 18-10-0004-13 Consumer Price Index by product group, monthly, percentage change, not seasonally adjusted, Canada, provinces, Whitehorse, Yellowknife and Iqaluit, https://www150.statcan.gc.ca/t1/tbl1/en/tv.action?pid=1810000413.
———. Table 37-10-0066-01, “Public and Private Elementary and Secondary Education Expenditures (x 1,000). https://www150.statcan.gc.ca/t1/tbl1/en/tv.action?pid=3710006601.
———. Table 42-10-0005-01, “Type of Child Care Arrangement, Household Population Aged 0 to 5 Years,” April 9, 2021. https://www150.statcan.gc.ca/t1/tbl1/en/tv.action?pid=4210000501.
Talent.com. “School Administrative Assistant Average Salary in Canada 2021.” https://ca.talent.com/salary?job=school+administrative+assistant.
Task Force on Child Care. “Report of the Task Force on Child Care.” Status of Women Canada, 1986. https://childcarecanada.org/sites/default/files/CHILD%20CARE.pdf.
Walberg, R., and A. Mrozek. “The Cost of a Free Lunch.” Cardus (blog), November 25, 2009. https://www.cardus.ca/research/family/articles/the-cost-of-a-free-lunch/.
Workman, S., and S. Jessen-Howard. “Understanding the True Cost of Child Care for Infants and Toddlers.” Center for American Progress, November 15, 2018. https://www.americanprogress.org/issues/early-childhood/reports/2018/11/15/460970/understanding-true-cost-child-care-infants-toddlers/.
Yalnizyan, A., and K. McCuaig. “Investing in Early Learning and Child Care: A Framework for Federal Financing.” Atkinson Foundation, September 16, 2020. https://atkinsonfoundation.ca/atkinson-fellows/posts/investing-in-early-learning-and-child-care/.
———. “A Year-By-Year Approach to Investing in Early Learning and Child Care.” Atkinson Foundation, October 20, 2020. https://atkinsonfoundation.ca/atkinson-fellows/posts/a-year-by-year-approach-to-investing-in-early-learning-and-child-care/.