Table of Contents
Table of Contents
Executive Summary
Rarely has more been made of the contribution of Canada’s working class to the economy and society than in the last two years. The early days of the COVID-19 pandemic brought about a more robust public policy debate than Canada has typically seen about the working conditions of, for example, those employed in the retail sector, personal support workers in long-term-care homes, and truck drivers and delivery people.
The pandemic has accelerated a polarization of jobs that has become a structural trend in the Canadian economy. Previous Cardus research has shown that this polarization of the labour market between low- and high-skilled occupations, with a declining share of jobs available for mid-skilled workers, has led to an “hourglass economy.” Yet, even while the share of the labour force employed in professional occupations rises, the working class retains the largest share of workers in the Canadian economy, making them an important political economy constituency.
But who is the working class in Canada? This paper seeks to answer this question by proposing a modern taxonomy of the workforce and a picture of working class that draws on a rich body of demographic, economic, and labour-market data.
A key insight is that the stereotypical image of a male, blue-collar worker in the goods-producing sector is no longer an accurate representation of Canada’s working class, if it ever was. Our findings in fact show that a working-class Canadian is as likely to be a female, recently immigrated worker in the services-producing sector. The new working class, in other words, is now more personified by a Walmart cashier or an Amazon delivery driver than a General Motors factory worker or a Domtar mill hand. Those who constitute it have shifted from “making stuff” to “serving and caring for people.”
We also compare data to examine the wages and salaries earned by the working class and compare them to wages and salaries earned by those in other occupations, as well as between men and women in the working class. As one would expect, there are important differences in earning power between these groups.
These demographic revelations have important implications for any public-policy agenda that purports to address the interests, concerns, and aspirations of the working class. We propose that any such agenda must be based on a realistic understanding of the new face of the working class. We conclude by proposing the broad outlines of an agenda for this new, modern conception of the working class, including health and dental benefits, child care, housing, public transit, labour standards and regulations, education, and immigration.
Introduction
One of the consequences of the COVID-19 pandemic is that it has generated more public attention to the experiences and circumstances of working-class Canadians. Members of the working class, including grocery store clerks, long-term-care workers, and truck drivers, who were deemed “essential workers,” demonstrated courage and dignity that understandably touched the rest of us. It has in turn contributed to a renewed and healthy debate about the right mix of policies and programs to better support them. This is one of the few positive developments of the otherwise bleak pandemic experience.
The first step, of course, is to understand more about these workers, including their educational backgrounds, work experiences, and economic and social outcomes. We need a new conceptual and empirical taxonomy of the workforce that accurately portrays Canada’s working-class population. That is the purpose of this paper.
Previous research published by Cardus 1 1 S. Speer and B. Dijkema, “Fuelling Canada’s Middle Class: Job Polarization and the Natural Resource Sector,” Cardus, December 2020, https://www.cardus.ca/research/work-economics/reports/fuelling-canadas-middle-class/. and the Public Policy Forum and Future Skills Centre 2 2 S. Speer and S. Bezu, “Job Polarization in Canada,” Public Policy Forum, April 2021. https://ppforum.ca/wp-content/uploads/2021/04/JobPolarizationInCanada-PPF-April2021-EN.pdf. has sought to understand the long-term trend of job polarization in Canada and its implications for different Canadian workers. The key finding of these studies is that Canada’s labour market is increasingly bifurcating along the bottom and top of the skills distribution. We now have something of an “hourglass economy.” 3 3 J. Lake, “Don’t Blame Trade for Killing the Middle-Tier Jobs that We Need,” Bush Center, Fall 2018, https://www.bushcenter.org/catalyst/opportunity-road/lake-job-polarization.html.
Canada, like various peer jurisdictions, is experiencing the economic and social effects of what one of us has described as the “vanishing middle” of our labour market. 4 4 Speer and Dijkema, “Fuelling Canada’s Middle Class.” The egalitarian labour market of the old goods-producing economy, in which most jobs were clustered in and around the middle of the skills distribution, has given way to the labour market of the service-based economy, in which mid-skilled occupations are both shrinking in relative terms and changing in fundamental ways. The service economy itself is bifurcated into low-paid and often low-skilled jobs in personal services, and high-paid and often high-skilled jobs in professional, administrative, and financial services.
Our conception of Canada’s working class has not kept up with these structural trends. As the pandemic has exposed, the modern working class is not mainly composed of male, blue-collar, often unionized workers in goods-producing sectors such as manufacturing or resource development. It is increasingly represented by female workers in service-based jobs such as retail clerks, food-counter attendants, and personal support workers. In fact, the share of the Canadian working class employed in sales and service-sector jobs has increased from just over 30 percent in 1990 to now nearly half.
With Canadian governments rightly turning their attention to the needs of the working class, it is essential that they first understand the circumstances and experiences of those they are trying to target. While “those who shower at the end of the day” 5 5 Tweet from Monte McNaughton (@MonteMcNaughton), Ontario’s minister of labour, immigration, training, and skills development, April 12, 2022, https://twitter.com/montemcnaughton/status/1514009620997541893. remain an important part of the working class, they by no means represent a majority or even a plurality of Canada’s modern working class. As one American scholar has put it, the new working class has shifted from “making stuff” to “serving and caring for people.” 6 6 T. Drault, “Understanding the Working Class,” Demos, April 16, 2018, https://www.demos.org/research/understanding-working-class
A genuine working-class agenda can neither fall victim to these outdated conceptions of the working class nor be selective about which members of the working class it aims to support. It must reflect the full spectrum of working-class Canadians based on where they live and work as well as the diverse set of issues, concerns, and aspirations that animate them.
Put bluntly: a working-class agenda that neglects those immigrants and women working in service-sector jobs is an incomplete political and policy vision. An inclusive and modern working-class politics must account for the world as it is in 2022, which means addressing a broad set of working-class issues including (but not limited to) health and dental benefits, child care, housing, public transit, labour standards and regulations, education, immigration, the dignity of work, and more.
The goal of this paper, then, is twofold: (1) establish a common empirical understanding of Canada’s working class, including data on demographics, educational attainment, and income levels, and (2) set out the early makings of a policy agenda that aims to support Canada’s modern working-class population.
Definitions and Methodology
As described above, this paper aims to better understand the demographic, educational, and occupational characteristics of Canada’s working class. The obvious challenge for this type of taxonomic exercise is to define the working class, which has become something of an elastic political label for which there is no universal definition. 7 7 Drault, “Understanding the Working Class.” It is notable, for instance, that Canada’s former Cabinet minister for middle-class prosperity could similarly not define the “middle class.” 8 8 R. Gilmore, “Middle Class Prosperity Minister Says Canada Can’t Measure Who Is in the Middle Class,” CTV News, January 28, 2020. https://www.ctvnews.ca/politics/middle-class-prosperity-minister-says-canada-can-t-measure-who-is-in-the-middle-class-1.4787051. It speaks to the inherent challenge of defining what has effectively become the combination of a political, sociological, and technical identity.
Through our research, we considered different working-class definitions based on methodological best practices in Canada and elsewhere. A common identifier in the scholarship is educational attainment. “Working class” typically refers to someone who works in a non-management and non-professional job that generally does not require post-secondary education. 9 9 Drault, “Understanding the Working Class.”
This is something of a crude definition. A large number in these occupations have post-secondary credentials—in fact, as we discuss below, the Labour Force Survey data tell us that more than half of those in working-class jobs have educational credentials beyond what is typically needed for their jobs. There are also many people in working-class occupations who are highly proficient in their respective jobs irrespective of the expectations and demands of what British policy writer David Goodhart has described as an “overcredentialized society.” 10 10 The Hub, “Hub Dialogues: David Goodhart on Why University Education Is Not the Only Education that Matters,” October 21, 2021, https://thehub.ca/2021-10-26/hub-dialogue-university-education-is-not-the-only-education/. It is not therefore a judgment on the aptitudes or abilities of anyone in these occupations.
These definitions generally reflect more on economic factors about supply and demand than normative considerations about social value. As Canadian-born, US-based policy scholar Samuel Hammond has explained, any descriptions of so-called “low skilled” or “high skilled” occupations are “always contingent on what skills are in demand, and the substitutability of the skills you are able to supply.” 11 11 Tweet from Samuel Hammond (@hamandcheese), January 5, 2022, https://twitter.com/hamandcheese/status/1478854662002520066.
But notwithstanding these crucial nuances, there is still utility to a definition of the working class for the purposes of carrying out empirical research and informing public-policy analysis. We are relying here on a definition that is commonly used by organizations such as the World Bank and International Monetary Fund. 12 12 Speer and Bezu, “Job Polarization in Canada.”
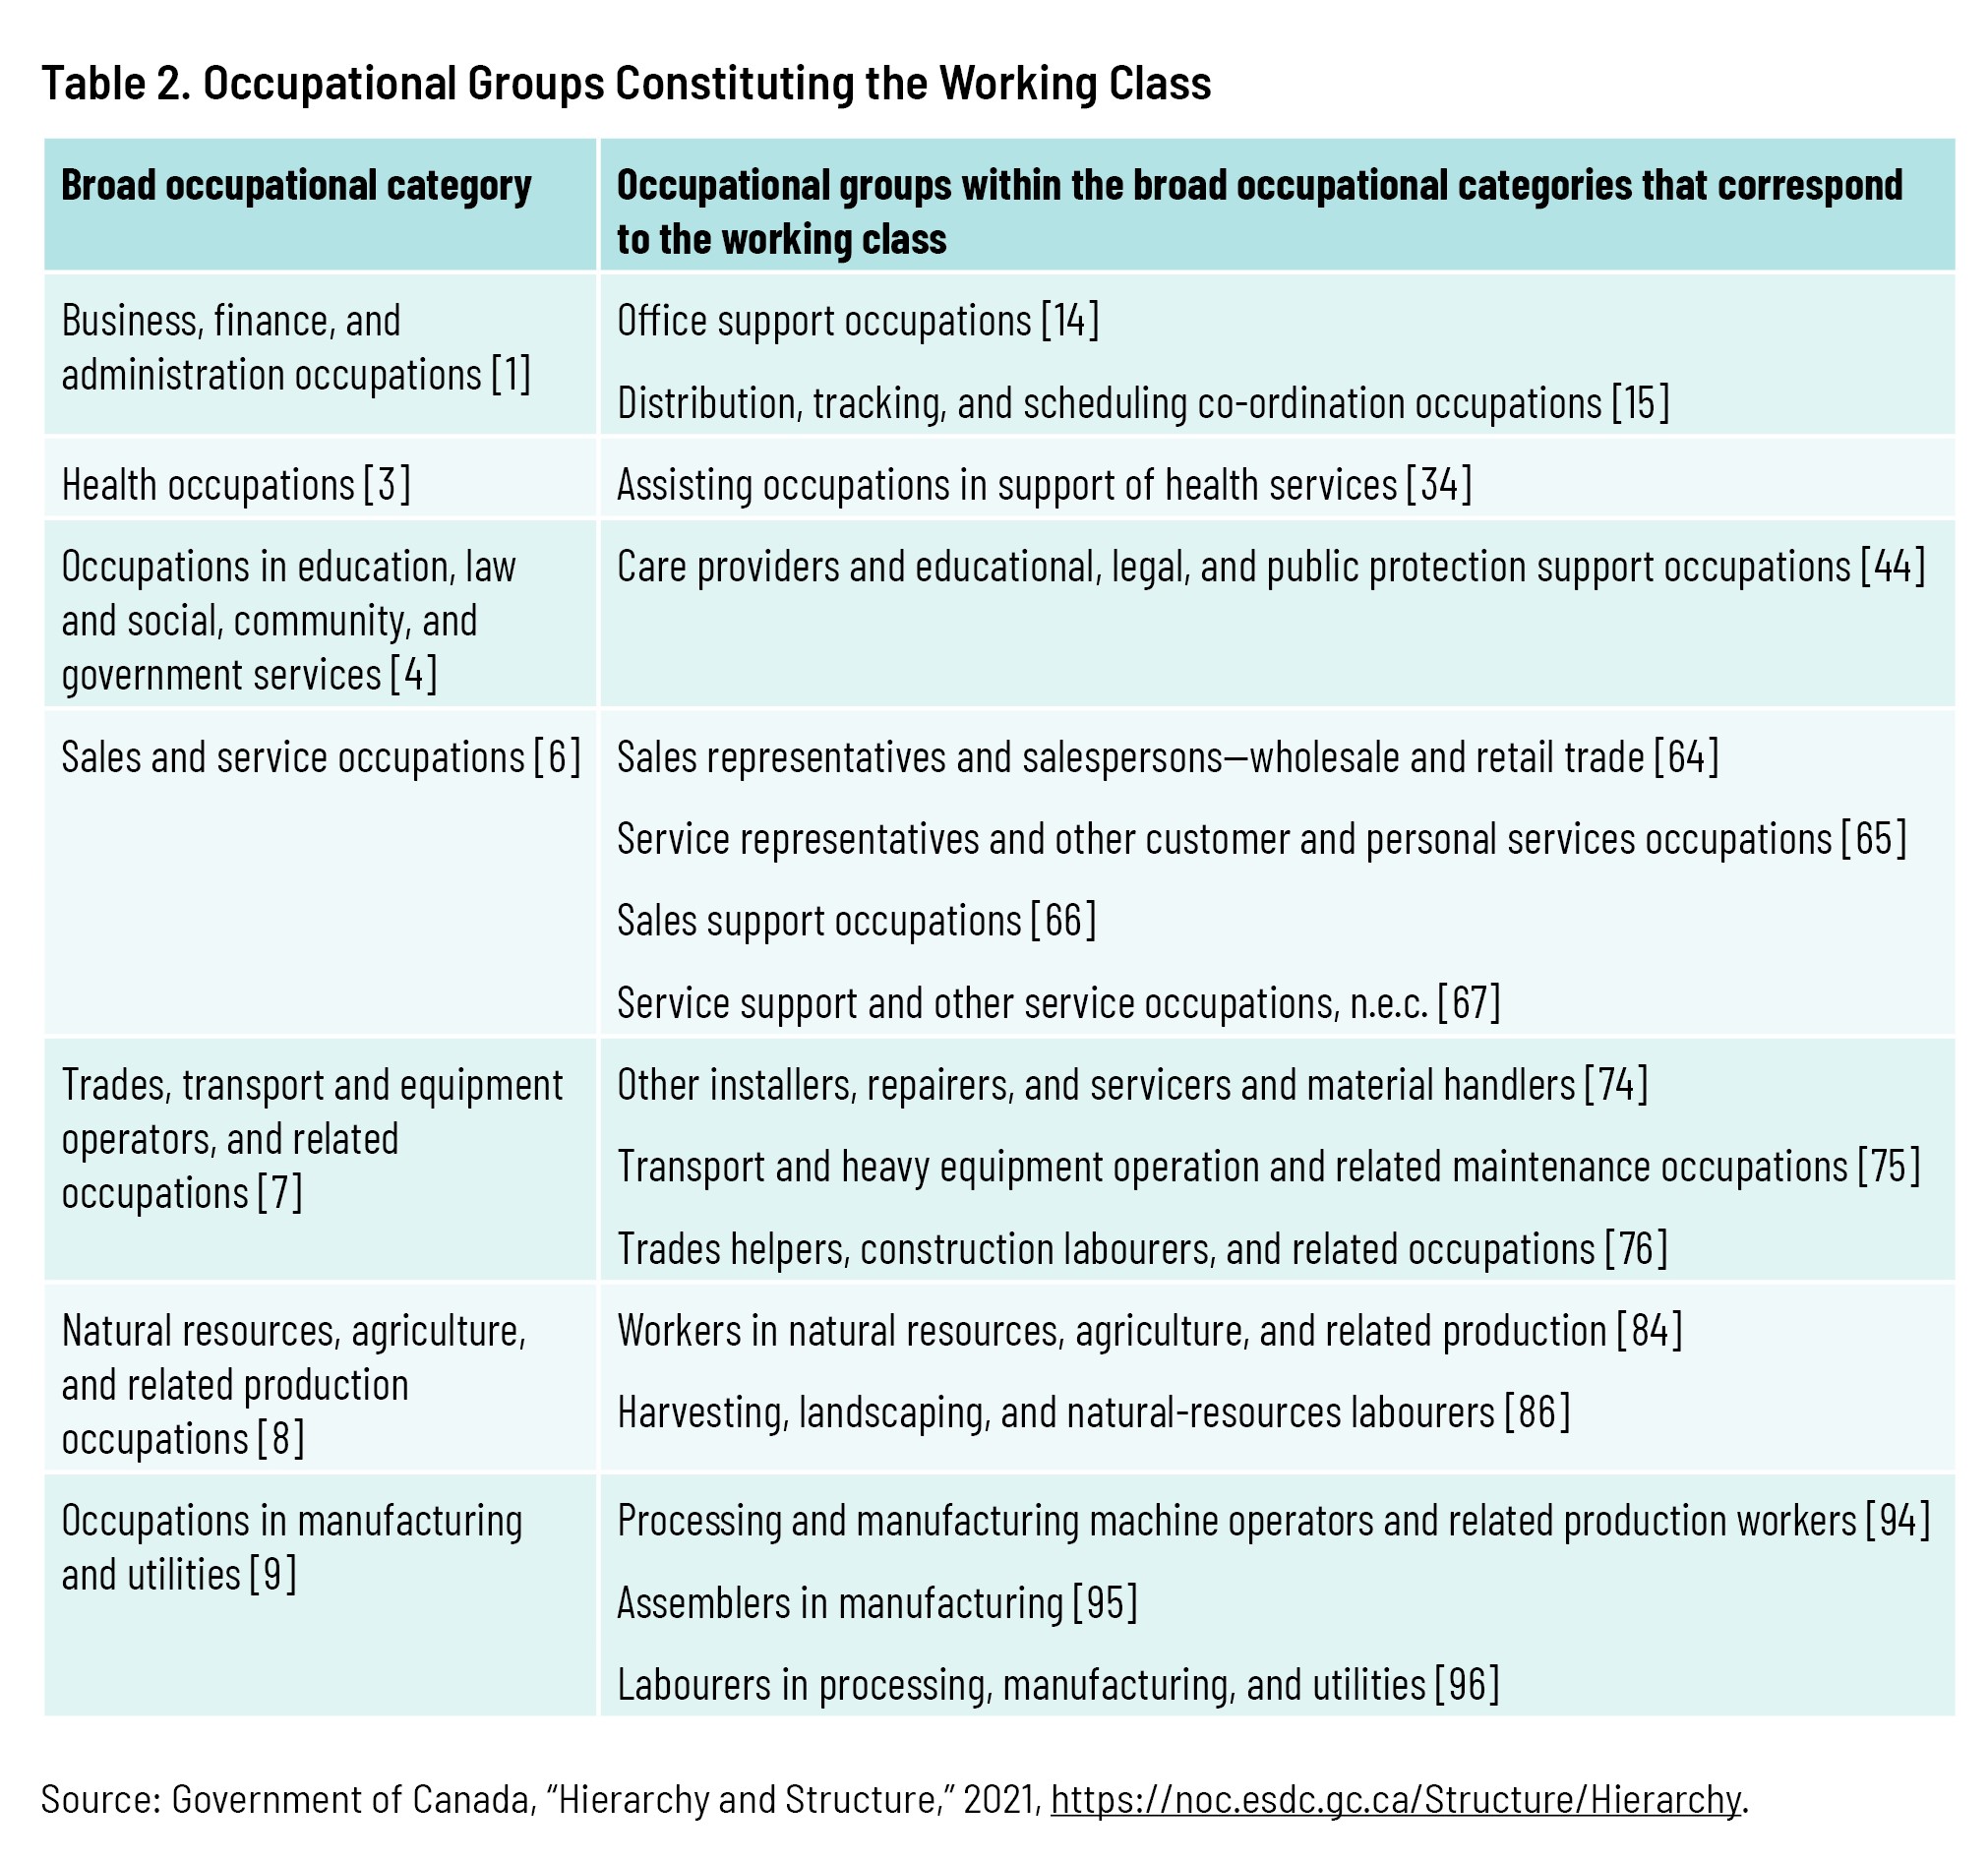
Specifically, for the purposes of this paper, we define the working class as those individuals employed in jobs of Skill Levels C and D according to the standardized classification model known as the National Occupational Classification, which is Canada’s national system for organizing occupations across the country. The Department of Employment and Social Development has produced a summary of the four skill levels (see table 1) that is useful for our purposes. 13 13 Government of Canada, “Skill Level,” 2021, https://noc.esdc.gc.ca/Training/SkillLevel/.
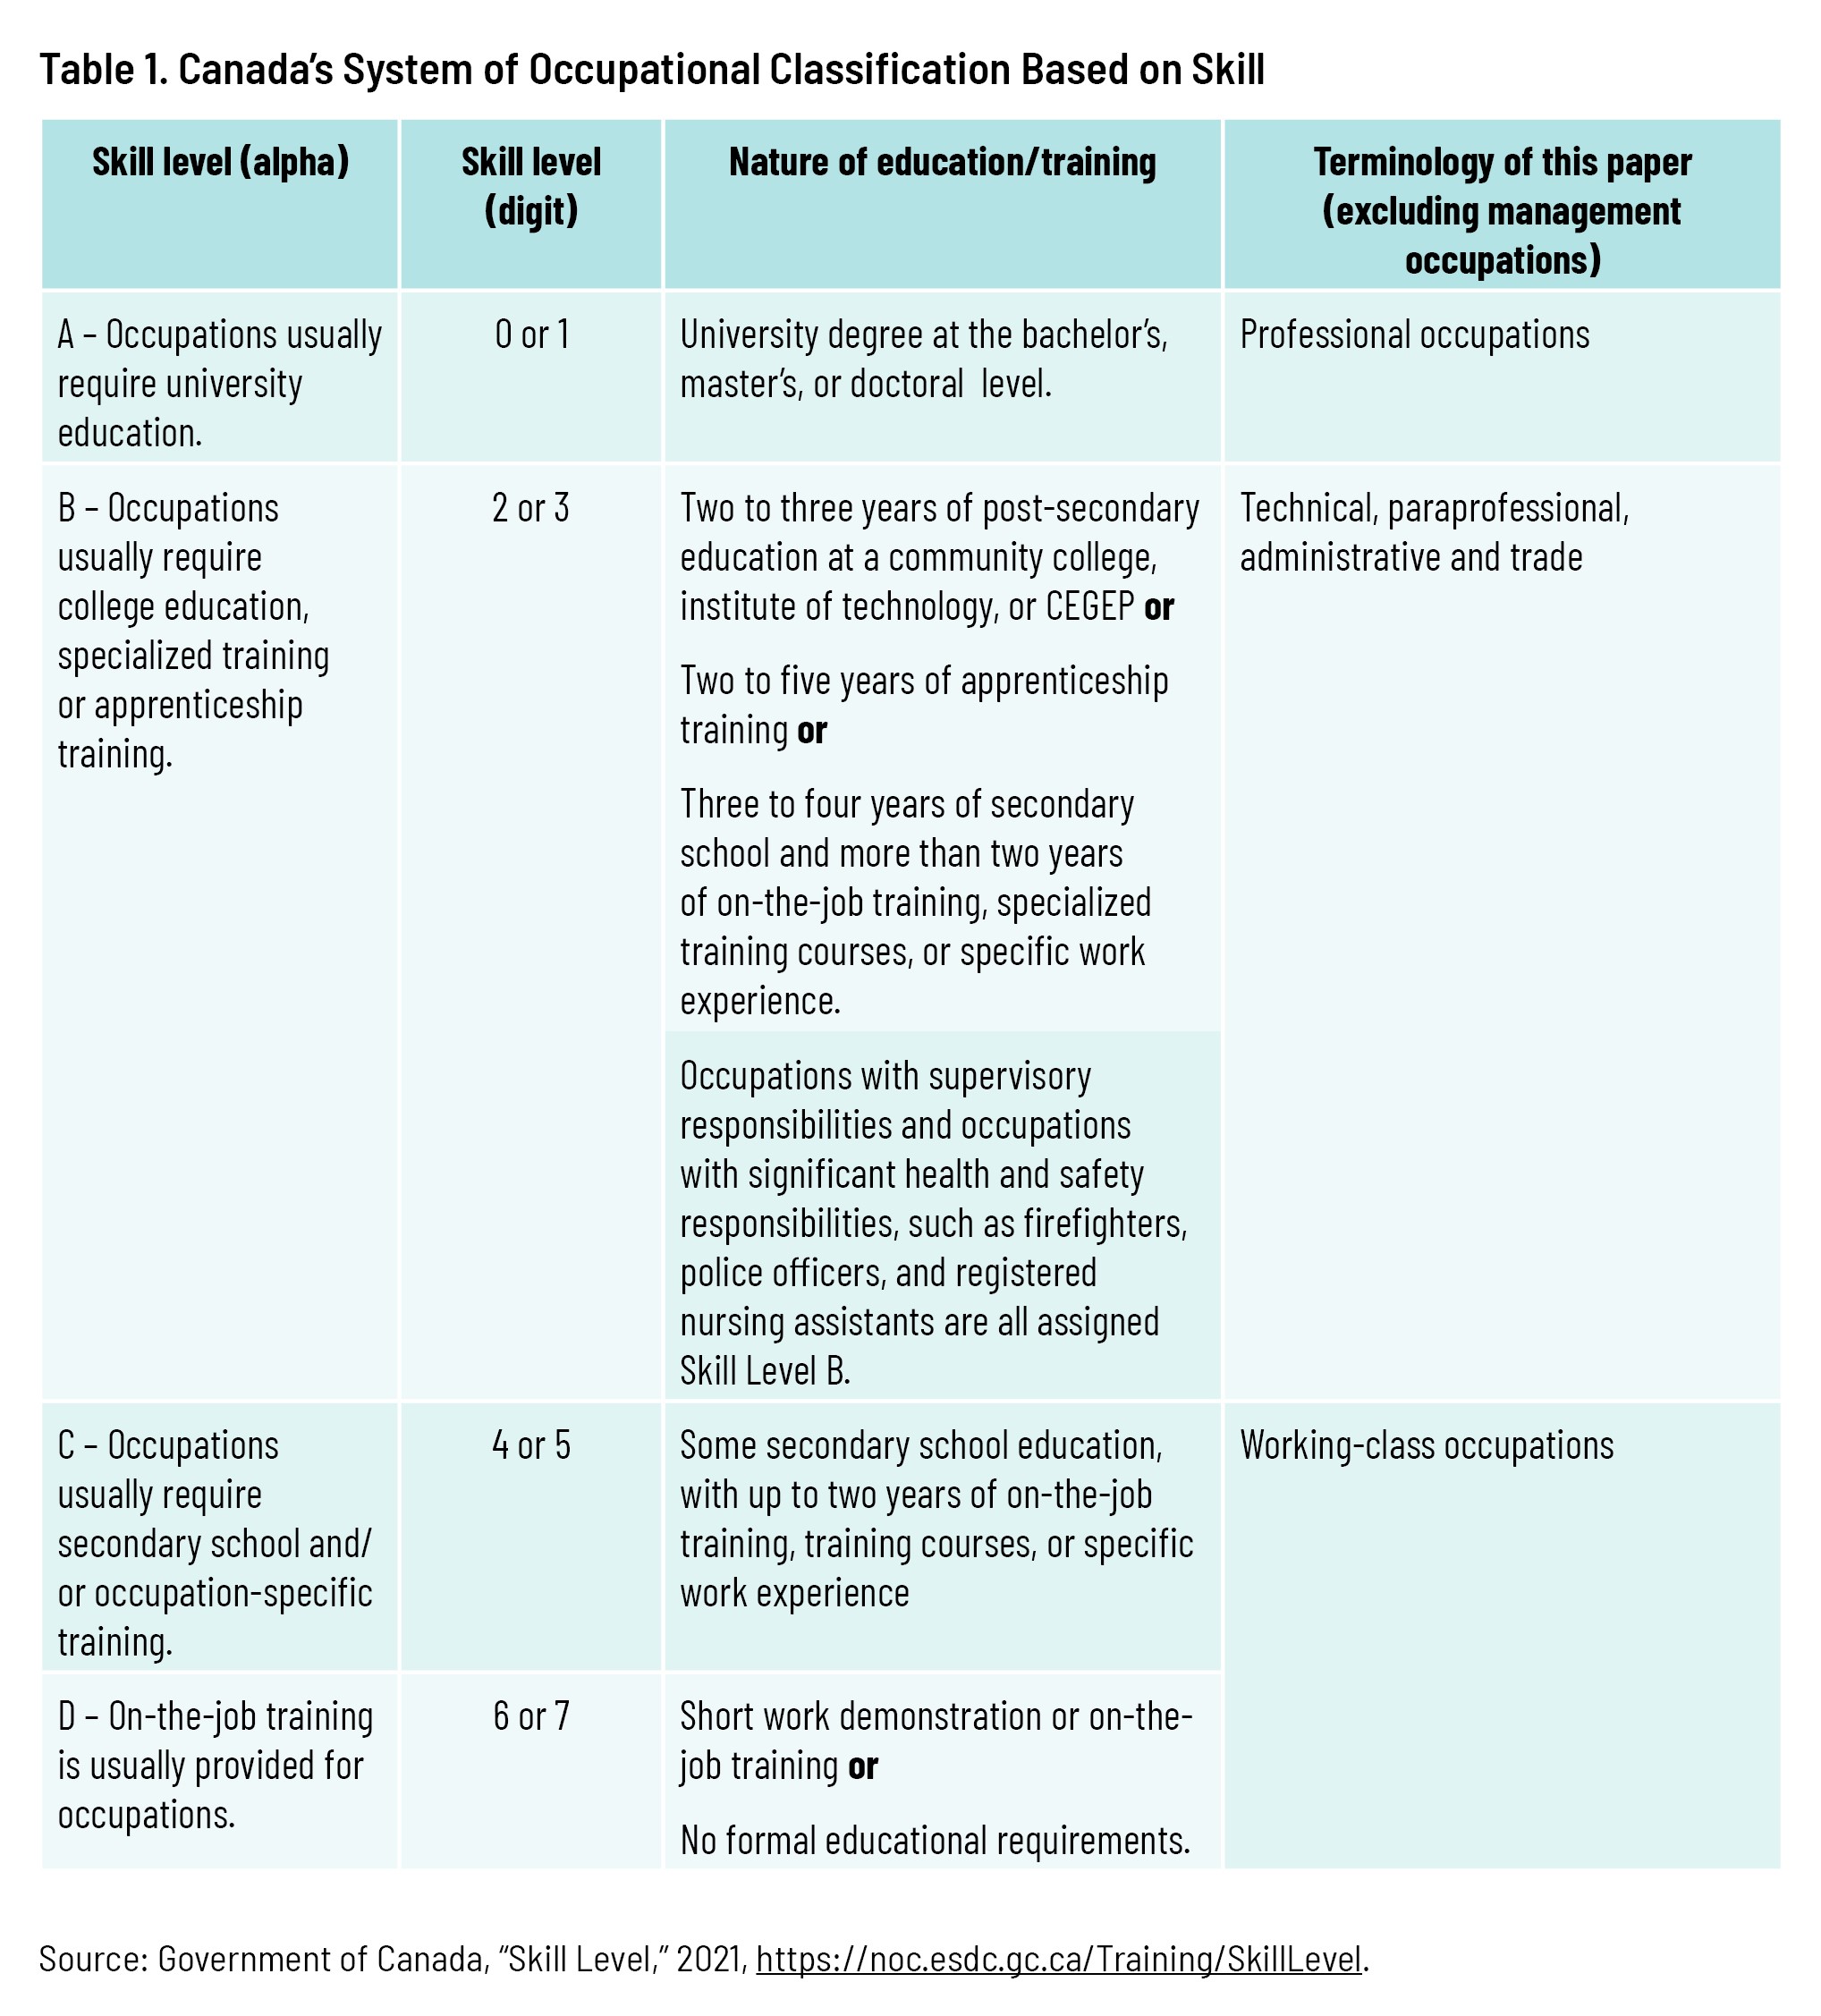
According to this definition of the working class for the purposes of this paper’s analysis, those in the following occupational groups, which are subsets of the broad occupational categories, are considered to be members of Canada’s working class:
An obvious consequence of limiting the definition of the working class to occupations in Skill Levels C and D is that we fail to capture workers in occupations of Skill Level A (generally requiring a university degree) and Skill Level B (generally requiring college education, specialized training, or apprenticeship training) that do not have those educational credentials. They would not be characterized as members of the working class because they are earning higher-skilled wages in spite of their credentials. Any form of generalized classification will not cover exceptions to the rule. But as a basis for data aggregation and analysis, it is a useful framework for understanding Canada’s modern working class. 14 14 This paper draws on data from both the Census and the Labour Force Survey. As a result, certain discrepancies arise because of differences between Census data, gathered every five years, and Labour Force Survey data, gathered every month. In order to mitigate these differences, this paper only makes comparisons between data from the same set. Readers should exercise caution in comparing data between different parts of the paper and ensure that comparisons are made only using same-source data. Furthermore, certain data samples in this paper are from the December 2021 Labour Force Survey. This date was chosen because it is the most recent data for 2021, which is our main year of comparison. The authors verified other data from 2021 and found broadly similar trends.
What Is an “Hourglass Economy”?
As outlined above, the first step must be to better understand who constitutes Canada’s working class, including their demographic characteristics, educational backgrounds, work experiences, and economic and social outcomes. It is also important to know more about the occupations in which they are increasingly concentrated. This is particularly true because our labour market is going through a major transformation in the form of what is known as job polarization.
Our previous research has organized Canada’s job market along the skills distribution—including low-, mid-, and high-skilled occupations. The methodology for these occupation-based categories draws from a combination of academic research and papers published by the World Bank and the International Monetary Fund. 15 15 To read more about the methodology and data sources, see appendix to Speer and Bezu, “Job Polarization in Canada.”
The share of jobs across the skills distribution has evolved over time. Over the past twenty or thirty years in particular, the composition of the labour market has bifurcated, with an increasing share of jobs concentrated at the top and bottom of the skills distribution.
There are various factors behind this trend—including, for instance, the decline of manufacturing employment in central Canada—but the outcomes are notable even if they are hardly unique to Canada. 16 16 Canada’s experience with job polarization is less marked than various other OECD countries. See Speer and Dijkema, “Fuelling Canada’s Middle Class.” Our previous egalitarian labour market, in which the vast majority of jobs were clustered in and around the middle of the skills distribution, is being increasingly replaced by what has instead been described as an “hourglass economy.”
Consider, for instance, that between 1989 and 2019, Canada experienced a 7.5-percentage-point increase in the relative share of high-skilled occupations and a corresponding drop in low- and mid-skilled jobs (see figure 1). 17 17 Speer and Bezu, “Job Polarization in Canada.”
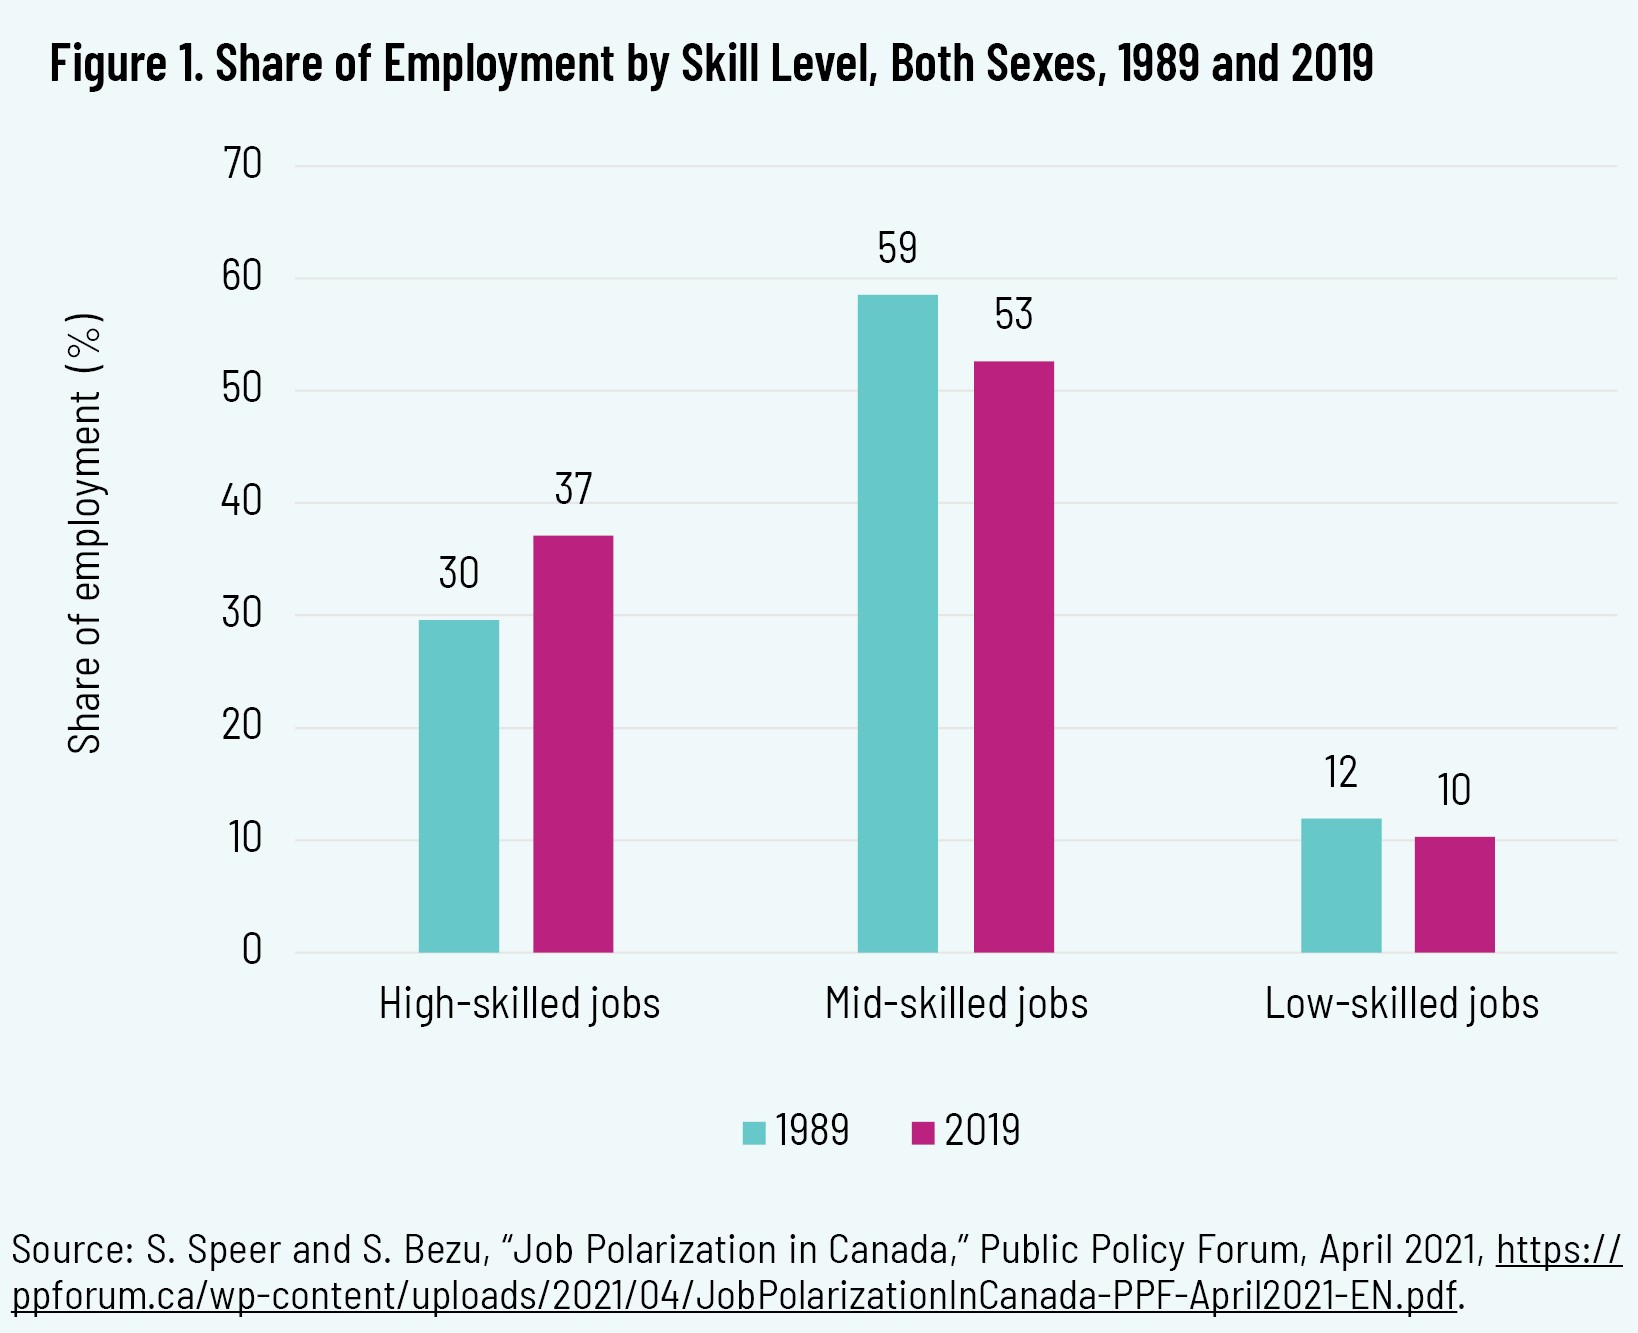
We have come to describe these trends as a “J-shaped” labour market. 18 18 Speer and Bezu, “Job Polarization in Canada.” They have major implications for the economic and social outcomes for median workers in Canada that are generally underreported by the media and under-analyzed by policy scholars. Not only do those in high-skilled jobs earn almost four times more than those working in low-skilled jobs, but these divergent experiences also manifest themselves differently according to industry, region, and other demographic or geographic characteristics. One of us has characterized job polarization (and its attendant consequences) as “the most important political economy challenge facing our society.” 19 19 S. Speer, “Conservatives Need to Start Solving the Problems of Today,” National Post, November 7, 2019, https://nationalpost.com/opinion/right-now-conservatives-need-to-start-solving-the-problems-of-today.
For all of the policy and political attention to income inequality in Canada, there can be insufficient focus on this key structural factor. There has been a tendency to emphasize the symptoms of inequality rather than to understand and address the underlying cause of an increasingly bifurcated labour market in which unequal outcomes are something of a natural outgrowth.
It is therefore worth understanding who is affected by these trends, where they live and work, and how their economic and social outcomes have changed as a result of job polarization. These questions build on our growing interest, in more general terms, in the experiences and perspectives of Canada’s working class in the context of the COVID-19 pandemic and over the longer term.
The occupational classification according to skill level that we used in our previous research is a broad reflection of the educational credentials and human capital generally required to carry out specific jobs. It is a technical definition rather than a class-based judgment, and does not account for sociological or political economy characteristics of certain regions, sectors, or jobs.
We have since drawn on further data and analysis to dig deeper and develop a working definition of Canada’s working class: it encompasses working-age Canadians with jobs that typically do not require any form of post-secondary education, which includes everyone in low-skilled occupations and those in relatively lower-skilled jobs among the mid-skilled occupational groups.
This point is worth emphasizing: the definition of working class for the purposes of this paper’s analysis is inclusive of the low-skilled jobs and a portion of mid-skilled jobs in figure 1. If the modern labour market’s skill distribution is J-shaped, Canada’s working class is mostly concentrated in the curved part. This may also explain why, as described below, the working class’s share of employment is declining, even while the overall labour market is becoming increasingly hourglass-shaped: the working class encapsulates more than just the lowest-skilled workers.
As mentioned earlier, there are of course exceptions to the rule. There are doubtless people who are underemployed in these occupations according to their educational credentials and human capital. 20 20 Speer and Bezu, “Job Polarization in Canada.” But the key point is that these occupational classifications enable us, in general terms, to observe big trends in the structure of our labour market and get a better understanding of the backgrounds and experiences of the people in these jobs.
Who Is Canada’s Working Class?
Size of the Working Class
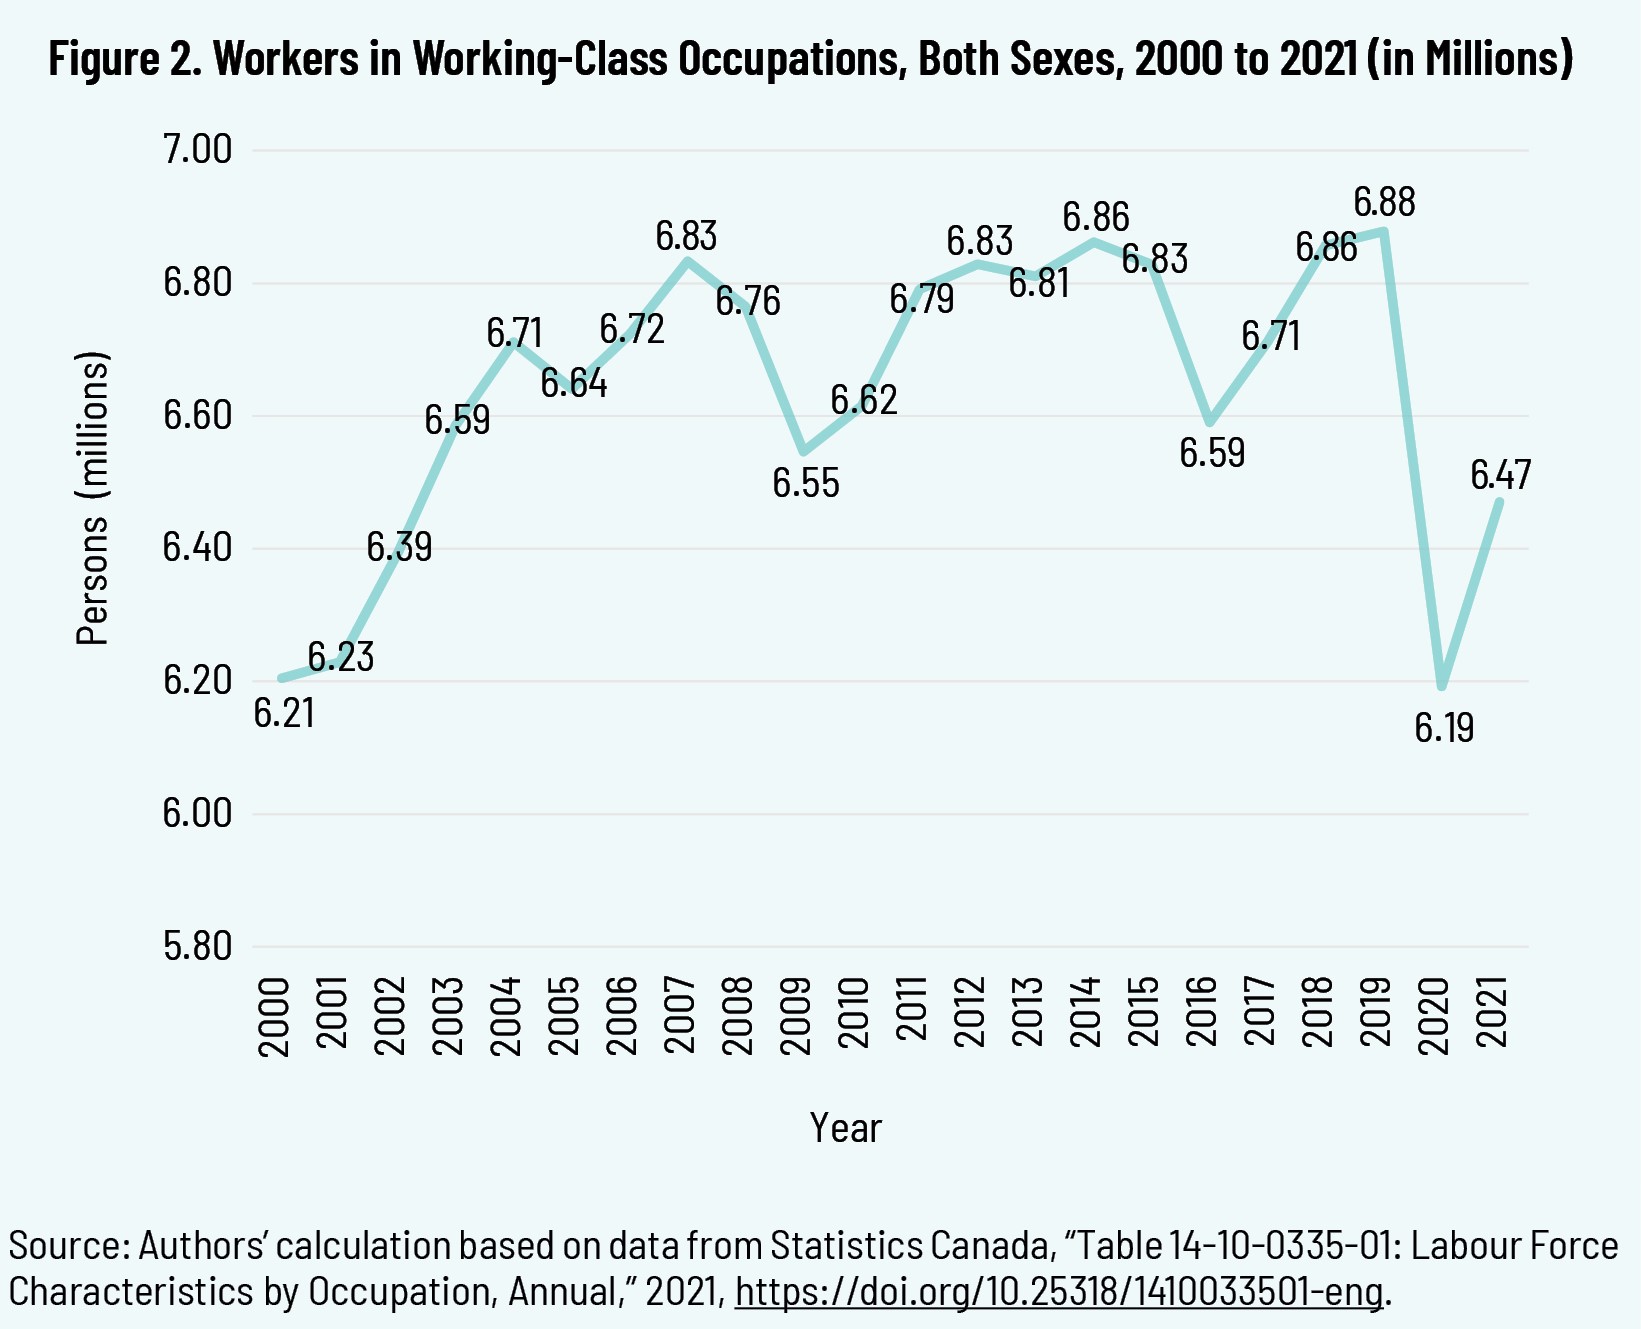
According to this definition, there were 6.5 million working-class Canadians in 2021 (see figure 2). They represent roughly 34 percent of those currently employed in the national economy, though it is important to recognize that working-class jobs were disproportionately affected by the COVID-19 pandemic and the accompanying public health restrictions.21 We know, for instance, that employment in restaurants and food services (which is highly composed of working-class workers) fell by nearly 60 percent in the pandemic’s first few months.22 It is likely too early to determine to what extent the numerical drop in working-class employment between 2019 and 2020 will have lasting consequences in terms of the size and sectoral distribution of Canada’s working class.
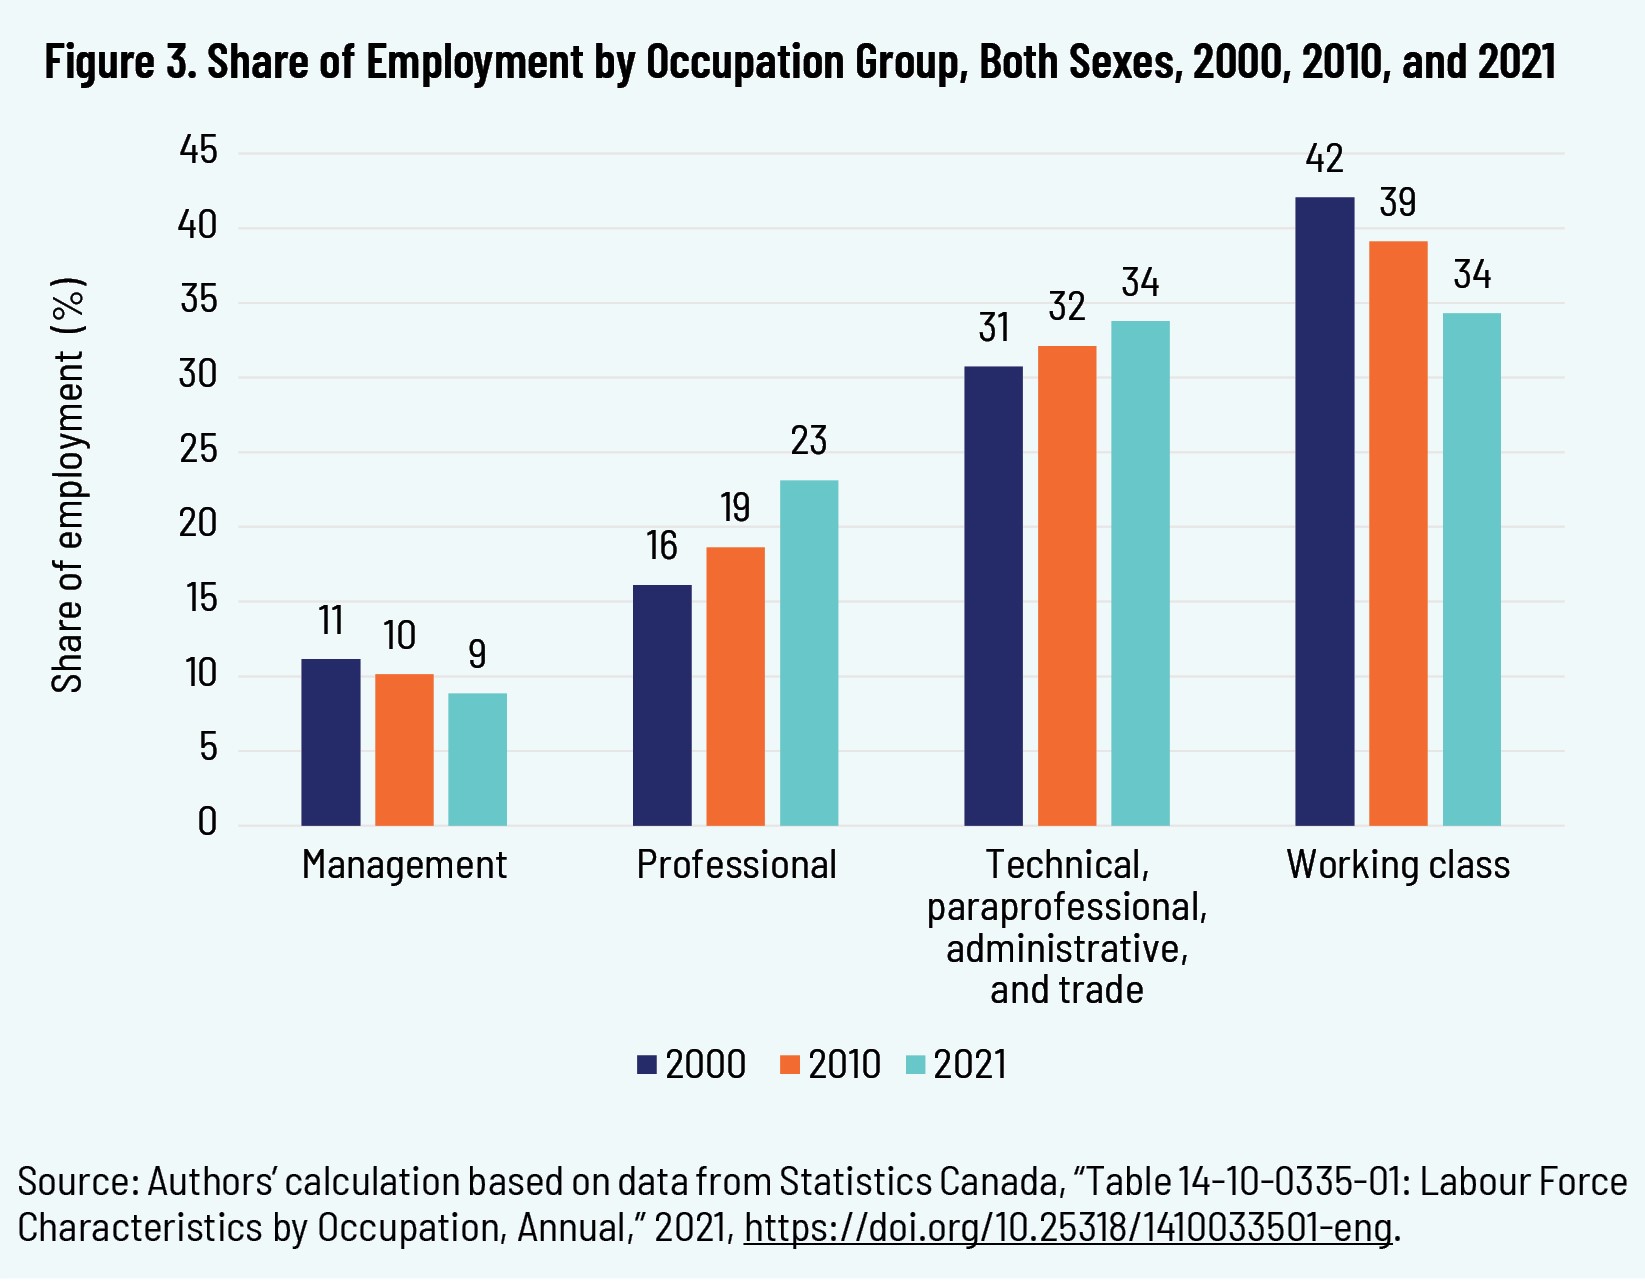
While the working-class population has fluctuated between 6.2 million and 6.9 million since 2000, the proportion of the workforce represented by the working class has been on a fairly consistent decline over the past two decades. It has fallen by roughly 8 percentage points since the start of this century: from 42 percent in 2000 to 39 percent in 2010 to 34 percent in 2021 (see figure 3).
The decline would not have been as dramatic if it were not for the effect of the pandemic lockdowns, but it still would have been considerable even without these extraordinary circumstances. If working-class employment in 2021 had matched the average employment levels of the five years before the pandemic, then the working-class share of the Canadian workforce would have been 37 percent instead of 34 percent, which still reflects a decline of five percentage points from the 42-percent share in 2000.
Notwithstanding these relative declines in recent decades, the working class is still a significant part of Canada’s labour market and a sizeable political economy constituency. If working-class Canadians were a geographic entity, they would be the equivalent of Canada’s third-largest province, or bigger than the populations of Saskatchewan and Alberta combined. 23 23 Statistics Canada, “Table 17-10-0009-01: Population Estimates, Quarterly,” June 2021, https://www150.statcan.gc.ca/t1/tbl1/en/tv.action?pid=1710000901. If they were a singular voting bloc, they would have won the popular vote in the 2019 and 2021 federal elections. 24 24 The Conservative Party won the popular vote in the 2019 and 2021 federal elections with 6.24 million votes and 5.7 million votes respectively.
Gender
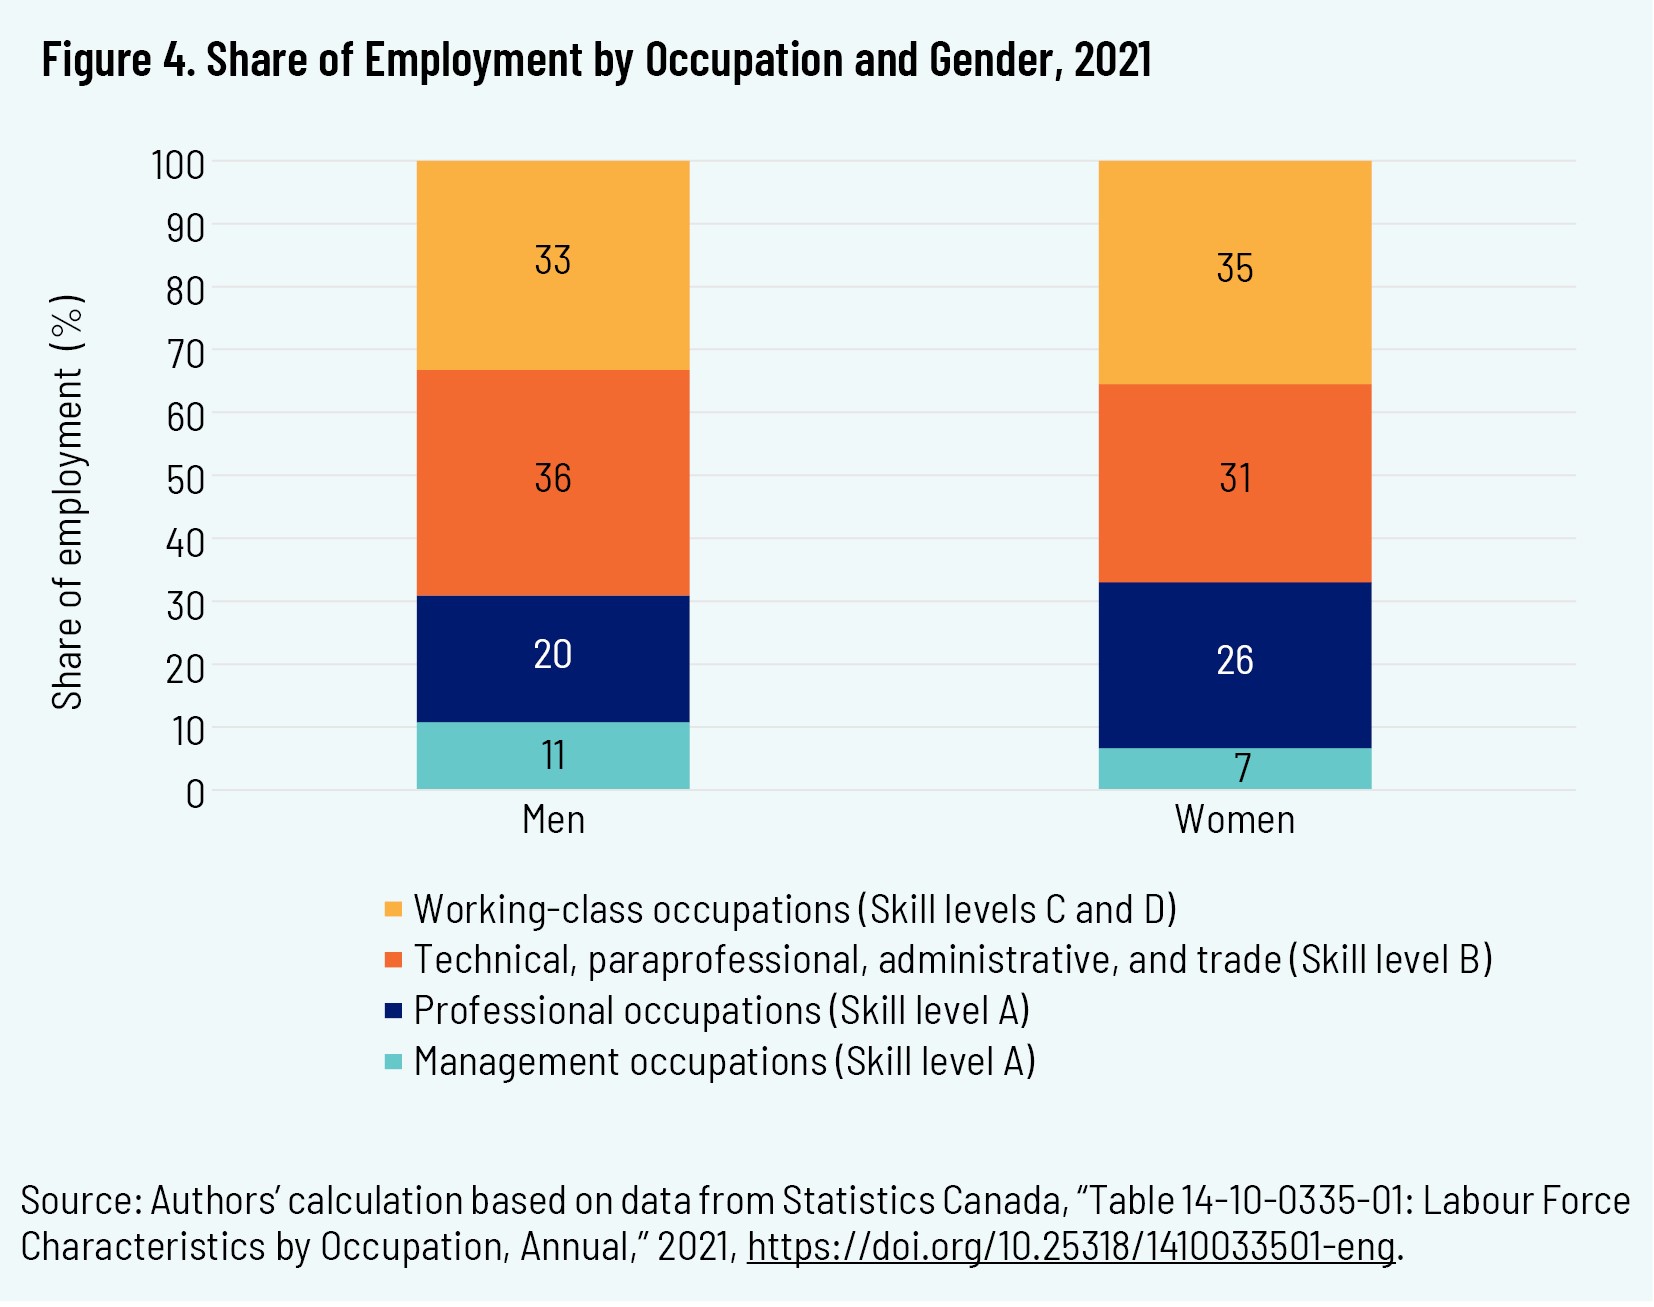
In terms of demographics, men accounted for 51 percent of Canada’s working class in 2021—though, as we outline later, for most of the past twenty years women have constituted a small working-class majority. The picture is even more pronounced when we look at gender distribution relative to the workforce overall and the types of occupations in which men and women tend to be employed. Thirty-five percent of female workers in Canada are engaged in working-class employment, compared to 33 percent of male workers (see figure 4). Therefore, while the working class itself is nearly evenly split between men and women, female workers are more likely than male workers to be employed in working-class occupations, by two percentage points.
Outside of working-class occupations, it is noteworthy that, as figure 4 shows, a greater proportion of female workers are employed in professional occupations (26 percent) relative to the proportion of male workers employed in the same (20 percent). Male workers instead find a greater proportion of employment in paraprofessional and technical occupations, as well as management jobs.
Age
As for age demographics, there is a substantial relationship between one’s age and one’s employment in a working-class occupation. The vast majority of Canadian workers under the age of twenty-four are in working-class jobs (see figure 5). This is consistent with a large body of research that shows that most minimum-wage earners are younger workers. 25 25 See, for instance, a 2021 Fraser Institute study that finds that 53 percent of minimum-wage workers in Canada are between the ages of fifteen and twenty-four. B. Eisen and M. Palacios, “Who Earns the Minimum Wage in Canada?,” Fraser Institute, 2021, https://www.fraserinstitute.org/sites/default/files/who-earns-the-minimum-wage-in-canada.pdf.
This finding is intuitive. These workers have for the most part not yet secured any of the post-secondary credentials that would normally be required for higher-skilled jobs in the technical, paraprofessional, administrative, trade, or professional occupations. As they graduate from post-secondary education, many of them presumably move into jobs that are more commensurate with their educational attainment, which would explain the rapid decline of the proportion of working-class jobs in the cohort of those aged twenty-five to twenty-nine. Yet 33 percent of workers in this age group remain in working-class jobs. This figure never drops below one-quarter of workers for any age cohort.
The age-based decline in working-class employment starts to reverse itself for those aged between forty and forty-four. The share reaches as high as 41 percent for those aged sixty-five to sixty-nine. This is perhaps owing to the earlier retirement of those high-skilled workers who can most afford to leave the workforce in their fifties.
Because members of the working class earn less on average than other workers (see “How Has Canada’s Working Class Performed?” below), it may be that older members of the working class must continue working as they approach or even pass age sixty-five, whereas higher-skilled and higher-paid workers may be able to retire earlier. If their age-based contemporaries in the management and professional classes are retiring earlier in relative terms, then this would necessarily increase the relative size of the working class as a proportion of all active workers.
It is also possible that the working-class share rises according to age because retirees or those close to retirement (including those previously in professional or managerial occupations) may choose to return to work in low-skilled occupations such as retail jobs on a full- or part-time basis in search of activity, disposable income, or socialization. 26 26 See, for instance, J. Crosby, “More Seniors Drawing Paychecks from Retail Jobs,” Minneapolis Star Tribune, July 30, 2008. https://www.startribune.com/more-seniors-drawing-retail-paychecks/26120549/.
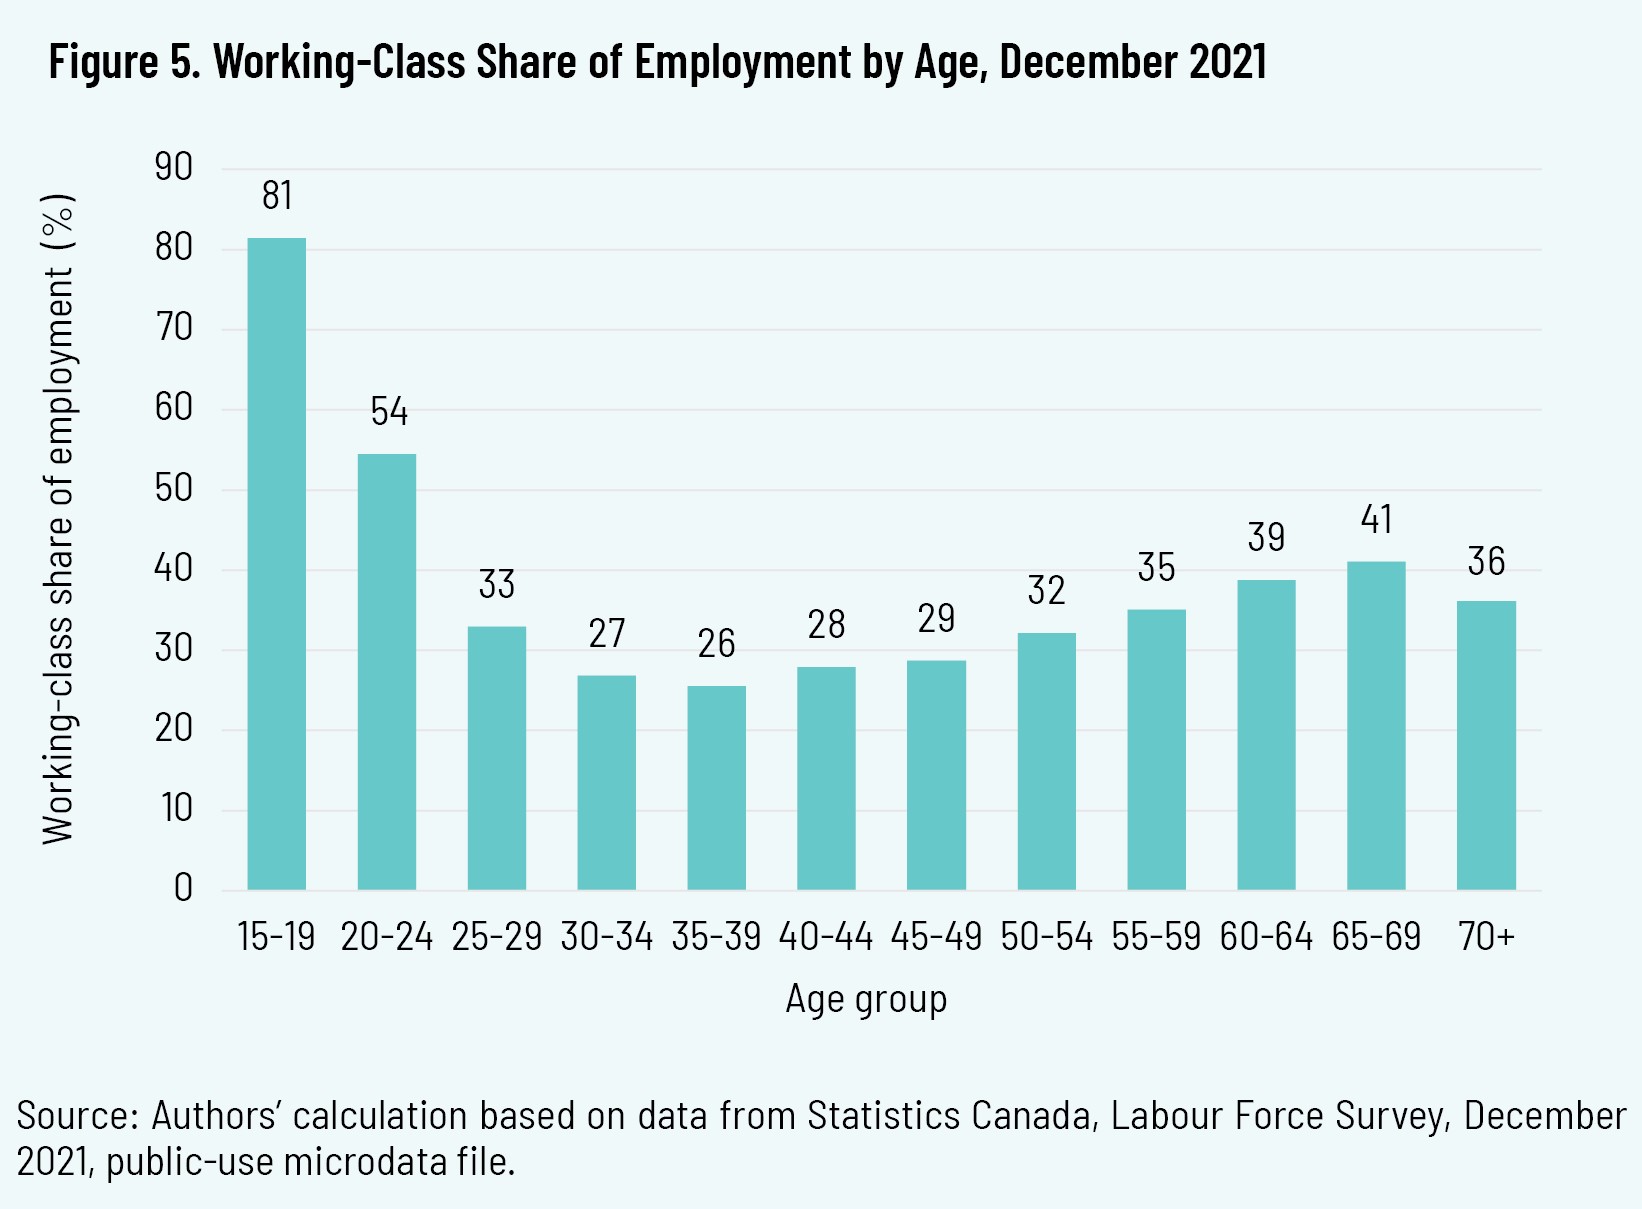
We find, then, a working class that is predominantly quite young or straddling either side of retirement age by a period of about ten years. As a matter of age demographics, the Canadian working class is something of a U-shaped labourmarket phenomenon. Middle-aged workers are comparatively less likely to be in working-class jobs, though at 28 to 32 percent they are still a sizable proportion of the overall working-age population.
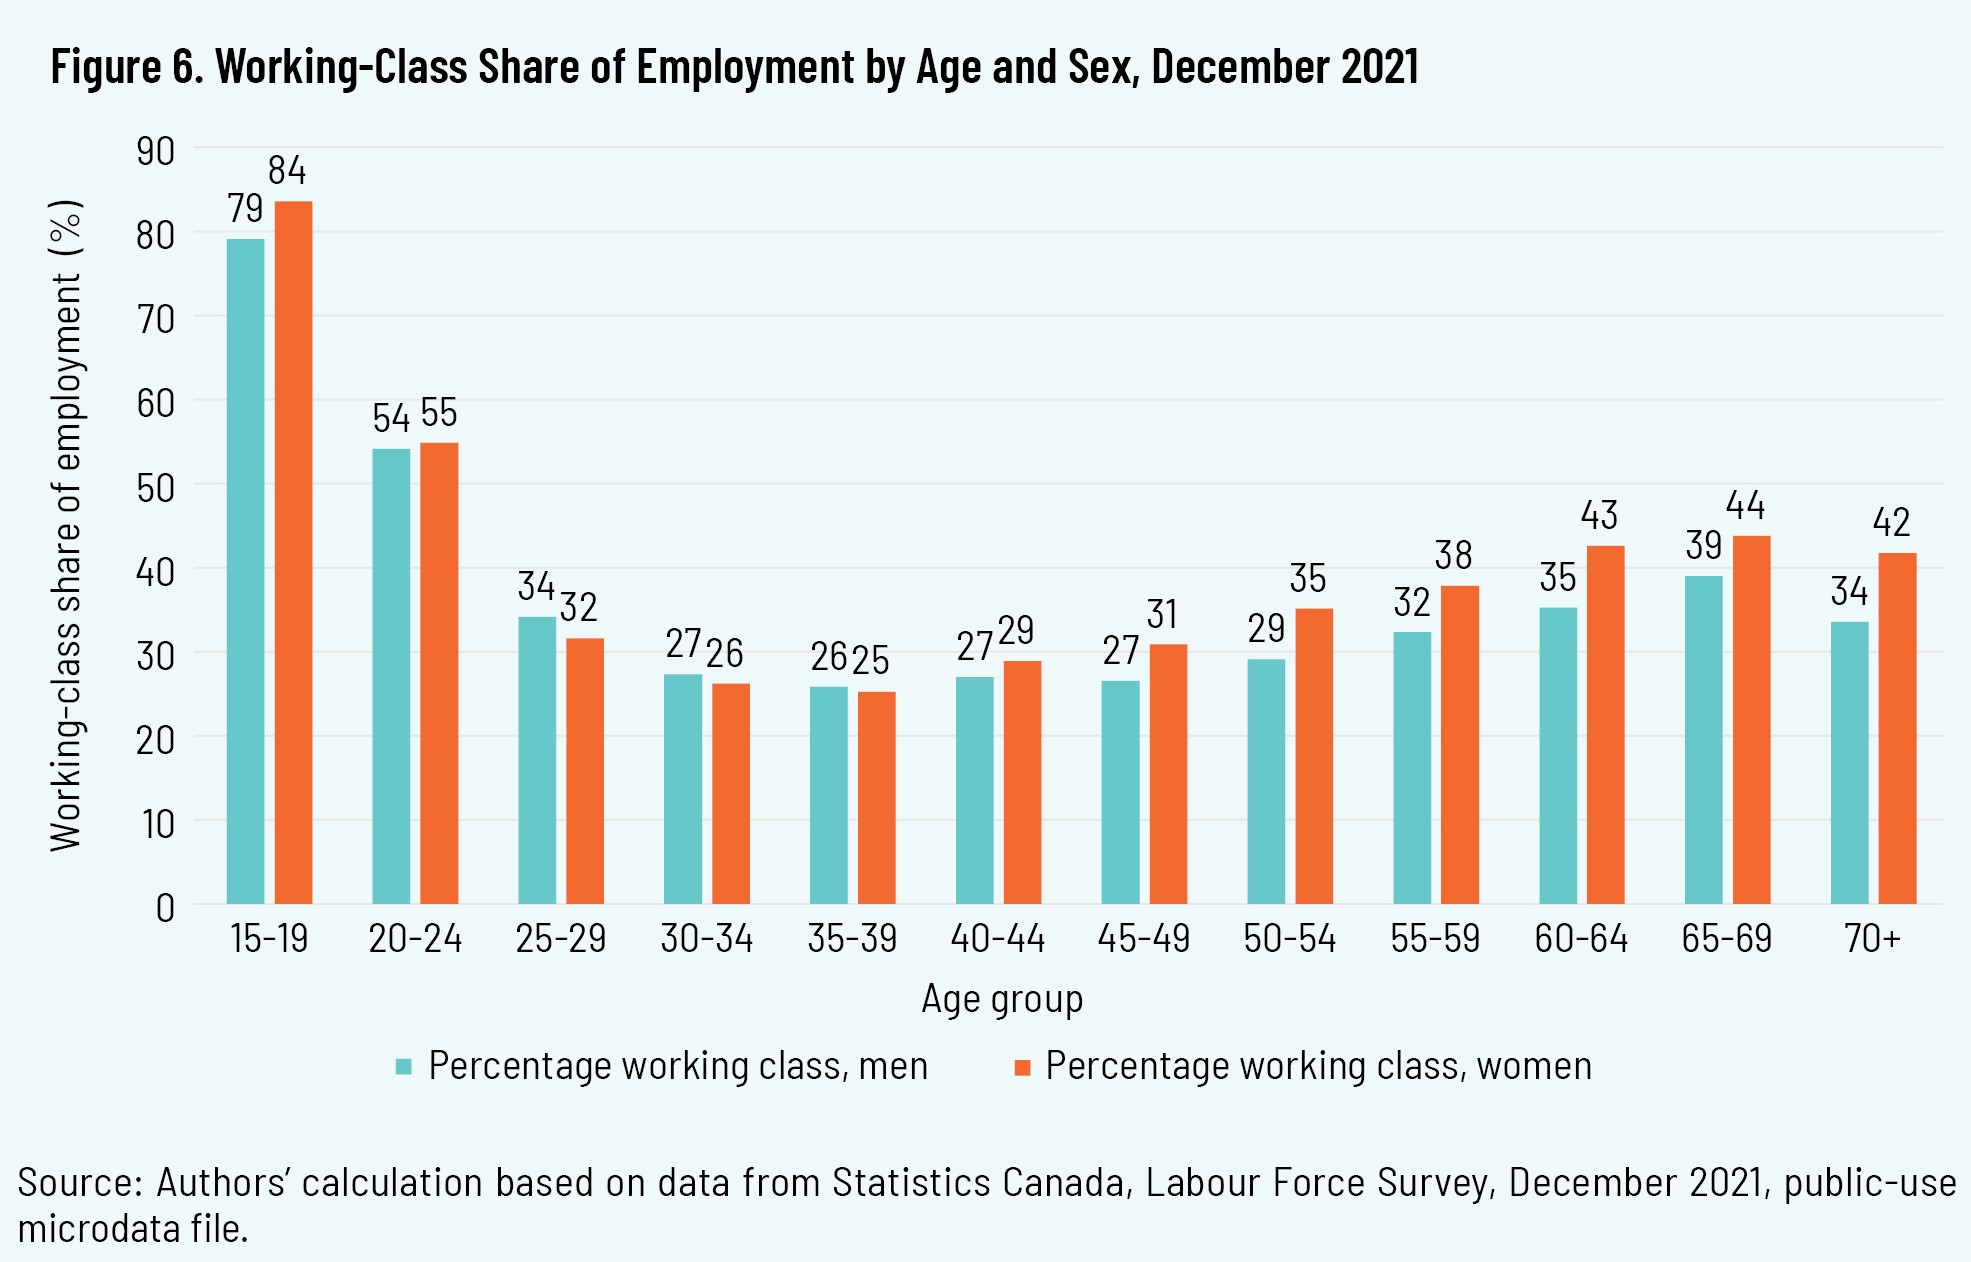
The intersection of age and gender shows a similar, though more pronounced, U-shaped phenomenon. We saw above that female workers are more likely to have working-class jobs, so it is not surprising that the proportions here would be higher for women than for men in some age cohorts. However, it is noteworthy that the gender gap between men and women grows after age forty, with a greater proportion of women than of men in the working class. The gap is largest among those aged sixty to sixty-four and over seventy. Older women, therefore, are more likely to be in the working class than older men, by fairly substantial margins. The opposite is true for the age cohorts between twenty-five and thirty-nine, where the proportions of women who are working class are lower than the proportions of men, though only marginally for all age cohorts between twenty-five and thirty-nine (see figure 6). This may suggest that working-class women are more likely than women in other occupational categories to leave their employment during child-bearing years.
Leading Working-Class Occupations
Of the broad occupational categories, 27 27 In this section, we examine the broad occupational categories according to the National Occupational Classification. The sixteen occupational groups outlined in the Definitions and Methodology section of this paper constitute in part these broad occupational categories. the largest share of working-class occupations is now in sales and services (45 percent). 28 28 Authors’ calculation based on data from Statistics Canada, “Table 14-10-0335-01: Labour Force Characteristics by Occupation, Annual,” 2021, https://doi.org/10.25318/1410033501-eng. This category includes, for instance, most retail jobs. This is a much higher proportion of working-class employment than the occupational category’s share of overall employment (22 percent). 29 29 Statistics Canada, “Table 14-10-0335-01.”
The second-largest occupational group for working-class people is the trades, transport, and equipment operators and related occupations (18 percent), followed closely by business, finance, and administrative occupations (14 percent).
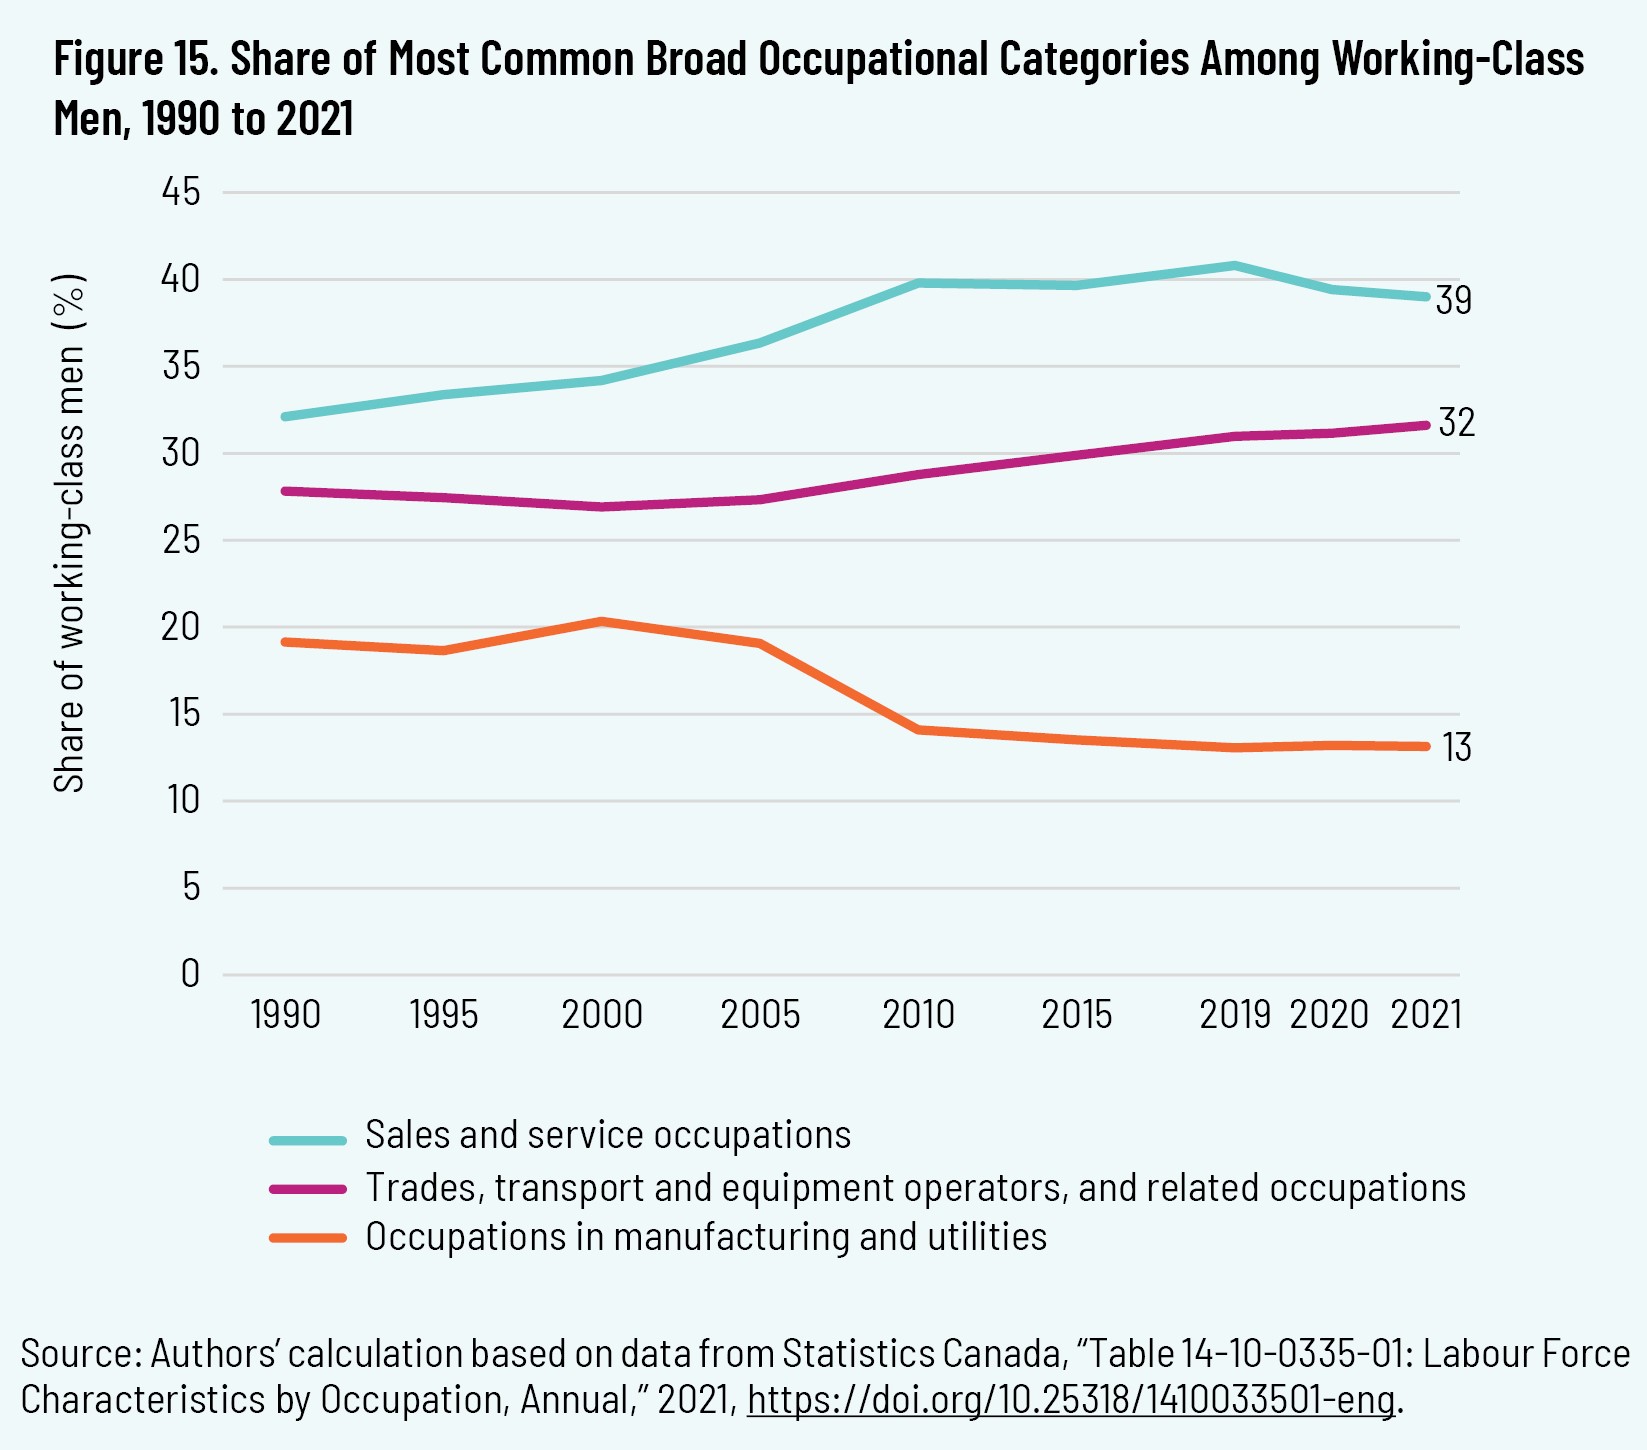
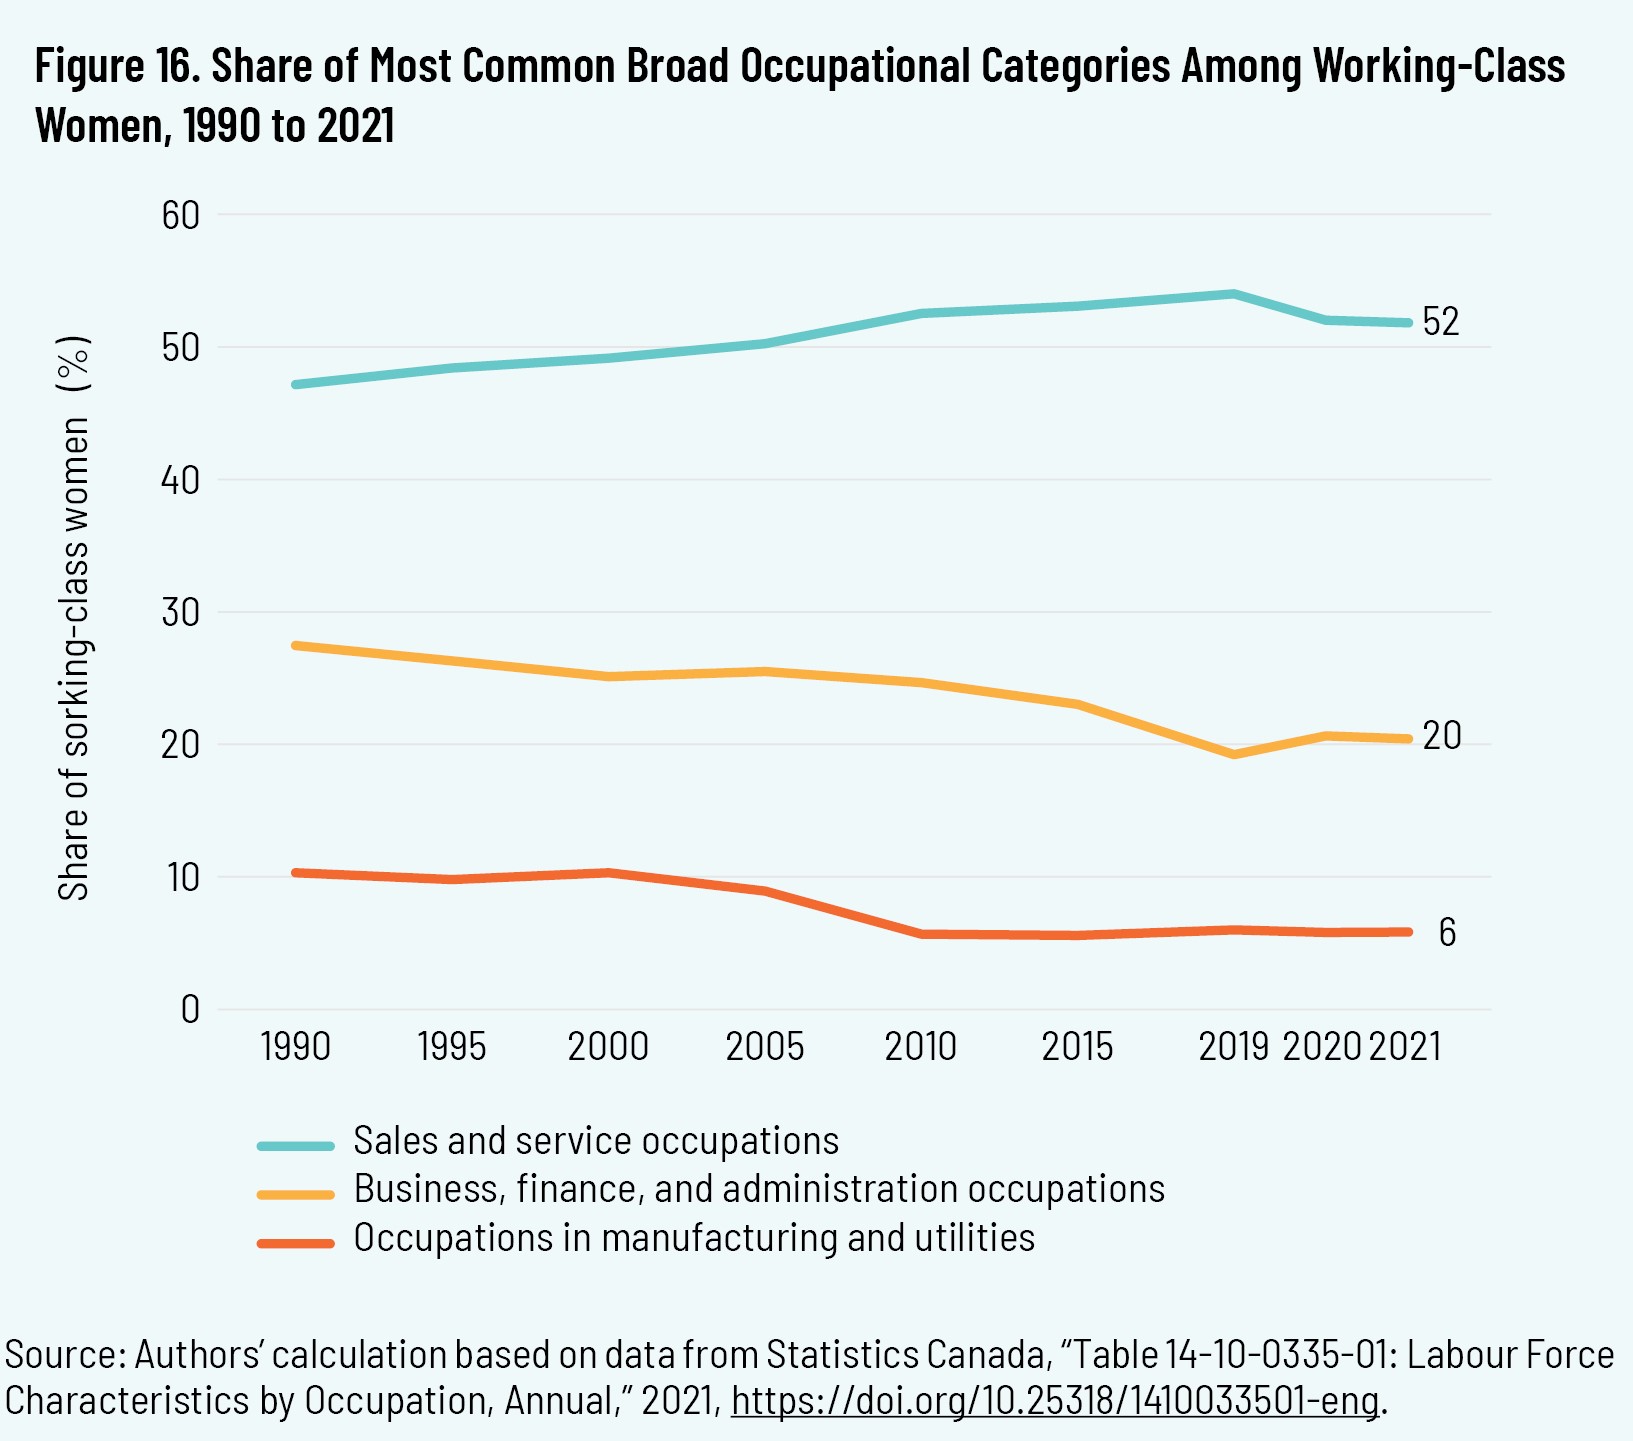
As discussed earlier, this overall picture changes when we disaggregate working-class occupations between men and women (see table 3). While sales and service jobs are the leading category for both working-class men and working-class women, a much greater proportion of the latter are employed in this category (52 percent) than of the former (39 percent).
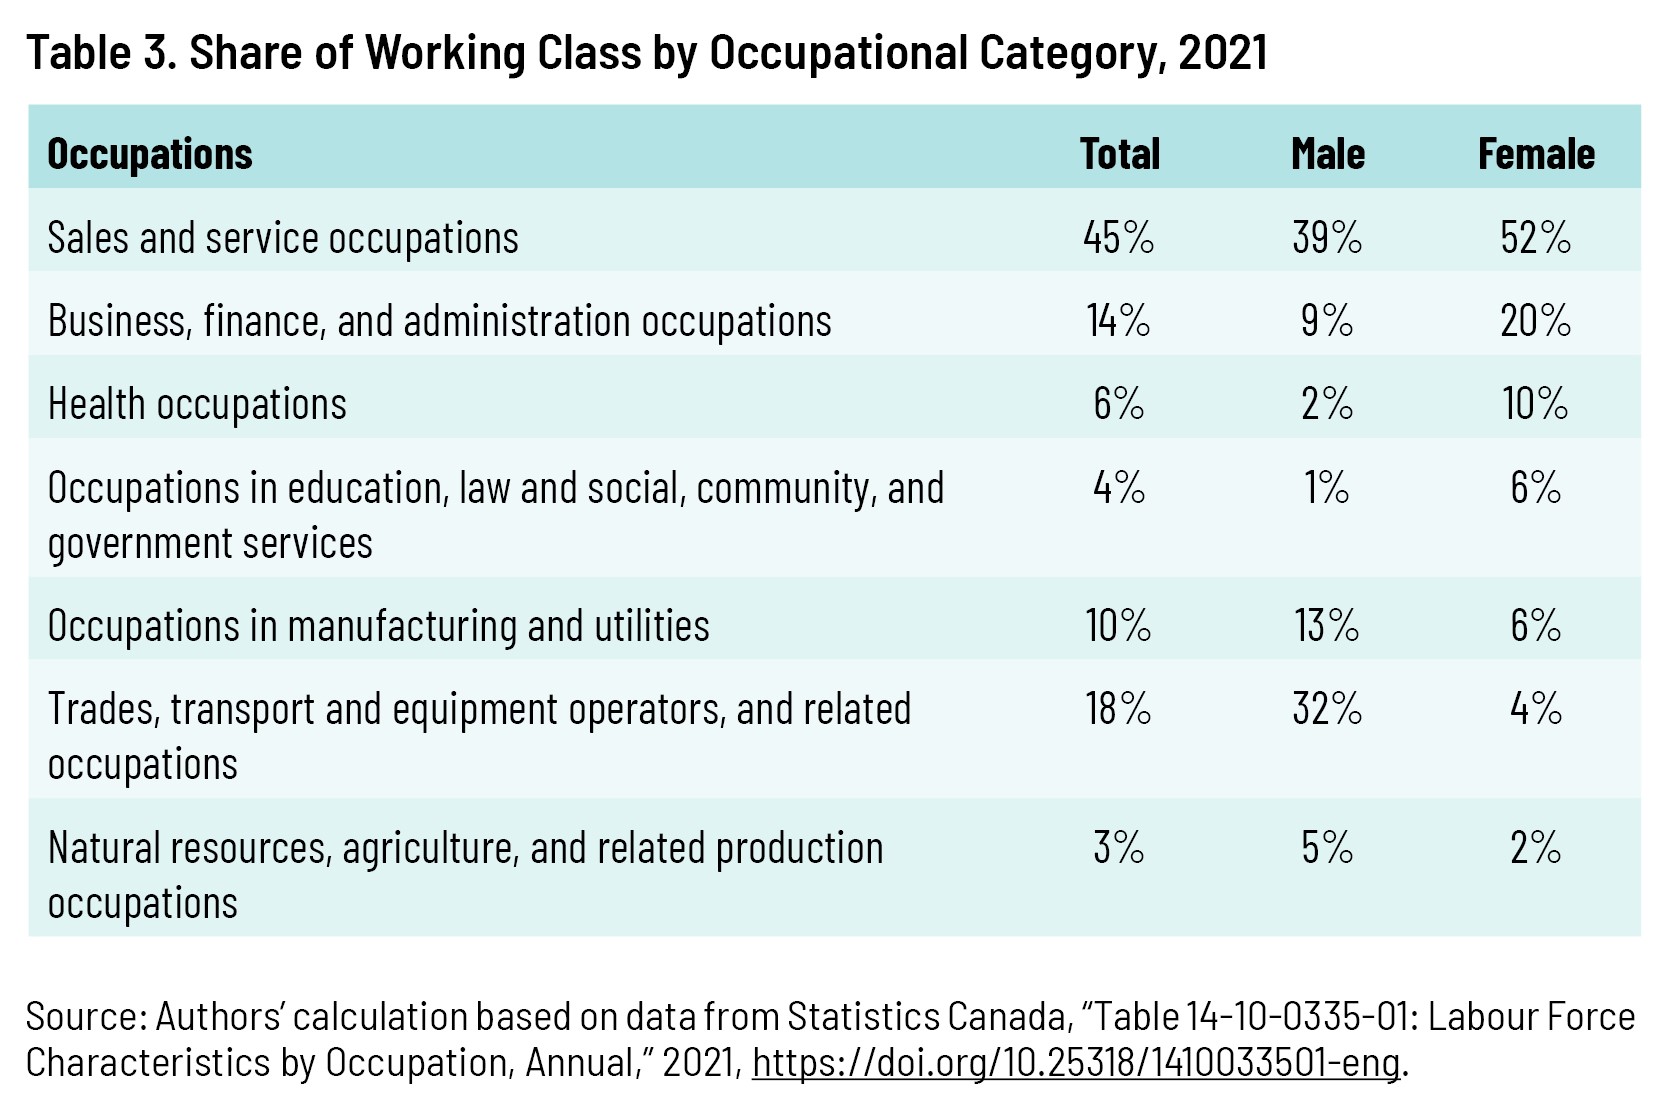
The trades, transportation, and equipment operators and related occupation groups, by contrast, represent 32 percent of working-class men, compared to just 4 percent of working-class women. Business, finance, and administration occupations represent 20 percent of working-class women, but only 9 percent of working-class men. Similarly, 10 percent of working-class women work in health occupations, whereas only 2 percent of working-class men do.
The key takeaway here is that while sales and service jobs represent the plurality of working-class jobs, including for both working-class men and women, there are generally gendered differences in the types of working-class jobs held by men and women.
Geography
Canada’s working class is not evenly distributed across the country. While the national average for the share of employment in working-class jobs was 34 percent in 2021, this masks some variations across the country (see figure 7).
Of the ten provinces, the working class represents the largest share of employment in New Brunswick, at 40 percent. The other Atlantic provinces come close, each with around 38 percent of provincial workers in working-class jobs. In the rest of country, only Saskatchewan and Manitoba’s working-class populations reach a comparable share of total employment.
The province with the lowest share of a working-class population is Alberta, with 33 percent, although the remaining provinces—British Columbia, Ontario, and Quebec—are only marginally higher.
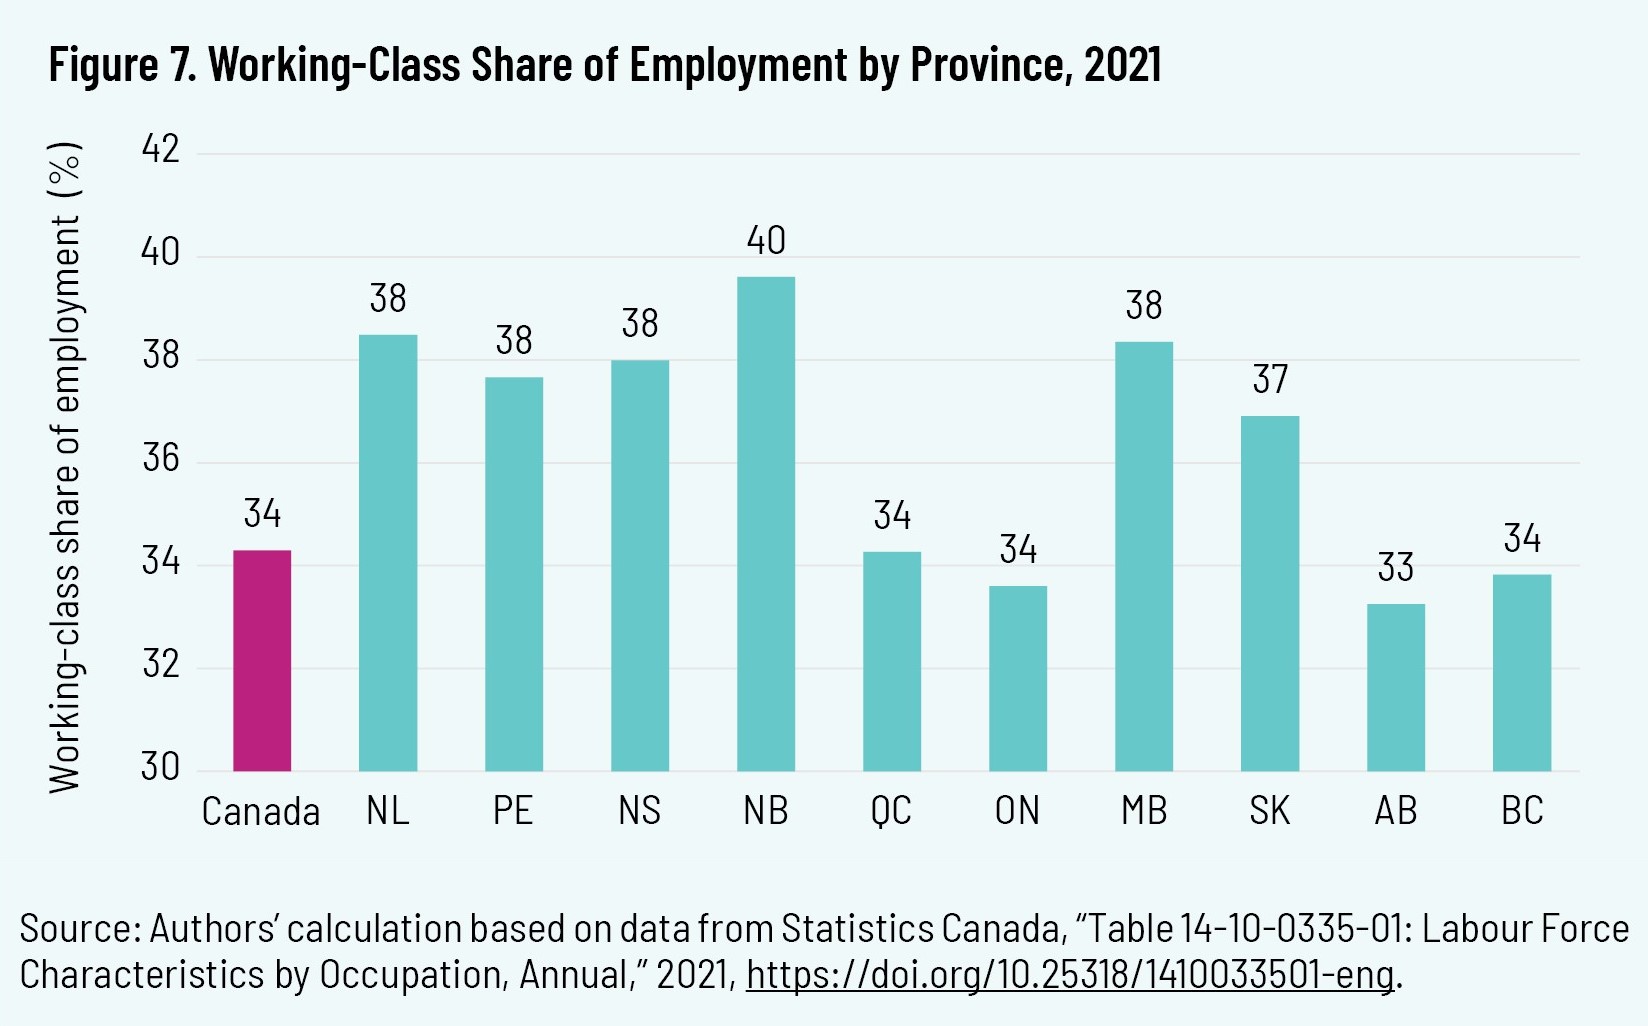
Political economy in Canada has always had a strong regional flavour. The geographical distribution of the country’s working class is no different, with each of the Atlantic provinces and two of three Prairie provinces having a higher share of working-class workers than each of the central Canadian and the two western-most provinces.
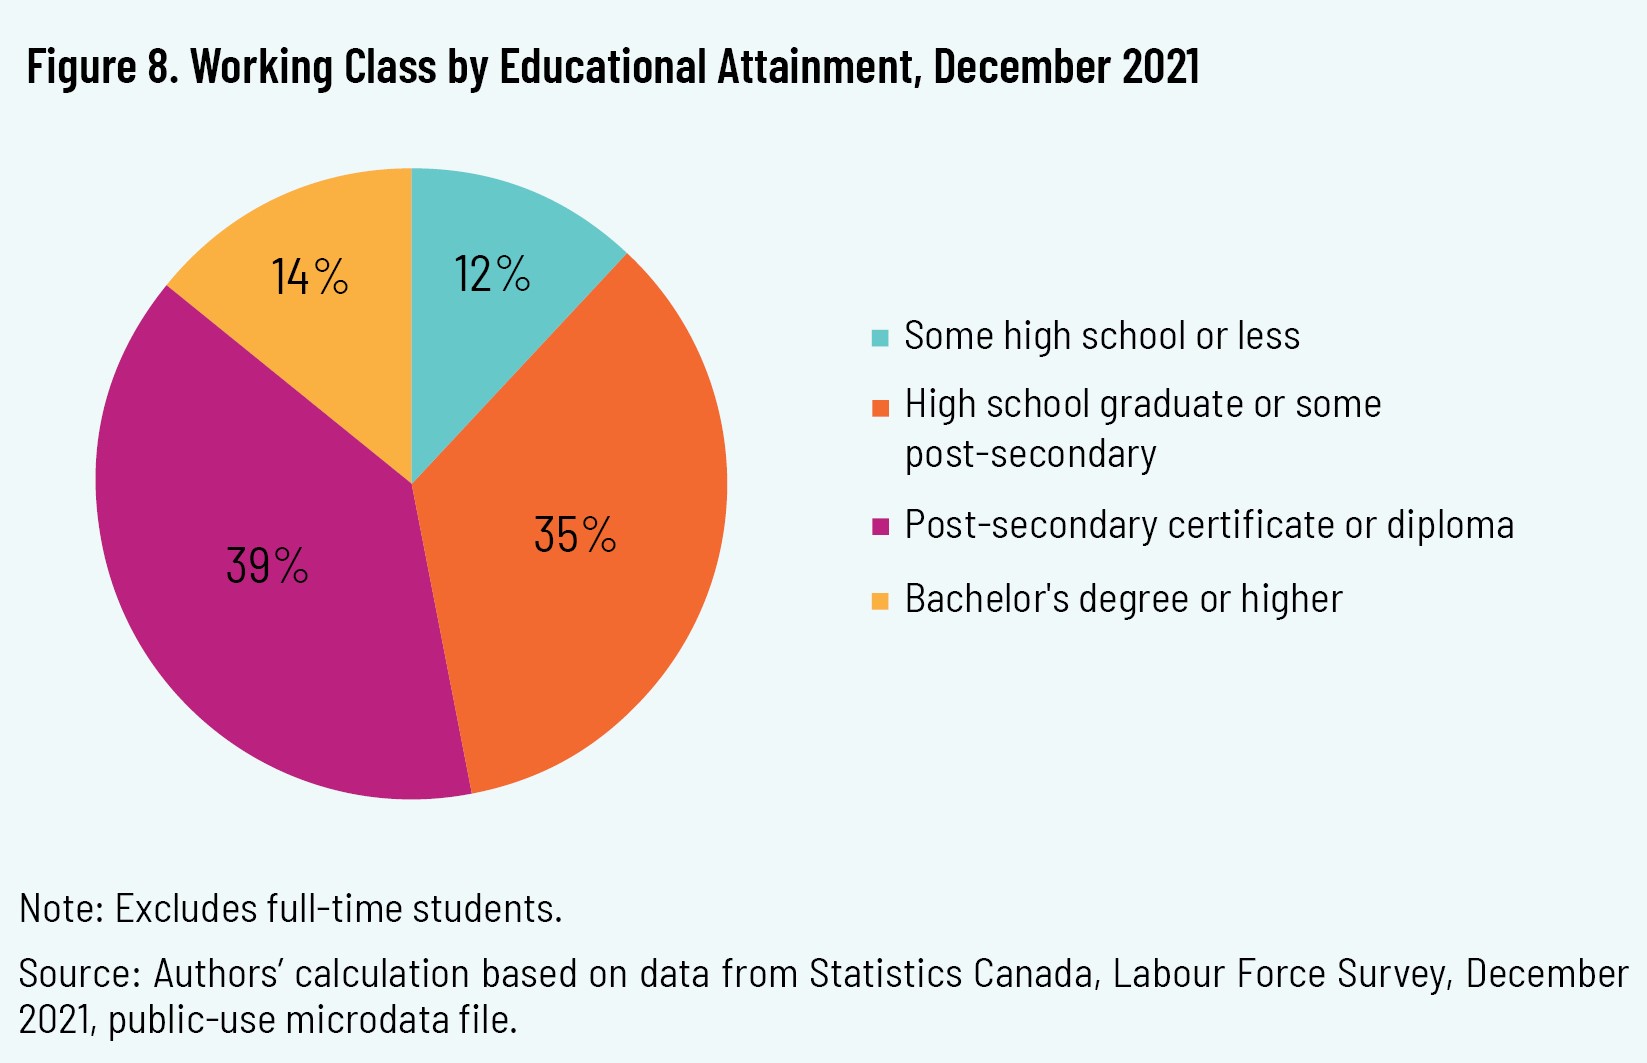
Educational Attainment
We have defined the working class as the population of workers in non-professional and non-management jobs that do not require post-secondary education. Credentialism is necessarily therefore a big part of our understanding of Canada’s modern working class.
Yet this does not mean that the actual educational experiences of the working class match their job requirements. In fact, the Labour Force Survey shows that 53 percent of the working class (excluding current full-time students) actually had post-secondary certificates, diplomas, or degrees beyond what is required for their jobs, including 14 percent with university degrees (see figure 8). For many workers, this can be seen as a huge opportunity cost for them and for Canada’s economy and society.
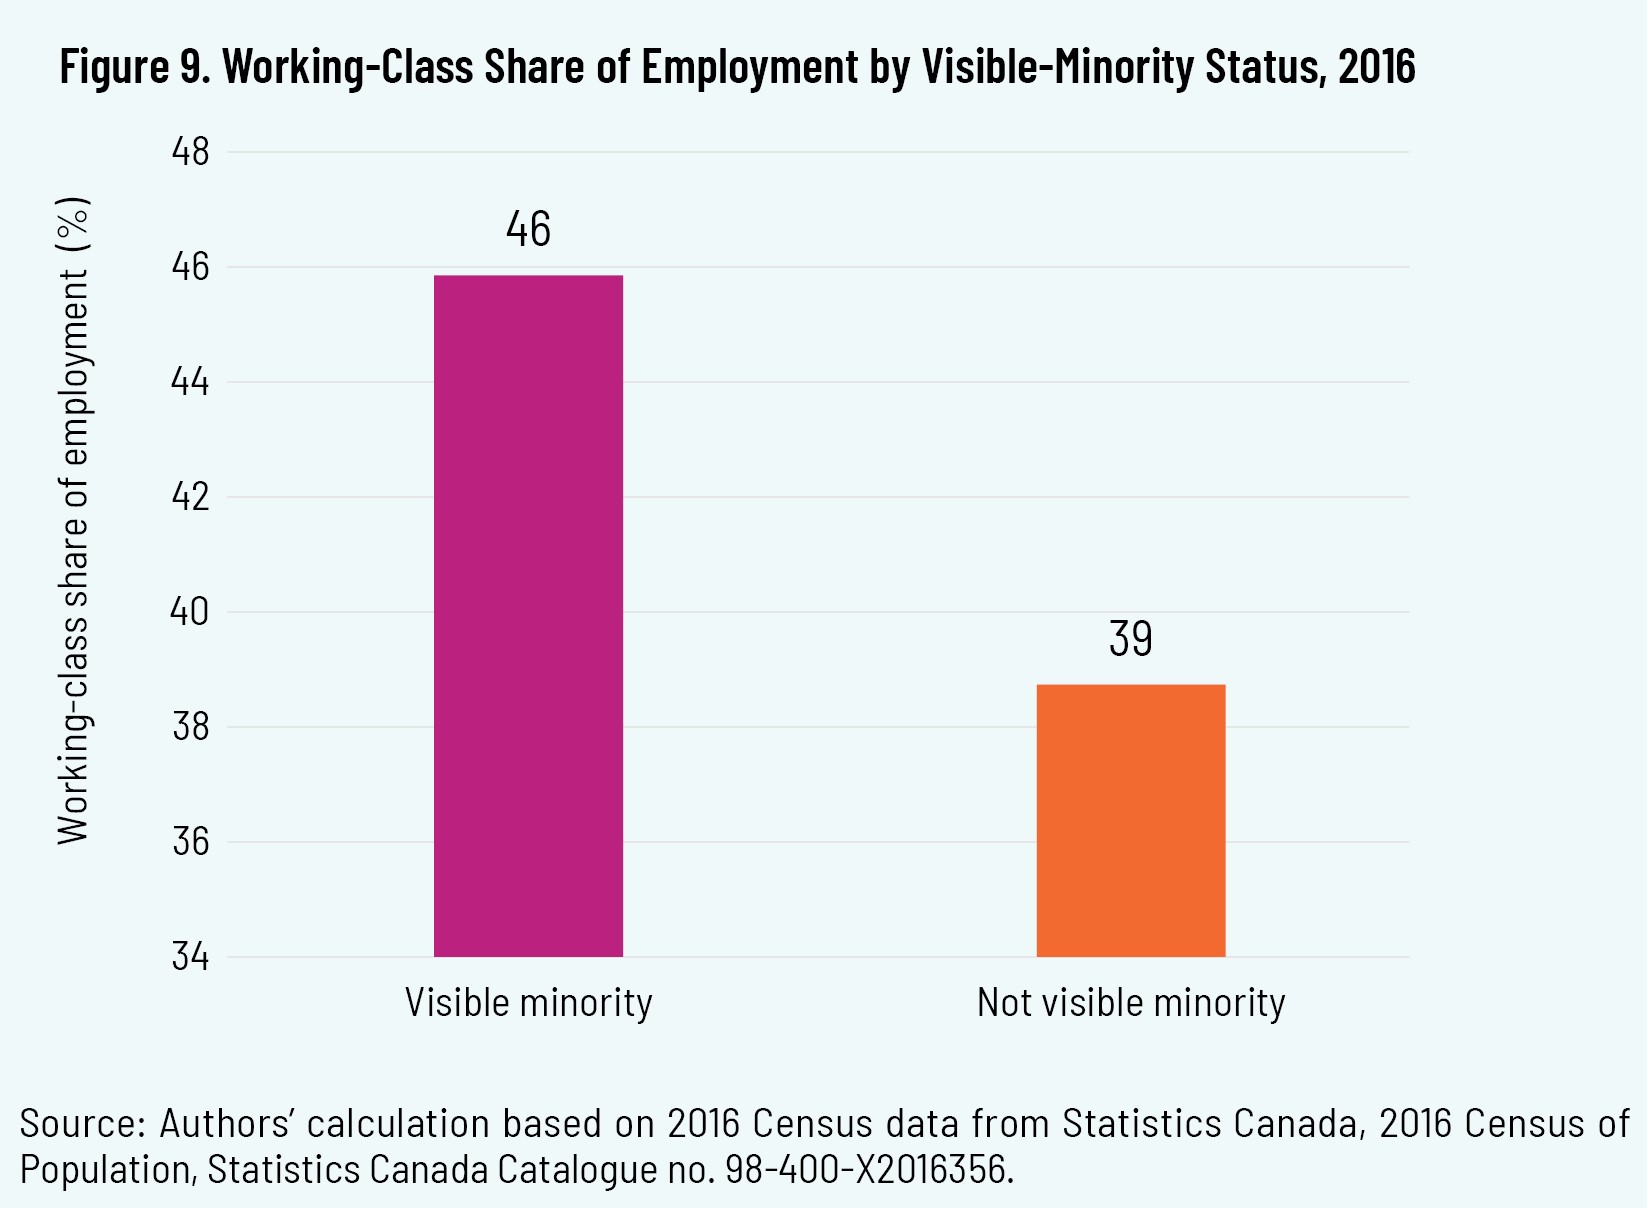
Minority and Immigration Status
Census data suggest that minorities are overrepresented in working-class occupations. In 2016, for instance, almost half of visible-minority workers were employed in working-class occupations, while the corresponding share for those who are not visible minority was only 39 percent (see figure 9).
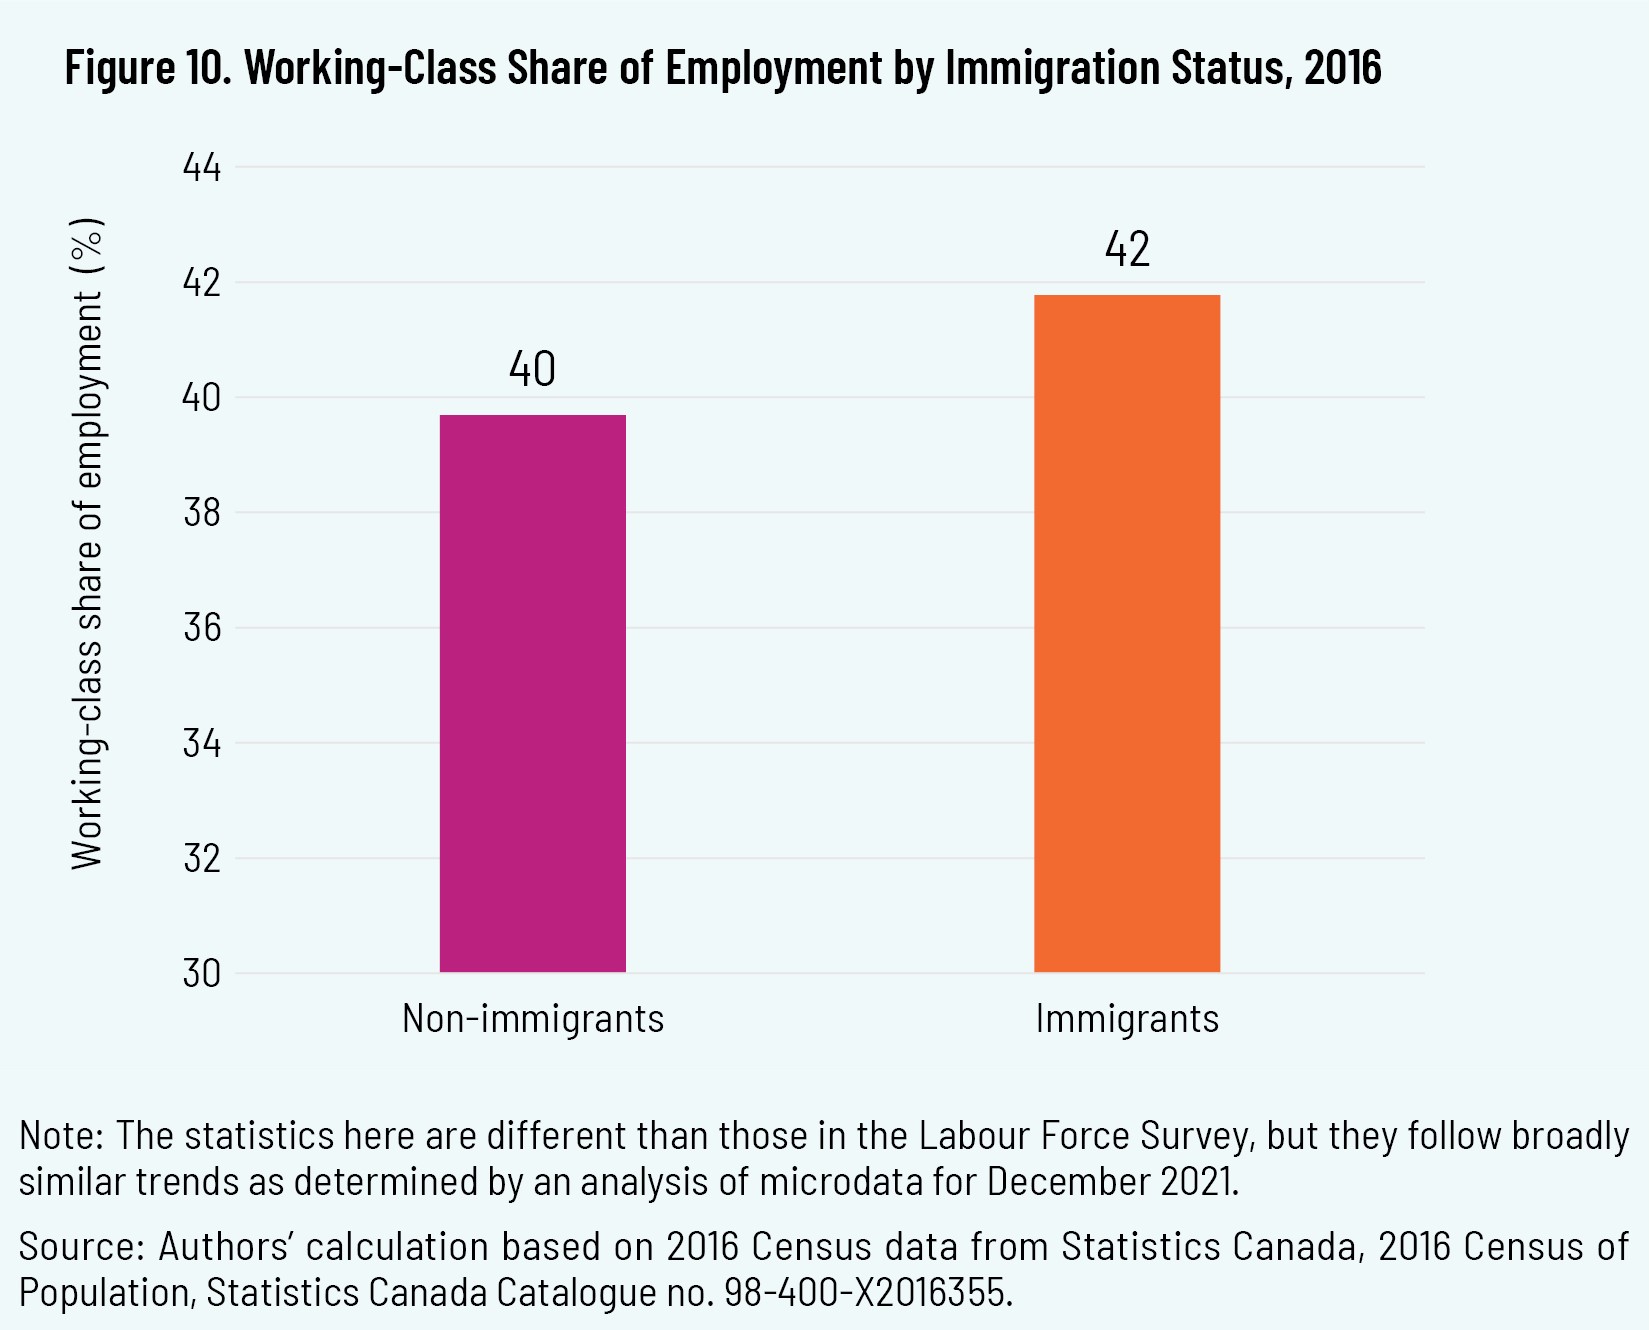
Workers who are immigrants are more likely than non-immigrant workers to be employed in working-class jobs, but the gap is not as large as that experienced by visible minorities. While 40 percent of non-immigrants in the 2016 Census were employed in working-class jobs, a slightly larger proportion (42 percent) of immigrant workers were employed in such jobs (see figure 10).
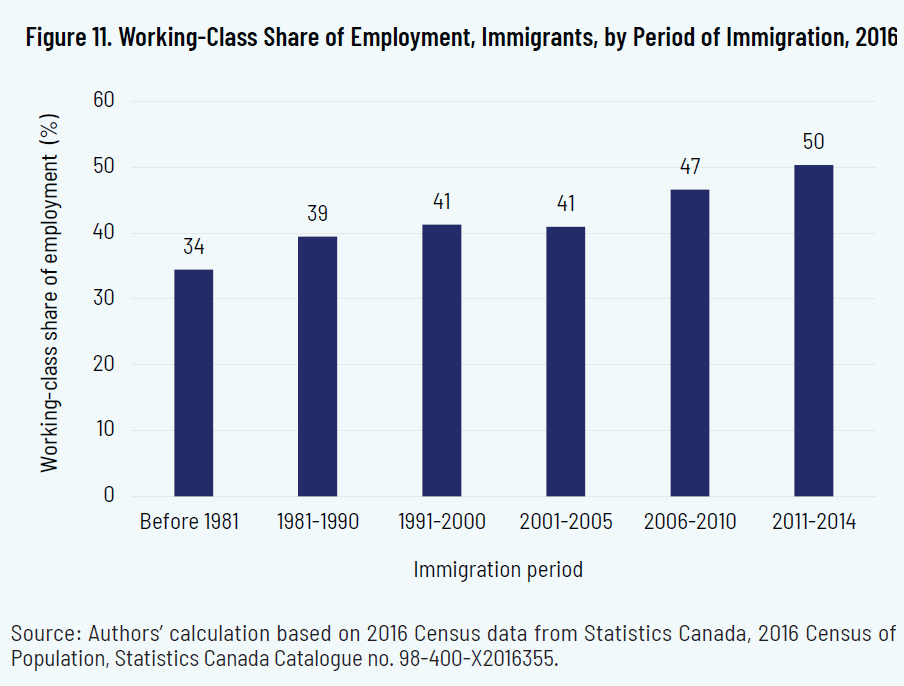
Generally speaking, the longer an immigrant has been in Canada, the less likely he or she is to be in a working-class job. Working immigrants who arrived in Canada in the years immediately prior to the 2016 Census, for instance, were employed in working-class jobs at a rate of more than 50 percent (see figure 11). Yet working immigrants who had arrived in Canada in the 1980s were employed in working-class jobs at a rate of less than 35 percent, which is roughly the national average. Part of this could be explained by the fact that immigrants who have been in Canada longer are more likely to be in later stages of a career, and therefore less likely to be in a working-class job by virtue of age (see above). But it is also likely that immigrants who have been in Canada longer have had more of an opportunity to settle and find jobs that match their skill levels.
There are various factors that may influence the share of visible minorities and recent immigrants in working-class jobs, including Canada’s ongoing failure to draw on the human capital of internationally trained workers. 30 30 J. Medow and O. Sheldrick, “Integrating Newcomers into Ontario’s Economy: A Strategy for Professionally Skilled Immigrant Success,” Ontario 360 (Munk School of Global Affairs and Public Policy), January 30, 2020. https://on360.ca/policy-papers/integrating-newcomers-into-ontarios-economy-a-strategy-for-professionally-skilled-immigrant-success/. Recall that these data are looking at the credentials and skills requirements of working-class occupations held by the working class rather than the skills actually held by the workers themselves. Visible minorities and recent immigrants are likely disproportionately represented in the over half of working-class Canadians who are underemployed—especially since there is evidence that they are more likely to be university educated than non-immigrants. 31 31 Y. Lu and F. Hou, “Over-education Among University-educated Immigrants in Canada and the United States,” Statistics Canada, December 3, 2019. https://www150.statcan.gc.ca/n1/pub/11f0019m/11f0019m2019022-eng.htm.
How Has Canada’s Working Class Changed?
We saw in the previous section that the proportion of Canada’s working class declined from 42 percent in 2000 to 39 percent in 2010 and to 34 percent in 2021. This downward trend occurred alongside significant rises in high-skilled occupations along the same horizon. 32 32 Speer and Bezu, “Job Polarization in Canada.”
There have also been significant changes within the working class itself. This section examines trends within Canada’s working class, including evolving gender dynamics, as well as the main occupations that constitute the modern working class.
Gender Dynamics
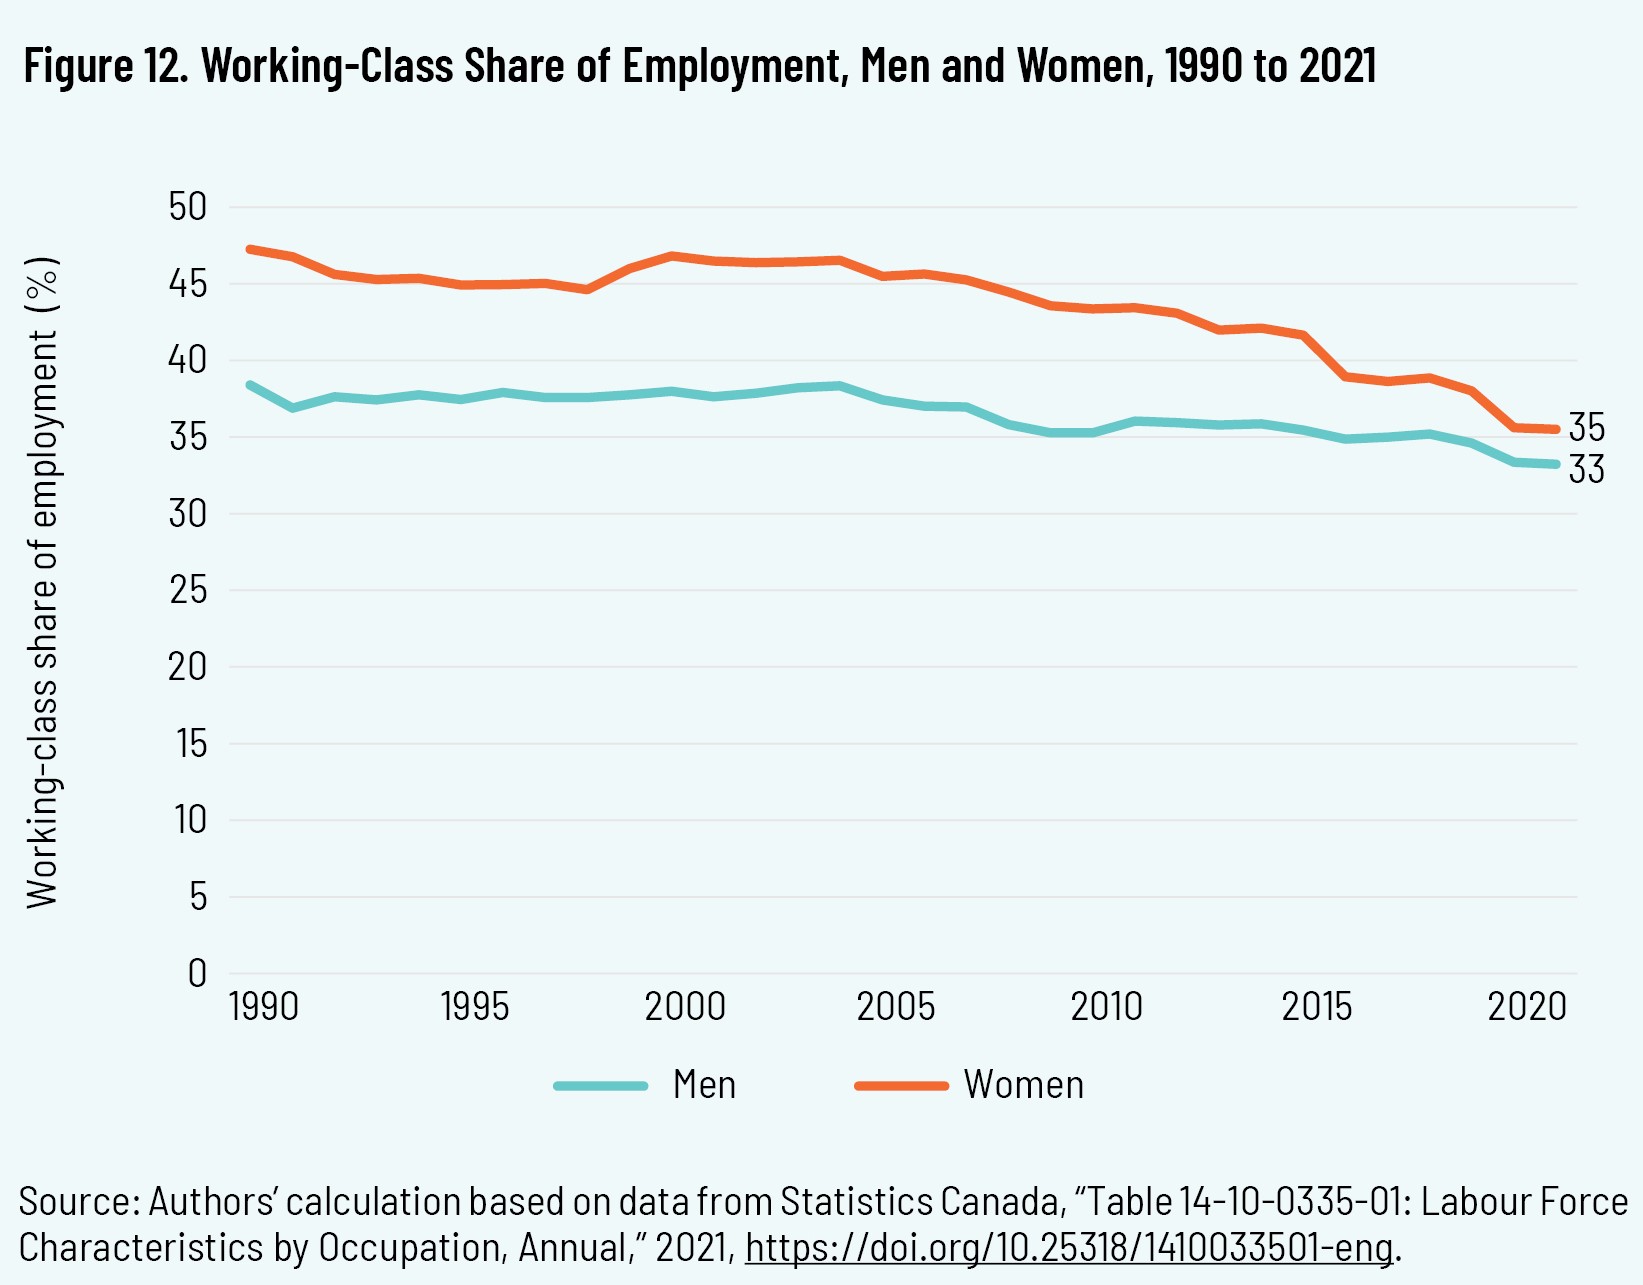
A closer look at the trend-line differences between men and women reveals a significant change over time. Specifically, while the proportion of working-class occupations has declined in overall terms over the past three decades, the decline as a share of their overall employment by gender has been particularly pronounced among women, declining from 47 percent in 1990 to 35 percent in 2021 (see figure 12). The decline among men, by contrast, has been comparatively modest, falling from 38 percent in 1990 to 33 percent in 2021.
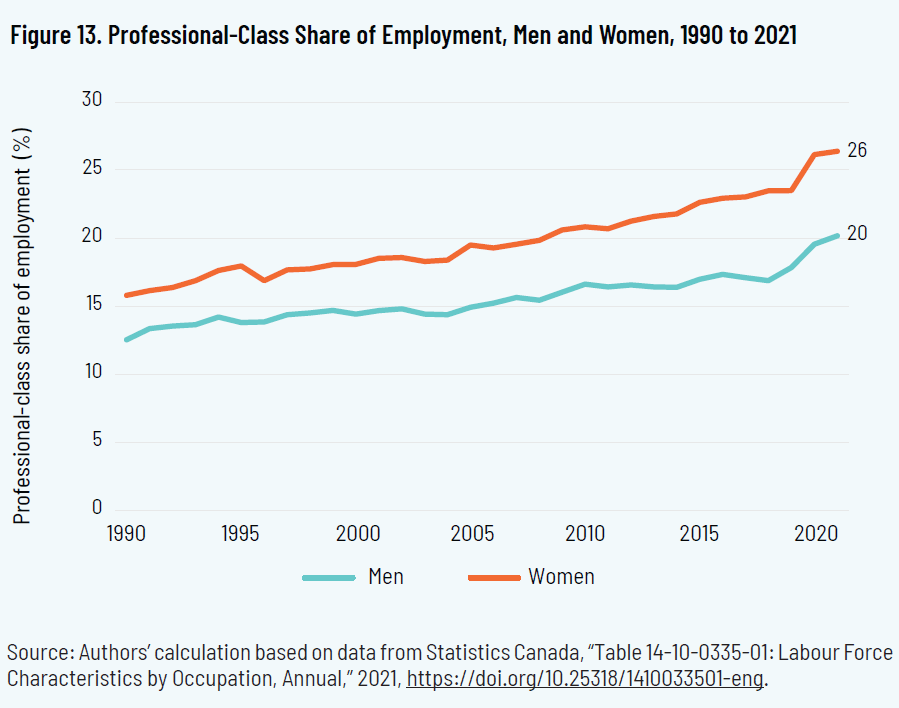
Similarly, the rise in the professional occupations is starker among women than it is among men, though both have experienced a large increase over the past thirty years as we have experienced a shift from a goods-producing economy to a service-based economy. In 1990, the proportion of working women in professional occupations was about 16 percent, compared to about 13 percent for men. By 2021, these figures had risen to 26 percent and 20 percent, respectively (see figure 13). These findings are consistent with our previous work on job polarization, which showed considerable growth in the share of women in high-skilled occupations over the past two decades or so. 33 33 Speer and Bezu, “Job Polarization in Canada.”
In terms of the working class itself, the ratio of men and women has fluctuated over time. The working class was within a percentage point of gender parity throughout the 1990s. From 2000 until 2016, however, women have represented a slight majority of working-class workers (see figure 14). In 2020, men formed a noticeable majority of the working class. The narrowing of the gap in 2021 suggests that this is likely a contingent development due to the pandemic. Analysis, for instance, suggests women were disproportionately affected by pandemic-induced employment losses. 34 34 S. Speer, “Did We Really Experience a ‘She-cession’? The Answer Is Complicated,” The Hub, August 19, 2021, https://thehub.ca/2021-08-19/policy-pulse-day-5/.
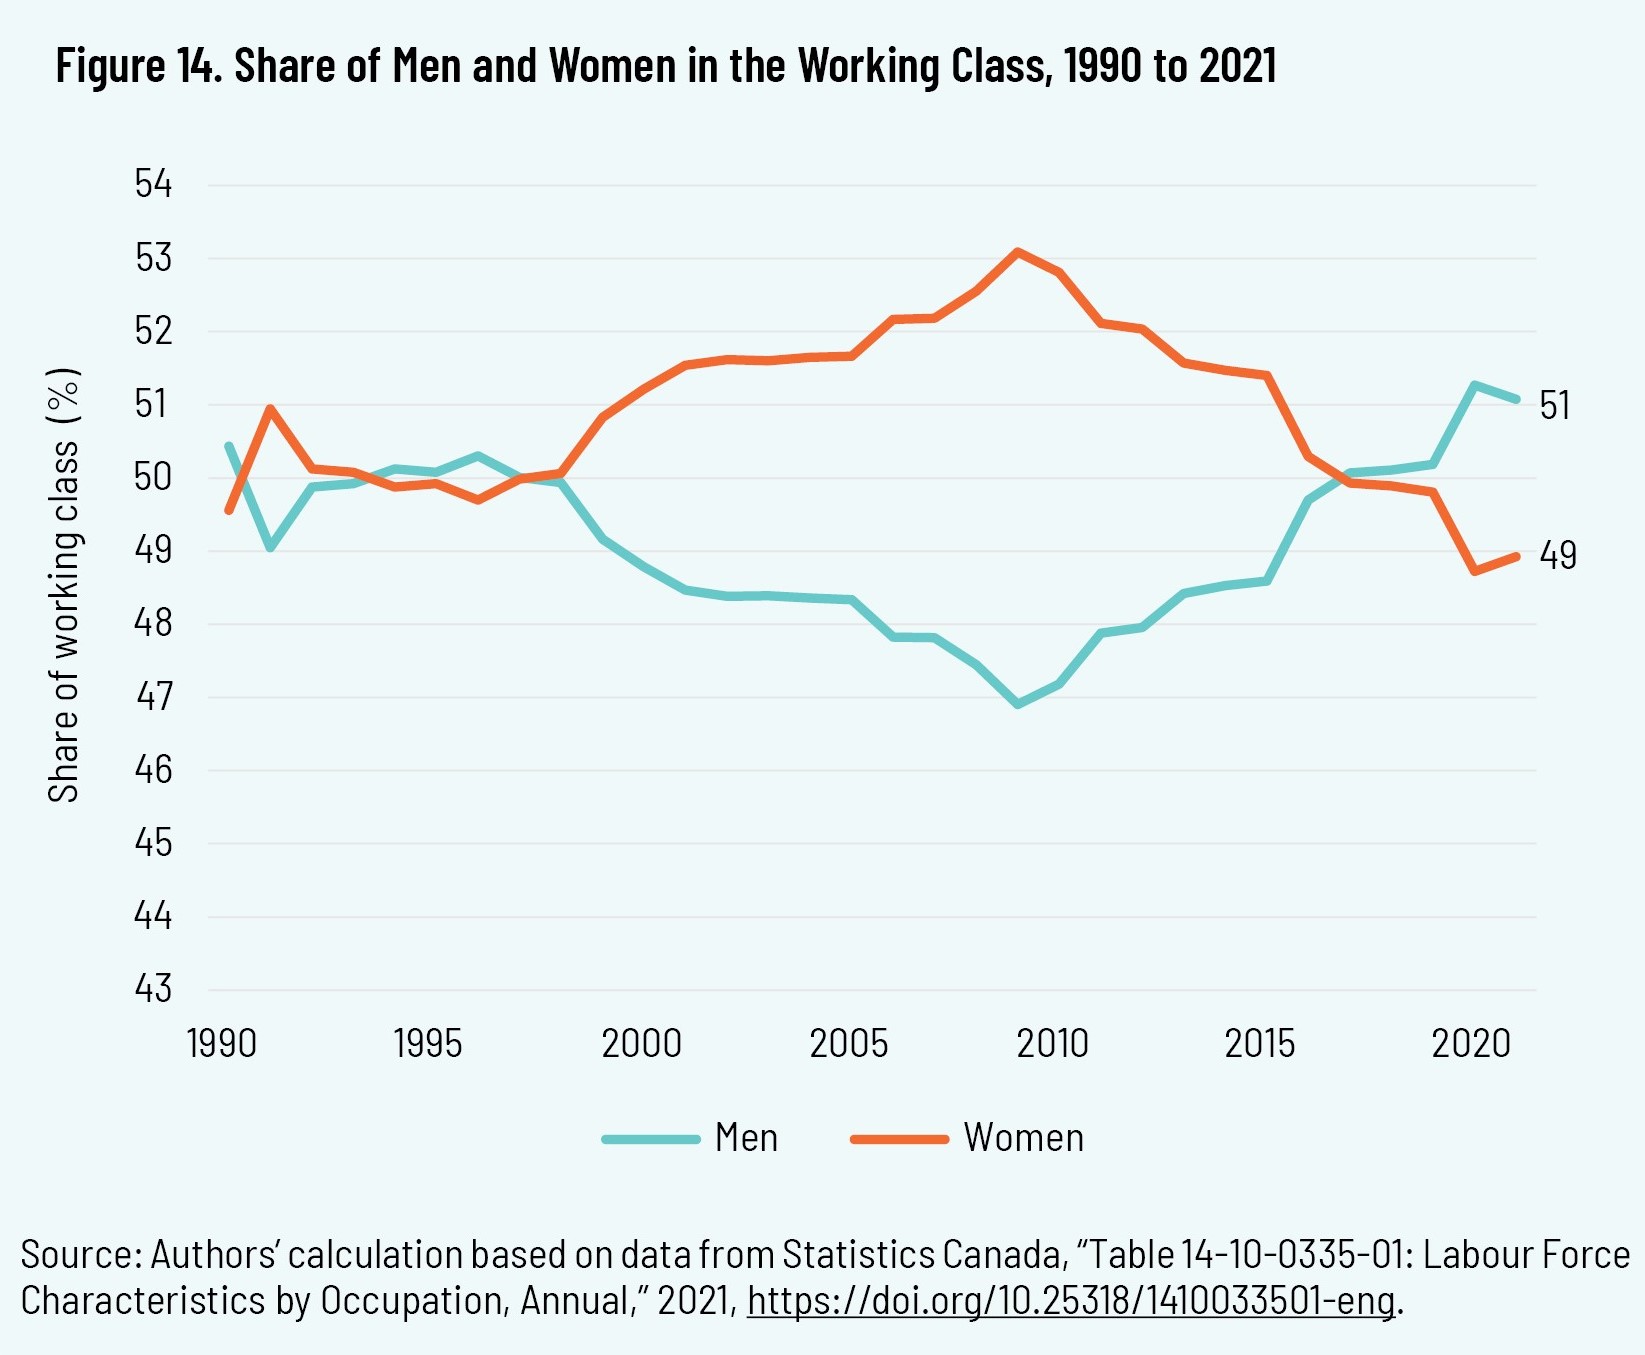
This is a key point: it tells us that the common conception of the working class as mainly composed of blue-collar workers in male-dominated sectors such as manufacturing and natural-resource development has not been accurate for at least the last thirty years. Even in 1990 working women represented close to half of those in working-class occupations. By the 2000s, women represented as much as 53 percent of Canada’s working-class population.
Although the working class is often associated with the manufacturing sector, manufacturing jobs accounted for less than one-fifth of working-class employment among men even in the 1990s. After 2005, the employment share of manufacturing and utilities fell significantly among working-class male workers, from 20 percent to under 15 percent, representing a decline of more than one-quarter.
While sales and service occupations have represented the greatest proportion of working-class jobs among men since at least the 1990s, they have only grown in dominance over the subsequent thirty years. They rose from 32 percent in 1990 to over 40 percent by 2019, with a sharper increase after 2005 and a slight decline in 2020 due ostensibly to the pandemic (see figure 15). The share of male employment in the trades, transport, and equipment operations occupational group remained fairly stable in the 1990s and experienced modest growth in the 2000s.
Sales and service occupations have also dominated the female working class for at least the last three decades. The share of working-class women in sales and service jobs steadily increased over this period and now exceeds half. The exception was 2020, when these occupations were hit hard by the lockdown measures during the COVID-19 pandemic (see figure 16).
In the 1990s, more than one-quarter of working-class women were engaged in business, finance, and administration occupations. The share has since declined steadily, reaching as low as 19 percent in 2019. Only 10 percent of working-class
women were engaged in occupations in the manufacturing and utilities sectors in the 1990s and early 2000s. The share further declined beginning in 2005, similar to the male working-class population.
These data suggest that, while our conception of the working class as dominated by blue-collar men in the manufacturing sector has not been correct for years, it is even more out of date in the 2020s than it was in the 1990s. Service-sector jobs have
been dominant for a long time—and increasingly so—among working-class workers in Canada.
How Has Canada’s Working Class Performed?
The previous sections have established who constitutes Canada’s working class, where they live, how much education they have, and what jobs they do, as well as how these trends have evolved over time. This section aims to understand their economic and social outcomes.
Average Wages and Wage Distribution
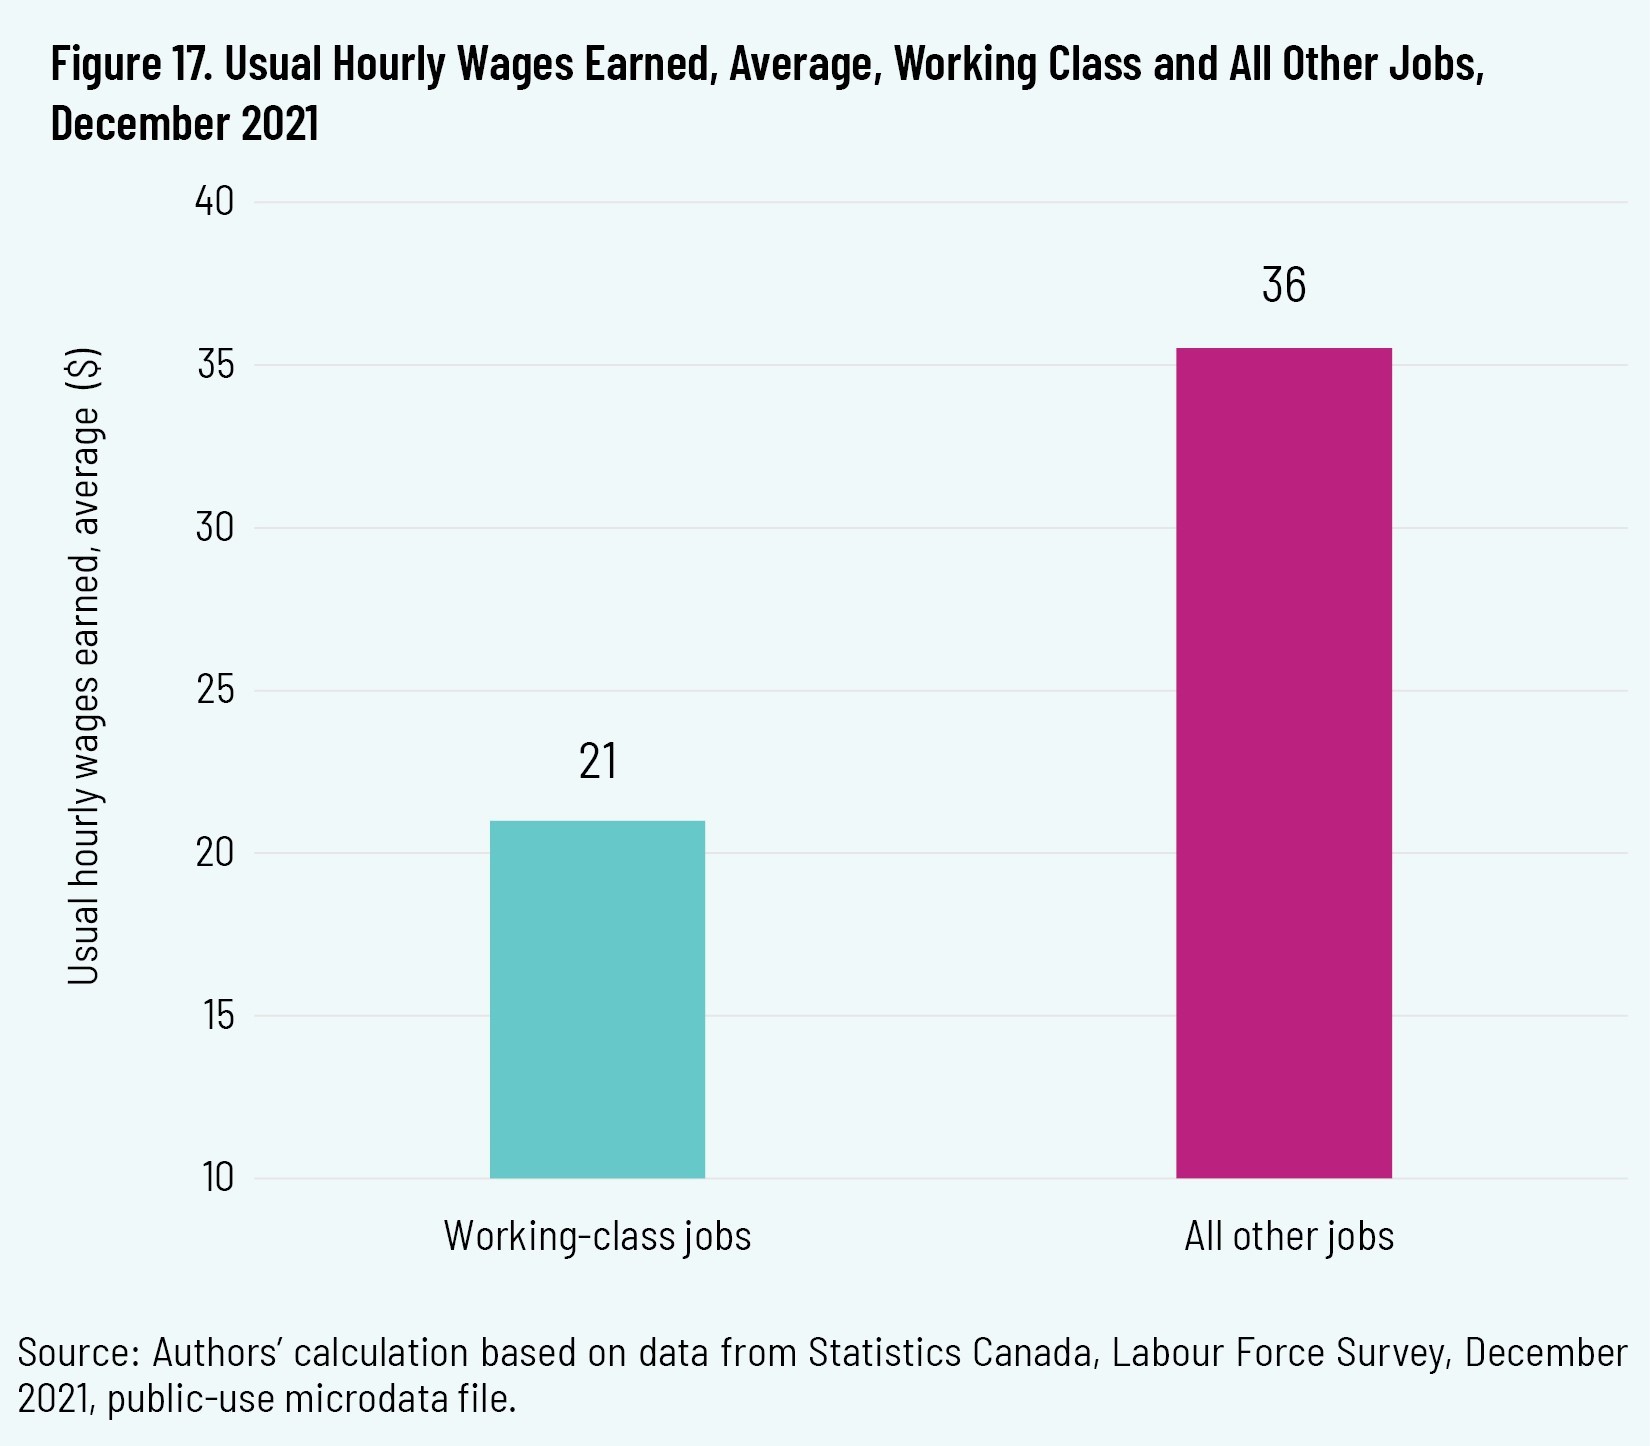
Working-class Canadians earn lower wages than workers in higher-skilled and professional occupations (see figure 17). The average hourly wage for working-class jobs ($21 per hour) is 41 percent lower than the average earned in non-working-class
occupations ($36 per hour).
Yet these data do not even tell the full story. Average hourly rates obscure the differences in total wages and earnings between workers in working-class jobs and those in other occupations, due to various factors including the incidence of part-time work or “gig work” in working-class occupations. 35 35 They also do not account for non-wage benefits such as pensions, health and dental benefits, and job security. Disaggregating weekly wages among these two groups enables us to see the share of workers that earns less than $500 per week, between $500 and $799, $800 to $1,199, and $1,200 or more per week. Figure 18 shows the earning distribution for weekly wages for December 2021.
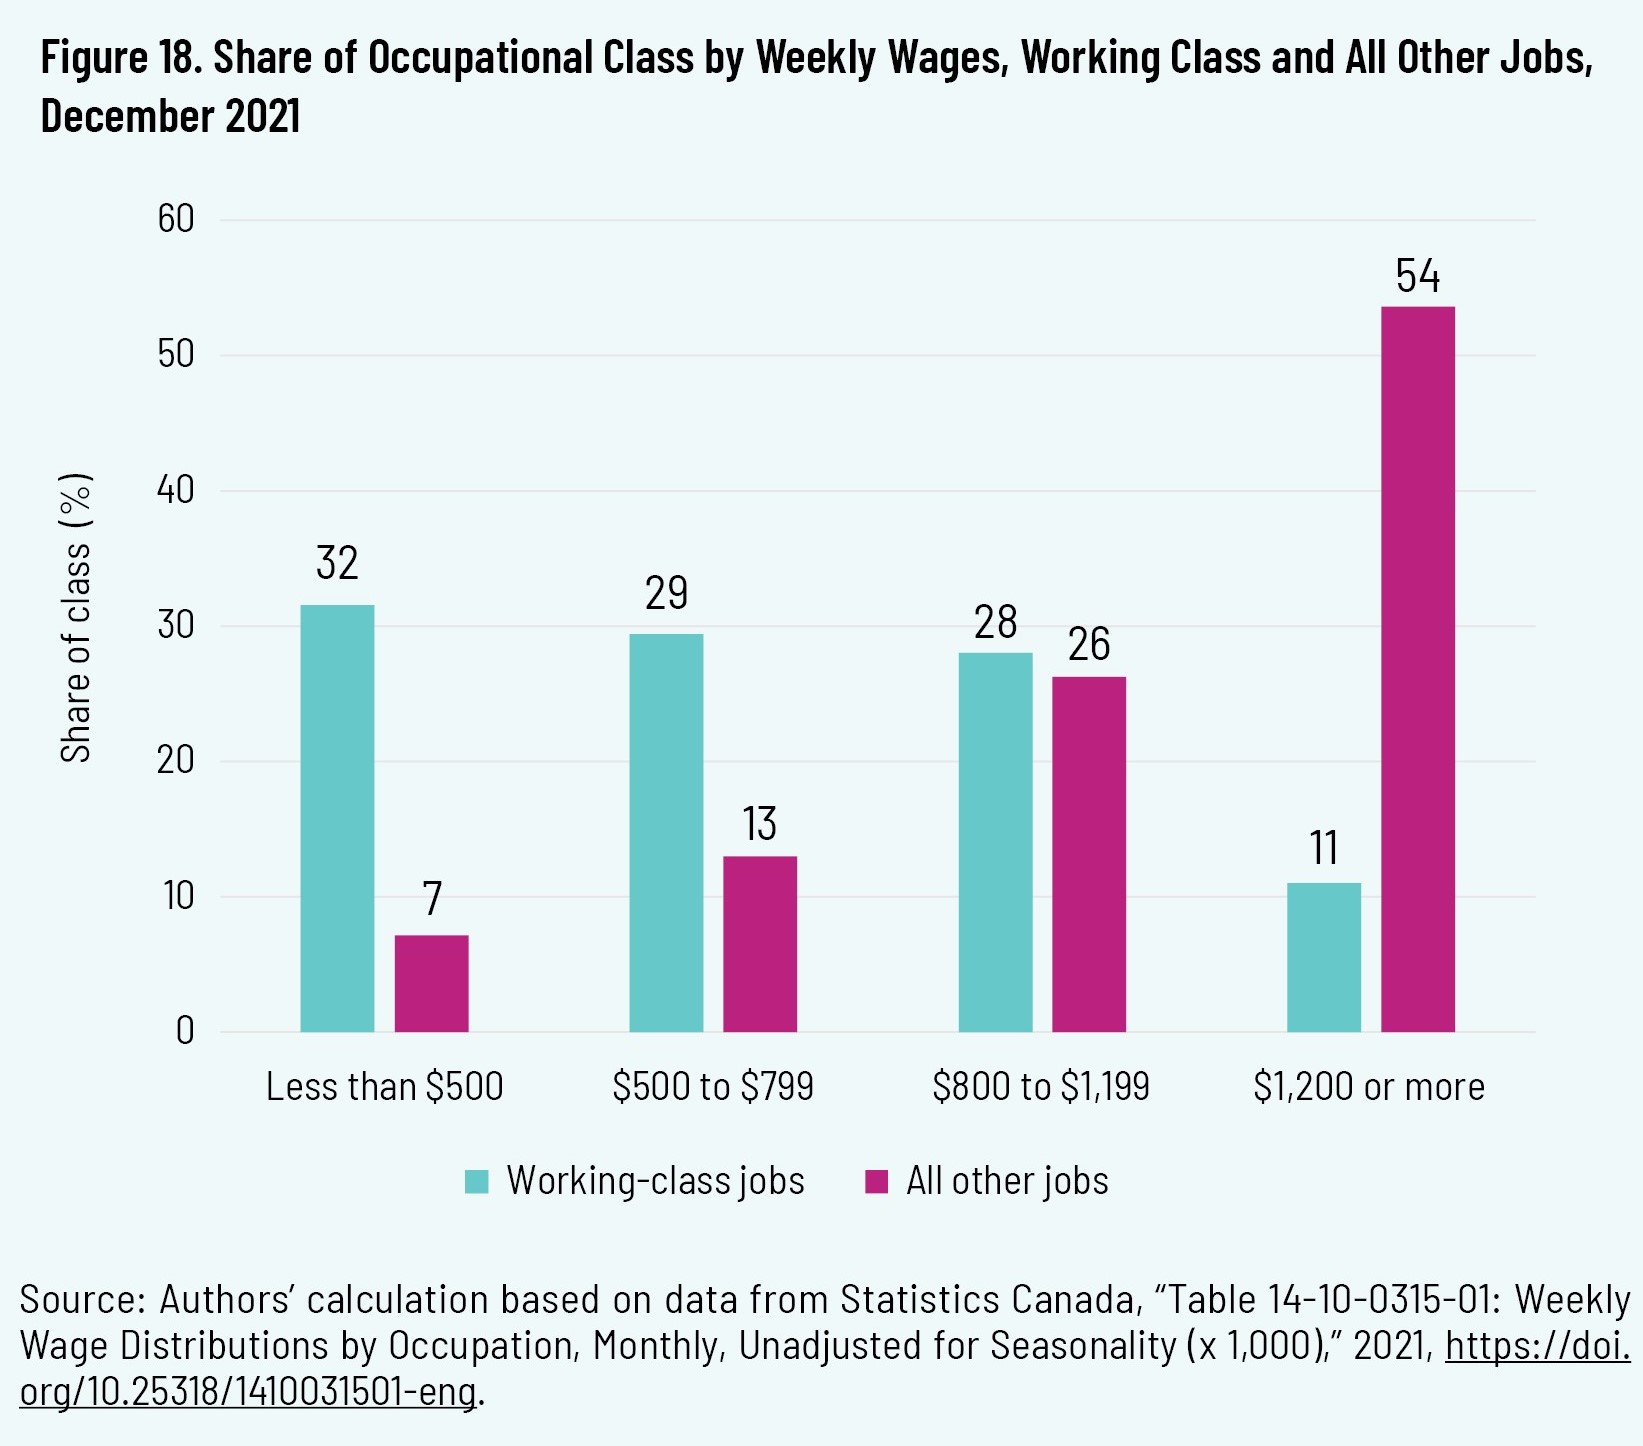
In that month, 61 percent of employees in working-class jobs were paid less than $800 per week, while only 20 percent of workers in non-working-class occupations earned less than $800. More than half of workers in other occupations earned $1,200 or more per week compared to only 11 percent of working-class Canadians.
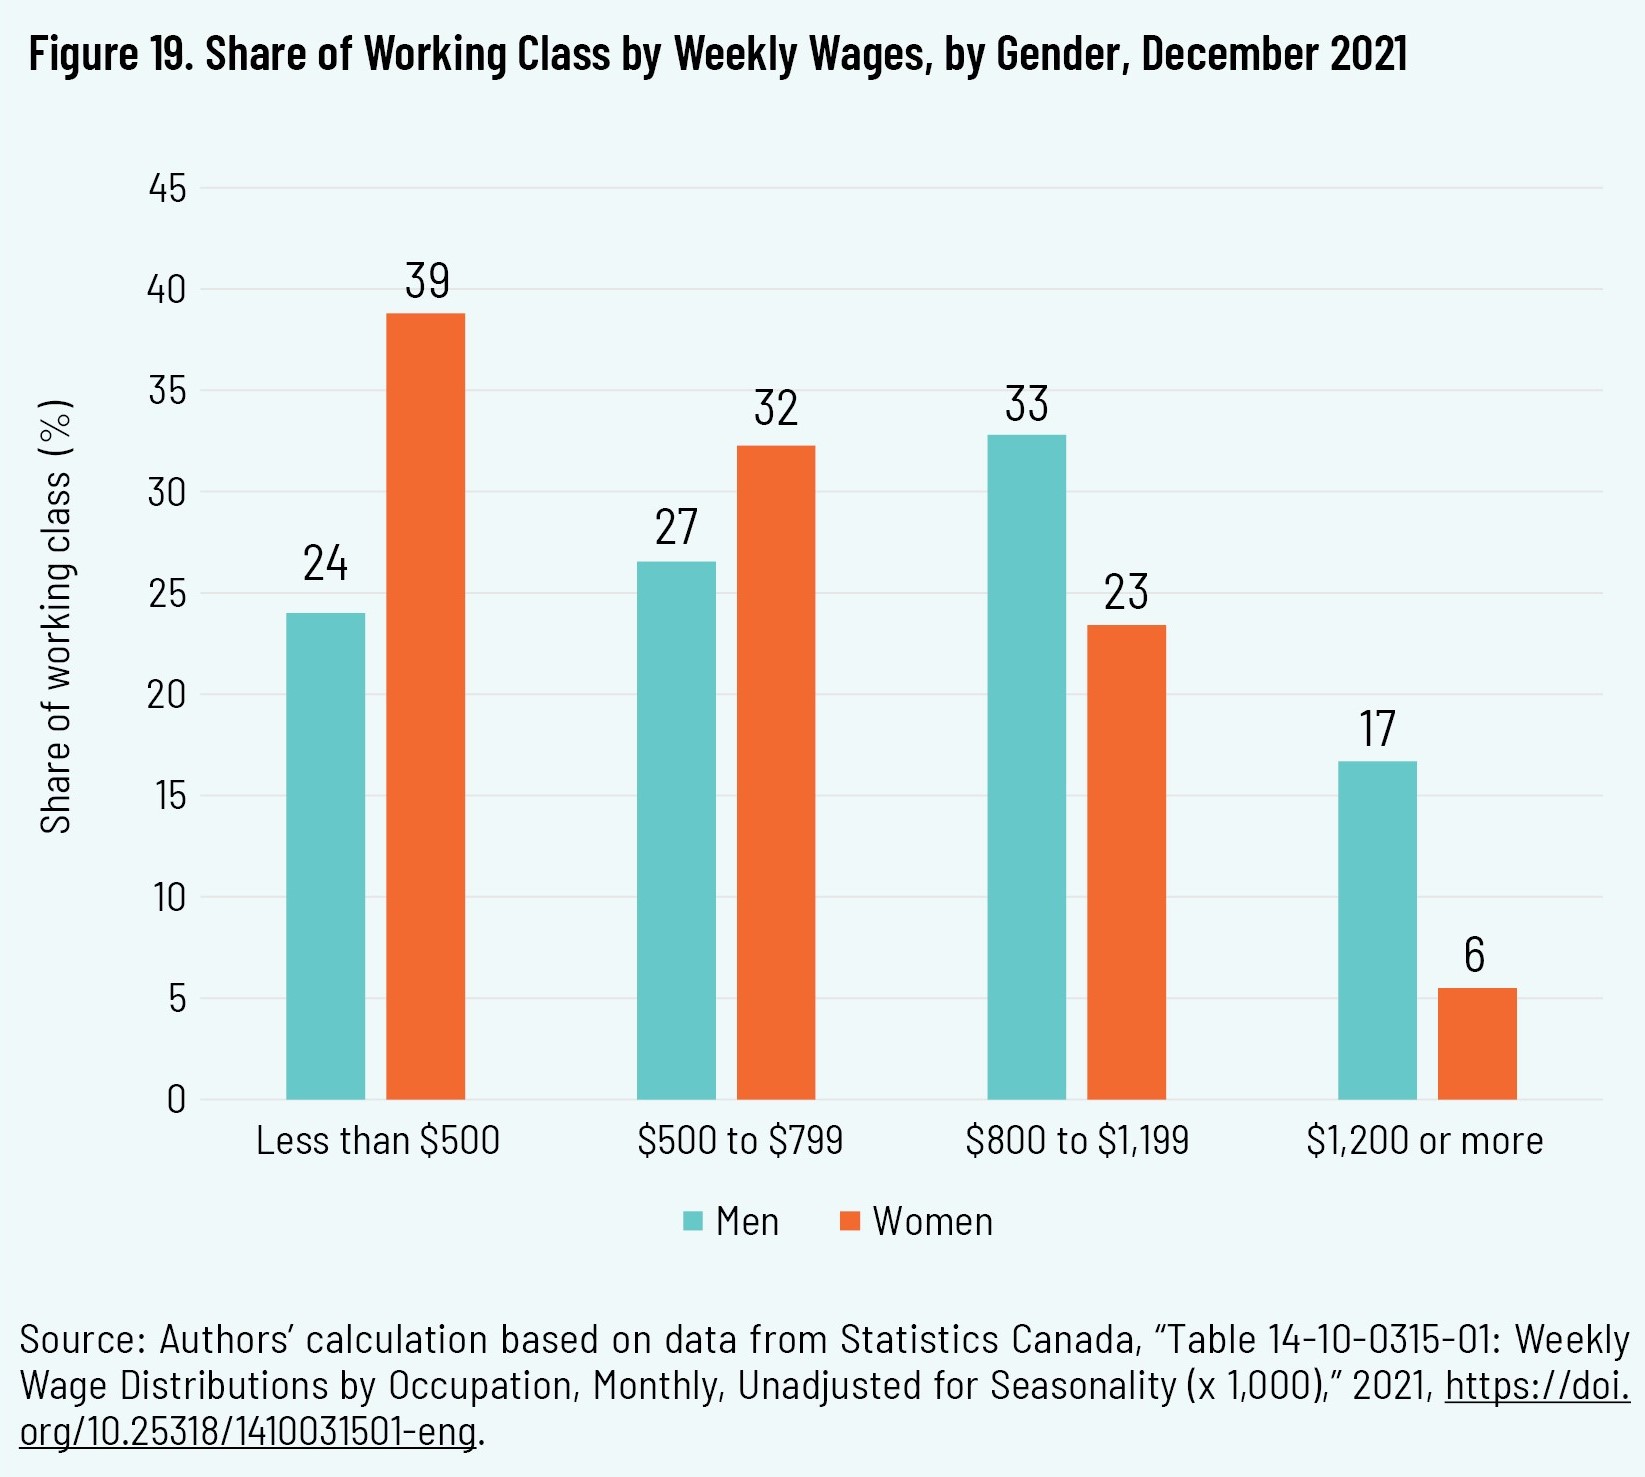
Within the working class itself, we also find differences in earnings between men and women. Roughly four out of ten working-class women earned less than $500 per week, compared to less than one-quarter of working-class men. At the other end of the wage distribution, 17 percent of working-class men earned more than $1,200 per week, while only 6 percent of working-class women earned as much (see figure 19).
Annual Employment Income Distribution
We see a similar effect when we look at the distribution of annual employment income among working-class men and women as well as those in other higher-skilled and professional occupations.
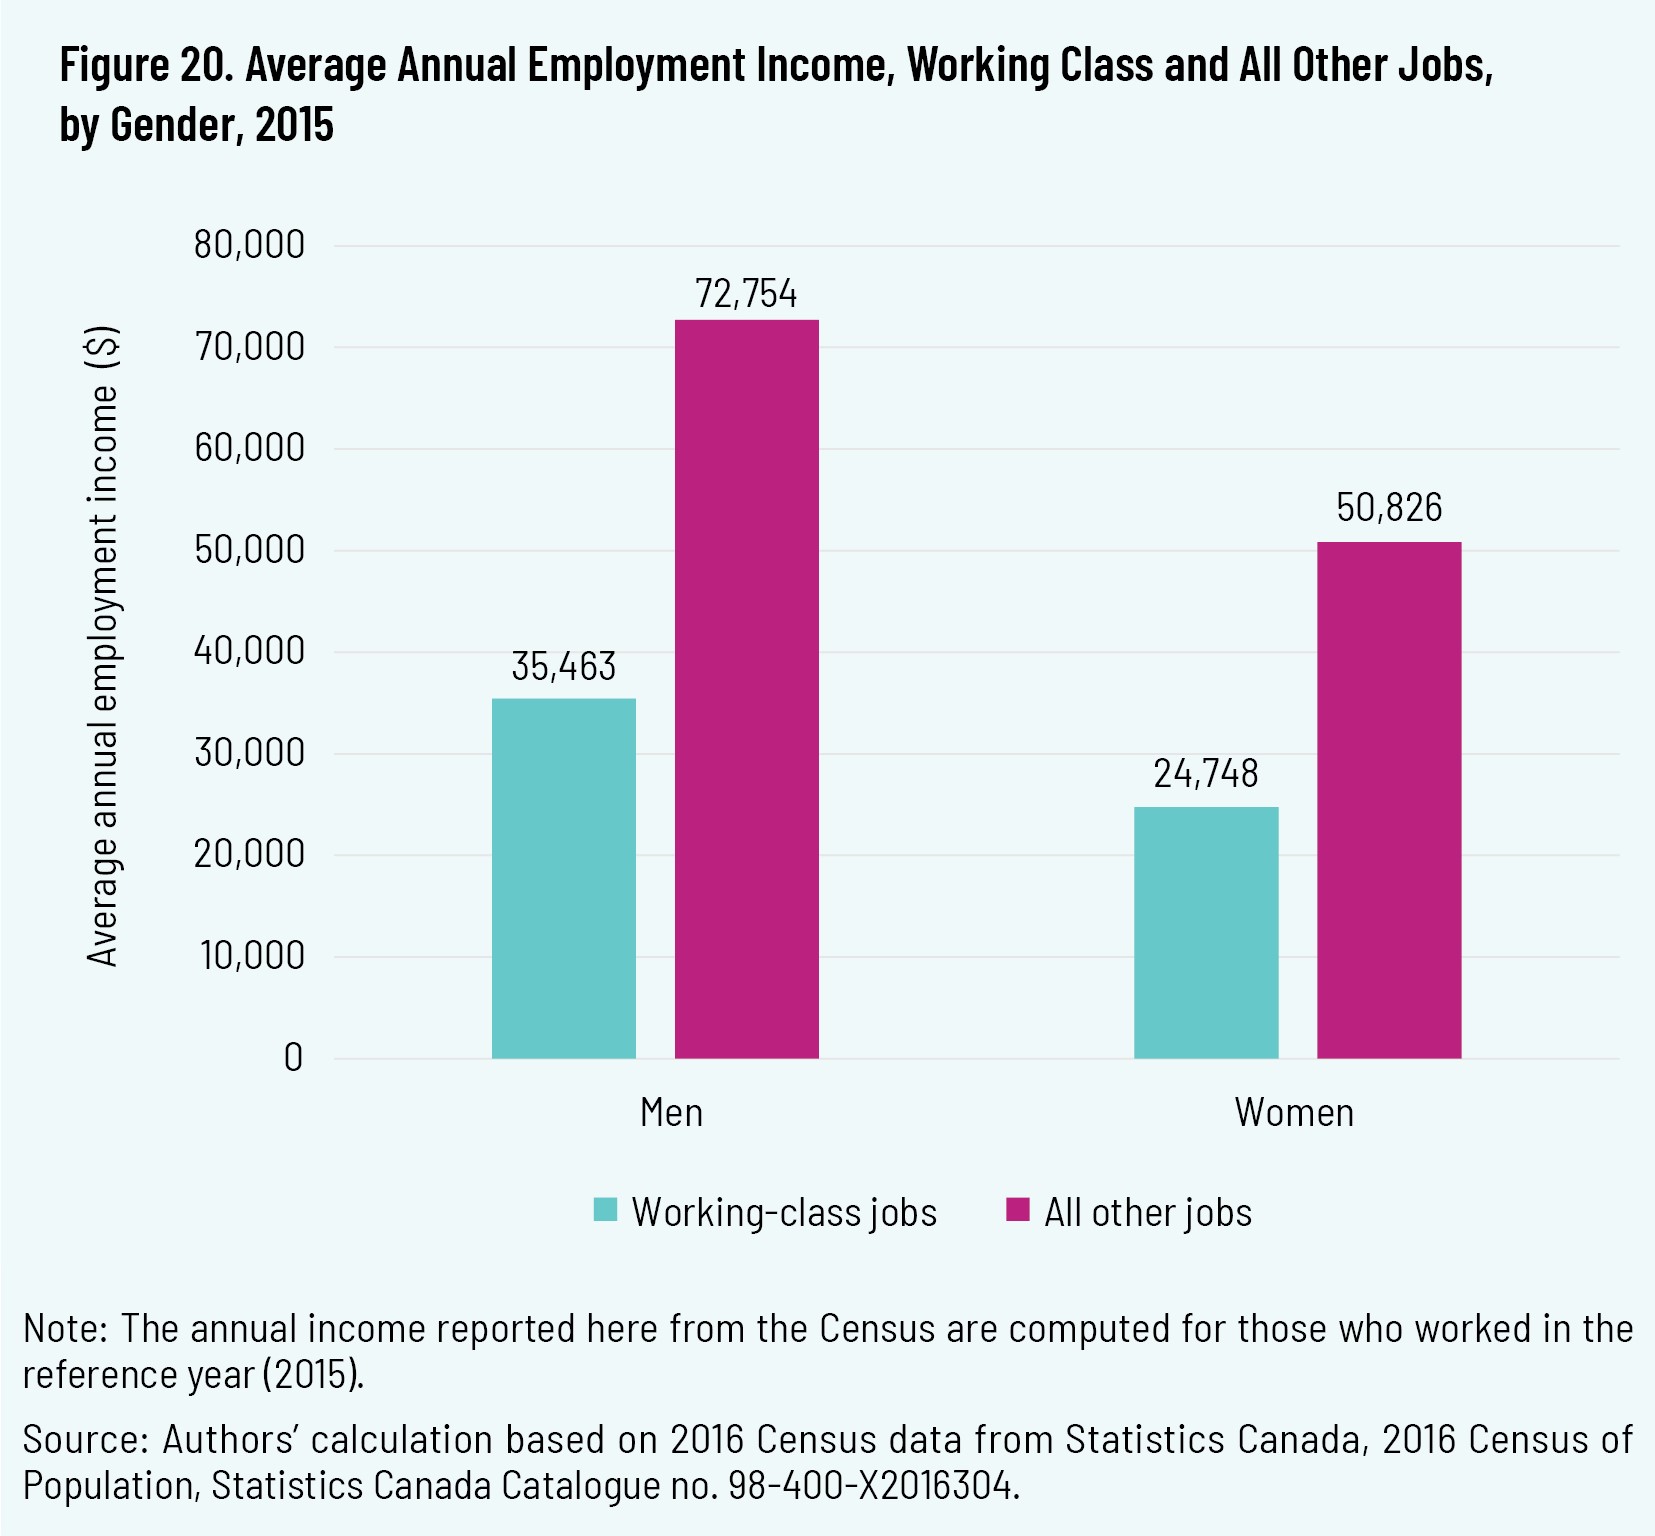
Female workers employed in working-class jobs earned $24,748 on average, which is 51 percent lower than the annual employment earnings of female workers in nonworking-class occupations. Similarly, male workers in working-class jobs earned 51 percent less than male workers in other occupations (see figure 20).
The annual earning differences between men and women working in working-class jobs is not as large as between working-class Canadians and their non-working-class peers, but they are still significant. At $24,748 per year, employment income for
working-class women is 30 percent lower than the $35,463 per year earned by male members of the working class.
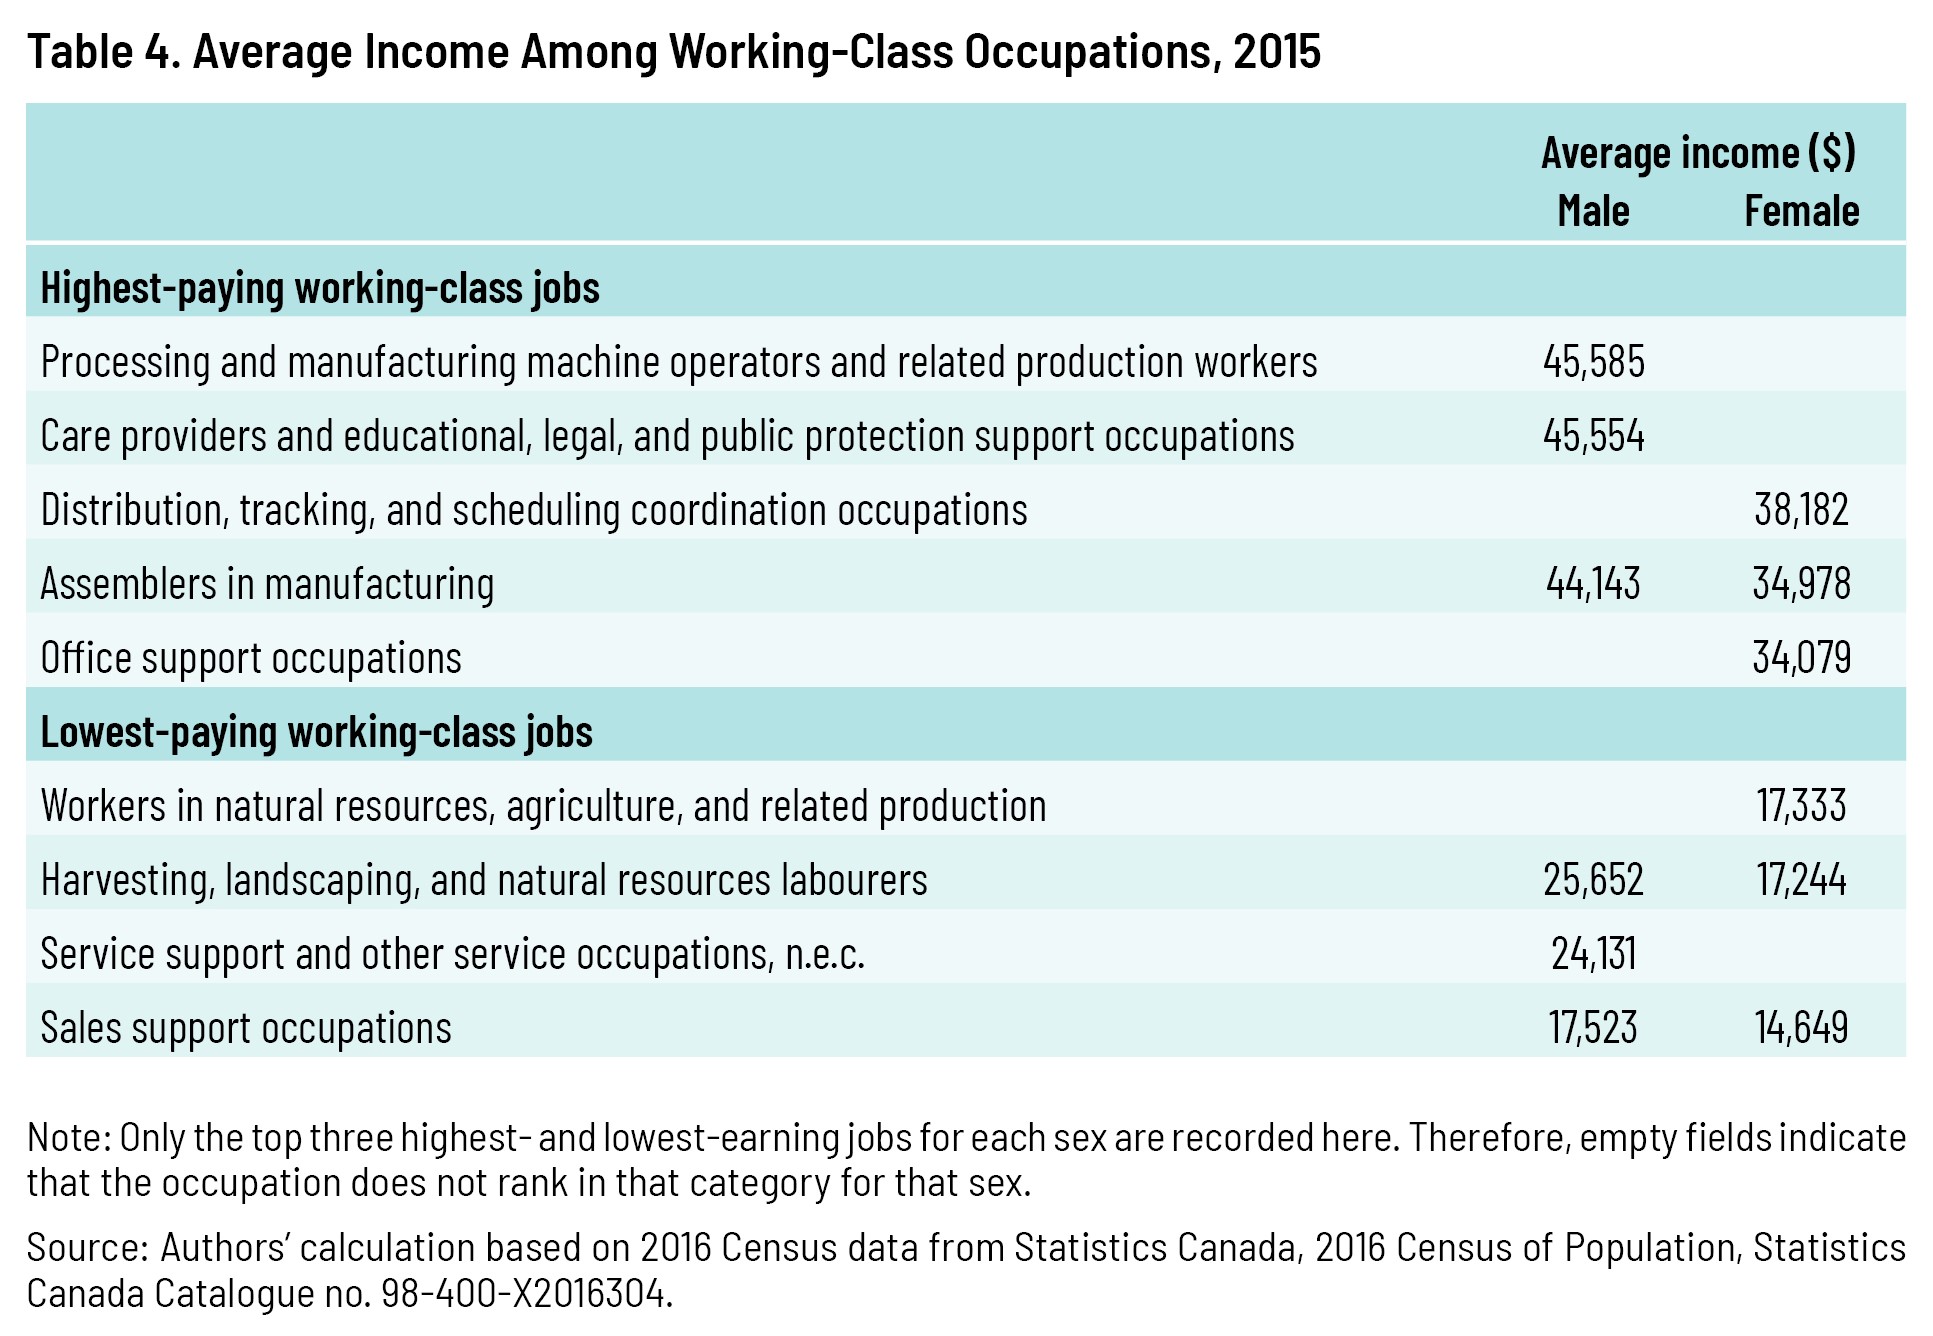
Average annual incomes vary quite widely within the working class when we compare different occupations between the sexes. Table 4 identifies the highest- and lowest- paying jobs among the working-class occupations according to the 2016 Census.
Among both men and women, the lowest-paying working-class jobs are in sales support, earning less than $18,000 per year on average. At the other end of the spectrum, the highest-paying working-class jobs for men, which are found in manufacturing, provide average incomes of over $45,000, while those for women, which are in administrative and scheduling roles, provide average incomes of just over $38,000.
The large differences in earnings between working-class jobs and other occupations can perhaps be explained by a number of factors. First and foremost, the lower hourly wage rate is an obvious factor. A 42 percent gap is significant.
Another possible factor is that the working class may disproportionately comprise workers in part-time roles. Data from the December 2021 Labour Force Survey, for instance, show that 30 percent of employees in working-class jobs were working part time, while the share of part-time workers in other occupations was significantly lower (13 percent).
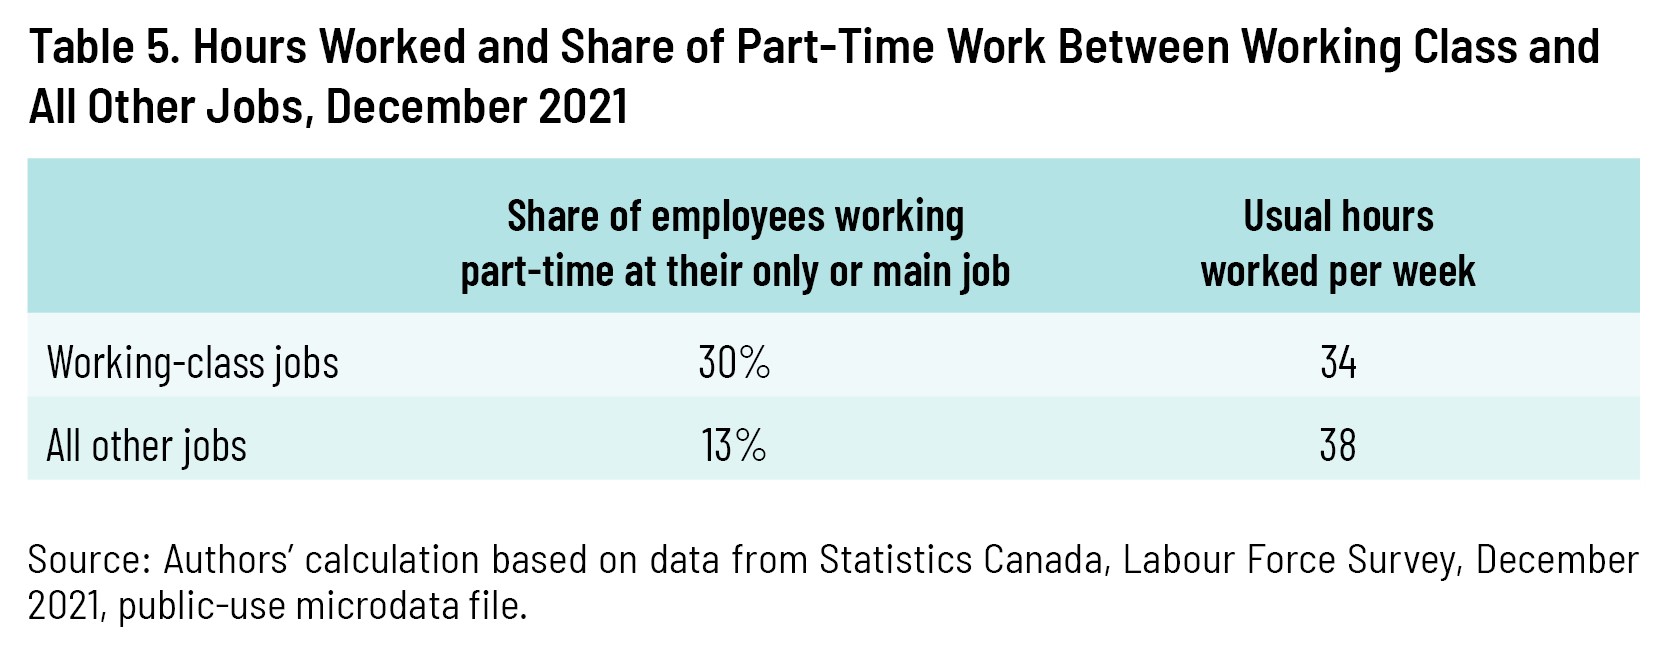
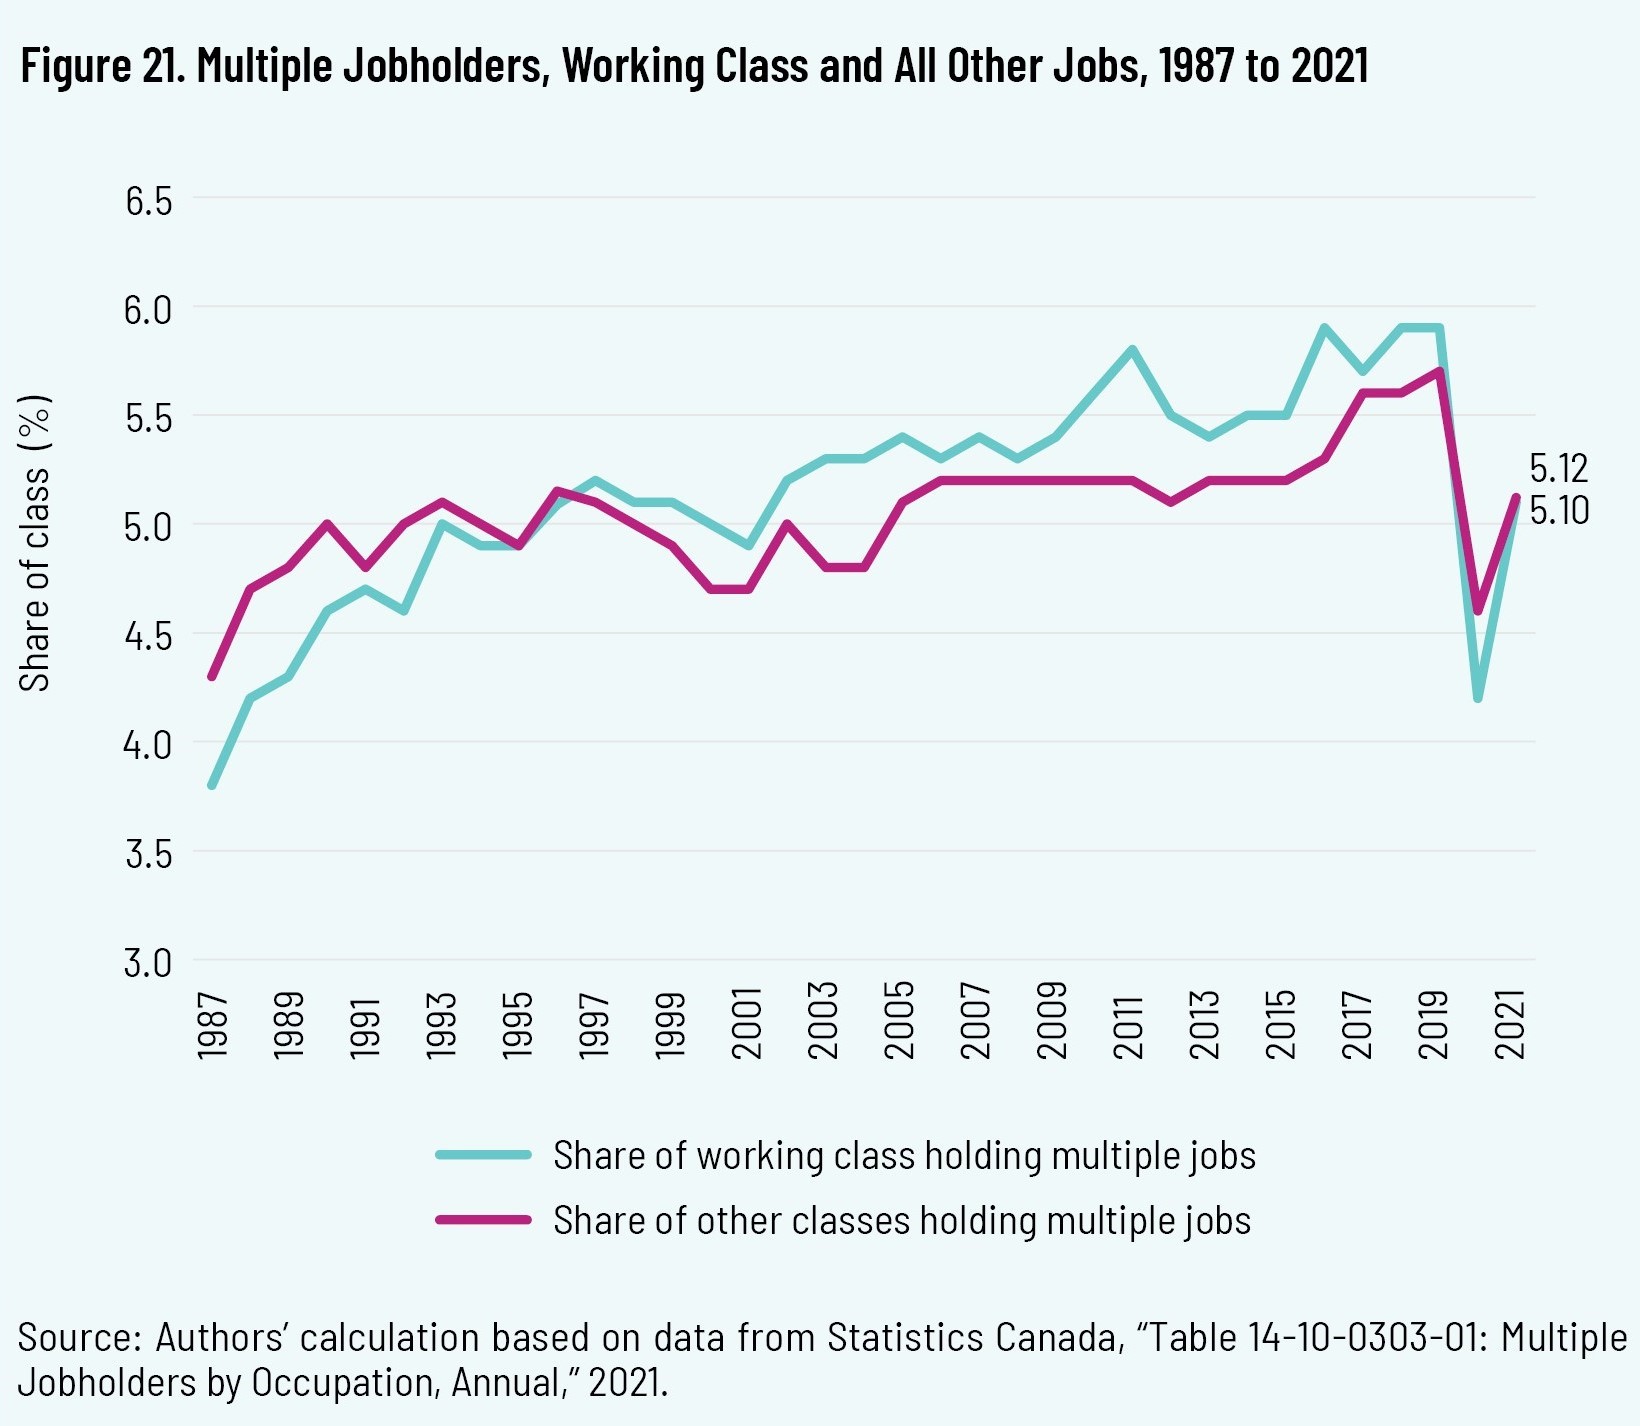
However, in terms of the usual hours worked per week, the data indicate that workers in working-class jobs worked on average only four hours less than those in other occupations (see table 5). While this might suggest that a significant share of workers
in working-class jobs may be working more than one job, the data are not clear. Data from the Labour Force Survey show that, throughout the 2000s and 2010s, the working class was more likely than those in other occupations to hold multiple jobs.
The difference, however, is not large (only 0.2 percentage points in 2019). In 2020 and 2021, in fact, the working class were less likely to hold multiple jobs than those in other occupations, though not by large margins (see figure 21).
It is not clear how well the Labour Force Survey captures the so-called gig economy. For example, respondents working gigs may not see themselves as holding another job, as such. Therefore, the rise of the gig economy may be a potential explanation here.
Another factor to consider is the prevalence of seasonal work among the least-paying working-class jobs. It is likely, for instance, that those employed in harvesting and landscaping are predominantly employed seasonally. Remember that a large
percentage of workers under the age of twenty-five have working-class jobs. It is plausible that many post-secondary students working only during the summer months could constitute a significant portion of these lower-paying jobs, bringing down the average incomes.
A Snapshot of Canada’s Working Class
The previous sections have aimed to provide a statistical snapshot of Canada’s working class. The basic idea is that if policy-makers are to develop an evidencebased working-class agenda, it must be rooted in an empirical foundation. This includes, for instance, reckoning with the shift in working-class employment from the goods-producing sector to the service-producing sector as well as the growing racial diversity reflected within Canada’s working class.
Government policy must in effect reflect the full spectrum of working-class Canadians based on where they live and work in 2022 rather than according to outdated conceptions of who constitutes the working class, the types of jobs they do, and their economic and social outcomes.
It is useful therefore to summarize the key findings here before sketching out the broad contours of a public policy agenda.
- There were 6.5 million working-class Canadians in 2021, which is the equivalent of the combined populations of Saskatchewan and Alberta. If the working class was a singular voting bloc, it would have won the popular vote in the 2019 and 2021 federal elections.
- Canada’s working class represents 34 percent of those currently employed in the national economy. This has fallen from 42 percent in 2000.
- For most of the last twenty years, just over half of working-class Canadians are women. Women are also more likely than male workers to be in working-class jobs.
- Nearly half of working-class Canadians hold sales and service-sector jobs. This is up from just over 30 percent in 1990. It is also more than double the Canadian labour market as a whole.
- Sales and service jobs are the main working-class occupations for both men and women—though this represents a majority for women (52 percent) and a plurality for men (39 percent).
- In terms of age demographics, Canada’s working class is a U-shaped phenomenon. A majority of workers under the age of twenty-four are in working-class occupations. Roughly 40 percent of workers between the ages of sixty and sixty-nine are similarly in working-class jobs. The percentage falls to under 30 percent for those between the ages of thirty and forty-nine.
- The working-class population is highest in New Brunswick, where it represents 40 percent of the employed population, with the other Atlantic provinces, Manitoba, and Saskatchewan near that level. The lowest share is in Alberta, with 33 percent, with British Columbia, Ontario, and Quebec only marginally higher.
- In terms of educational credentials, 53 percent of Canada’s working class actually have post-secondary certificates, diplomas, or degrees. For many workers, this could be seen as a huge opportunity cost for them and for Canada’s economy and society.
- Immigrants and visible minorities are more likely to be in working-class jobs. As an example, nearly half of visible minorities were employed in workingclass occupations compared to 39 percent of non–visible minorities.
- Working-class Canadians earn, on average, 42 percent less per hour than those in non-working-class occupations.
- According to Census data, female workers employed in working-class jobs earned, on average, $24,748 per year, which is 51 percent lower than their non-working-class peers. Working-class men also earned 51 percent less than male workers in other occupations.
- More than 60 percent of working-class Canadians earn less than $800 per week, compared to only 20 percent for their non-working-class peers.
- Roughly four out of ten working-class women earned less than $500 per week, compared to less than one-quarter of working-class men. At the other end of the wage distribution, 17 percent of working-class men earned more than $1,200 per week, while only 6 percent of working-class women earned that much.

What Are the Broad Contours of a Modern Working-Class Agenda?
One of the consequences of the pandemic experience is a heightened public and political attention to the contributions and experiences of those in working-class jobs who played such a crucial role in getting through the crisis.
Translating these insights into a public-policy agenda to support Canada’s working class must start with a reckoning with the data and evidence set out in this paper. Stereotypical notions of the working class mostly comprising male, blue-collar,
often unionized workers in the goods-producing sector are no longer an accurate conception of the working-class experience.
A working-class Canadian is as likely to be a woman or a visible-minority in a sales or service job. They are more likely to work part time or have multiple “gigs.” They are also more likely to be young or nearing the end of their career. They may also be
overqualified for their job.
These changes to Canada’s working class have not occurred overnight. They reflect broader, structural trends in the economy, including the shift from a goods-producing economy to a service-based economy and the rise of job polarization, in which the
relative share of Canadians working in mid-skilled jobs has been falling for more than a quarter century. As we discussed earlier, sales and service-sector jobs have increased from roughly 30 percent of working-class employment in 1990 to nearly
half today.
This modern understanding of Canada’s working class necessarily entails a different set of policy priorities than the older conception. The interests, concerns, and aspirations of female hospitality or personal support workers differ from those of a
man in the manufacturing sector. A genuine working-class agenda needs to account for these differences. It must reflect the full spectrum of working-class Canadians. This paper does not purport to lay out a comprehensive policy agenda for the working class. The goal here instead is to highlight some key policy areas where a modern and inclusive working-class agenda may differ from the past and to catalyze a policy conversation about how it may manifest itself in specific policies today.
A good example is access to health and dental benefits not covered by publicly funded insurance. Canada relies on employer-provided health and dental insurance to cover the vast majority of working Canadians and their families.
55
55
S. Speer, “A Dose of Reality: The Need for a Targeted Approach to Pharmacare,” Macdonald-Laurier Institute, June 2019, https://macdonaldlaurier.ca/mli-files/pdf/20190528_MLI_COMMENTARY_Pharmacare_Speer_Finalweb.pdf;
and S. Speer, “Targeted Reforms to Drug Coverage Can Ensure No One Is Left Behind,” Inside Policy (Macdonald-Laurier
Institute), June 19, 2019, https://macdonaldlaurier.ca/targeted-reforms-drug-coverage-can-ensure-no-one-left-behind-seanspeer-inside-policy/.
Something like 70 or 80 percent of Canadian workers currently receive these benefits through a workplace arrangement.
56
56
S. Speer, “Building on What Works for Pharmacare,” Inside Policy (Macdonald-Laurier Institute), July 17, 2018, https://macdonaldlaurier.ca/building-works-pharmacare-speer-inside-policy/.
Working-class Canadians in traditional sectors such as manufacturing would have historically had employer-provided health and dental coverage as part of collective bargaining. Today’s working class—including those with part-time jobs (which is
more common than Canadians in non-working-class occupations)—is less likely to have employer-provided health and dental benefits. While some younger workers in these jobs may receive health and dental benefits through their parents or from age targeted government programs, many working-class Canadians and their families will not and therefore must pay for drugs, dental, and other health-care costs out of pocket.
There are different options for extending insurance coverage to non-insured members of the working class. One option is through direct government provision similar to how the Medicare model works for hospital and physician costs. Pharmacare
proponents have championed a version of this option as it pertains to drug coverage. An alternative (which one of us has previously advanced) is generous federal subsidies to help individuals on a means-tested basis to acquire private insurance plans.
57
57
B. L. Crowley and S. Speer, “Why Free Marketeers Should Support a New Tax on Health and Dental Plans—on One Condition,” Financial Post, December 13, 2016, https://financialpost.com/opinion/why-free-marketers-should-support-anew-tax-on-health-and-dental-plans-on-one-condition.
Another option would be an innovative idea that Ontario Labour minister Monte McNaughton is pursuing to establish a new portable benefit for workers without employer-provided benefits.
58
58
H. McKenzie-Sutter, “Ontario Committed to Portable Benefits, Labour Minister Says,” Globe and Mail, July 7, 2022, https://www.theglobeandmail.com/canada/article-ontario-committed-to-portable-benefits-labour-minister-says-2/.
The key point though is that access to health and dental benefits is a greater challenge for the new working class than it was for the older one, and policy-makers should aim to address this gap that can ultimately have significant costs and consequences for working-class Canadians and their families.
Another issue of concern to today’s working class is child care. Remember that a majority of working-class Canadians are women, and so access to affordable and flexible child care is a major imperative. Flexibility is worth emphasizing here. The fact that members of the working class are more likely than others to work multiple jobs, including part-time employment and shift work (particularly for personal support workers), indicates that conventional nine-to-five child-care arrangements will not meet their needs.
The federal government has signed agreements with the provinces to establish lowercost child-care options, though serious concerns remain about the prospects of parental choice under these agreements. Policy-makers will need to consider options
to address the flexibility needs of working-class families. A new refundable ChildCare Expense Deduction could help these families defray the costs of child care.
59
59
P. J. Mitchell and A. Mrozek, “Family Policy Brief,” Cardus, 2021, https://www.cardus.ca/research/family/reports/family-policy-brief/; K. Boessenkool, “The Good, the Bad and the Opportunity in the Federal Child Care Plan,” The Hub, May 3, 2021, https://thehub.ca/2021-05-03/ken-boessenkool-the-good-the-bad-and-the-opportunity-in-the-federal-childcare-plan/; and Boessenkool, “Change the Child Tax Deduction to Address the Coming Childcare Shortage,” C.D. Howe Institute, May 7, 2020, https://www.cdhowe.org/intelligence-memos/ken-boessenkool-%E2%80%93-change-child-taxdeduction-address-coming-childcare-shortage.
There is also scope for provincial governments to liberalize some of their child-care-related rules and regulations to enable greater supply in general and more pluralism in particular.
60
60
S. Speer, B. Dijkema, and A. Wudrick, “It’s No Coincidence that We Have Shortages in Our Most Regulated Sectors of the Economy,” The Hub, September 9, 2021, https://thehub.ca/2021-09-09/opinion-its-no-coincidence-we-have-shortagesin-the-most-regulated-sectors-of-our-economy/.
A separate yet related issue is housing. The transition to a service-based economy—including the growing prevalence of working-class employment in service-based jobs—has coincided with the growing concentration of employment and opportunity in Canada’s major cities. Yet cities such as Montreal, Toronto, and Vancouver are essentially unaffordable for working-class households. Recent estimates, for instance, indicate that a household needs to earn more than $220,000 annually to buy a home in Toronto. 61 61 M. Katawazi, “This Is How Much Money You Need to Make to Afford a House in Toronto,” CTV News, July 22, 2022, https://toronto.ctvnews.ca/this-is-how-much-money-you-need-to-make-to-afford-a-house-in-toronto-1.5997424. Rent is not much better: according to City of Toronto data, the average market rent in 2022 for a two-bedroom apartment is $1,703 per month, which is 83 percent of the average annual earnings of working-class women. 62 62 City of Toronto, “Current City of Toronto Average Market Rents & Utility Allowances,” last updated on March 24, 2022, https://www.toronto.ca/community-people/community-partners/social-housing-providers/affordable-housing-operators/current-city-of-toronto-average-market-rents-and-utility-allowances/.
These unaffordable housing prices have economic and social consequences—particularly for the working class. The economic cost comes in the form of a labourmarket distortion stemming from the fact that workers live in less efficient places because they cannot afford to live in our major cities. 63 63 S. Speer, “The Conservative Case for Federal Intervention in Housing,” The Hub, April 27, 2022, https://thehub.ca/2022-04-27/the-conservative-case-for-federal-intervention-in-housing/. The social effects manifest themselves in long commute times and the toll that they take on one’s own health as well as family, marriage, and civic involvement. 64 64 M. Rumer, “The Particular Horrors of Long Commutes for Young Families,” New York Times, October 31, 2018, https://www.nytimes.com/2018/10/31/well/family/the-particular-horror-of-long-commutes-for-young-families.html; A. Schaefer, “Commuting Takes Its Toll,” Scientific American, October 1, 2005, https://www.scientificamerican.com/article/commutingtakes-its-toll/. Provincial and municipal policy makers must therefore consider policy actions to boost housing supply (including market-based and social housing units), minimize market distortions from foreign capital, and expand access to affordable and reliable public transit.
Another key policy area for today’s working class is modern labour regulations and standards. As a growing share of the Canadian working class finds itself involved in platform-enabled employment (think for instance of Uber or Door Dash), public
policy will need to fill gaps and address uncertainties in a way that minimizes the risk of worker exploitation while not undermining the benefits for workers such as flexibility and earnings upside. Ontario labour minister Monte McNaughton has proved to be an innovator here, with legislation that creates a new class of employment that sits between the traditional employer-employee relationship and the independent contractor model.
65
65
Talent Canada, “Ontario Passes ‘Historic’ Working for Workers Act,” April 8, 2022, https://www.talentcanada.ca/
ontario-passes-historic-working-for-workers-act/. The Ontario legislation reflects an idea first put forward by American
economists Seth Harris and Alan Krueger in 2015. See Harris and Krueger, “A Proposal for Modernizing Labor Laws for
Twenty-First-Century Work: The ‘Independent Worker,” The Hamilton Project and Brookings Institution, 2015, https://www.hamiltonproject.org/assets/files/modernizing_labor_laws_for_twenty_first_century_work_krueger_harris.pdf.
It is an approach that other provincial governments should explore.
More generally, Canadian policy-makers should be reviewing labour policies with the goal of ensuring that they reflect the modern working-class experience. As Cardus’s Brian Dijkema has observed, much of our conception of employee-employer relations and broader labour-market dynamics is rooted in the goods-producing economy. 66 66 The Hub, “Brian Dijkema Examines the Holistic Value of Work, Religion in a Pluralist Society, and Why Quebec’s Bill 21 Must Be Challenged,” February 17, 2022, https://thehub.ca/2022-02-17/the-holistic-value-value-of-work-religion-whyquebecs-bill-21-must-be-challenged/. Our labour standards and regulations need therefore to be tested against the evolving experiences of Canadian workers in general and the working class in particular.
This may represent an opportunity for trade unions to renew their mission, purpose, and relevance for the modern economy. A 2021 deal between Uber and the United Food and Commercial Workers Canada may represent a harbinger of new and
innovative models of labour relations that reflect these structural economic trends.
67
67
S. Speer, “Unions Need Serious Renewal if They Want to Make It in the Modern Economy,” The Hub, February 28, 2022, https://thehub.ca/2022-02-08/unions-need-renewal-if-they-want-to-make-it-in-the-modern-economy/.
This would be a positive development that would see these questions of workplace conditions and the employer-employee relationship negotiated through civil-society institutions rather than the heavy hand of the state.
Education policy is another area requiring further study. We need to be asking ourselves (including our educational institutions) how we can boost the human capital of working-class Canadians as well as apply the underutilized human capital of the more than three million working-class Canadians with post-secondary qualifications. There is probably scope, for instance, for more co-op opportunities in the secondary school system 68 68 B. Dijkema and S. Speer, “The Skilled Trades Are in Need of Strengthened Apprenticeship Programs,” Policy Options, February 28, 2020, https://policyoptions.irpp.org/magazines/february-2020/the-skilled-trades-are-in-need-of-strengthenedapprenticeship-programs/. as well as greater intentionality in the area of lifelong learning. 69 69 Ontario Workforce Recovery Advisory Committee, “The Future of Work in Ontario: Findings and Recommendations from the Ontario Workforce Recovery Advisory Committee,” December 2021, https://www.ontario.ca/files/2022-06/mltsd-owrac-future-of-work-in-ontario-november-2021-en-2021-12-09.pdf. There is also a need to re-evaluate how we allocate resources between university oriented education and the skilled trades. 70 70 B. Dijkema and S. Speer, “Advancing Structural Reforms to the Skilled Trades and Apprenticeships in Canada,” Ontario 360 (Munk School of Global Affairs and Public Policy), February 13, 2020, https://on360.ca/policy-papers/advancingstructural-reforms-to-the-skilled-trades-and-apprenticeships-in-ontario/.
Fundamentally, though, these questions should start from the premise that we want to accentuate the interests and skills of every Canadian and boost their abilities in order to pursue their career goals—particularly in a context in which those in
working-class jobs may face greater automation risk.
71
71
S. Speer and W. Ahmed, “A Place-Based Lens to the Future of Work in Canada,” Public Policy Forum, June 2020, https://ppforum.ca/wp-content/uploads/2020/06/PlaceBasedLensToTheFutureOfWork-PPF-June2020-EN.pdf.
These issues of credentialing, human capital, and labour supply are of particular concern as matters of immigration policy. Remember that recent immigrants are much more likely to be in working-class jobs than non-immigrants or even immigrants who have been here longer. This reflects in part ongoing challenges with foreign credential recognition that require a concerted effort from federal and provincial governments as well as professional bodies and educational institutions. 72 72 Medow and Sheldrick, “Integrating Newcomers into Ontario’s Economy.” It is a huge opportunity cost to have overqualified immigrants in working-class jobs.
Policy-makers must also remember that low-skilled immigrants (including, for instance, temporary foreign workers) represent competition for members of the working class, which can put downward pressure on wages and discourage business investment in productivity-enhancing technology. 73 73 D. Wright, “Rhetoric vs. Results: Shaping Policy to Benefit Canada’s Middle Class,” Public Policy Forum, June 28, 2021, https://ppforum.ca/publications/don-wright-middle-class/. Immigration is a comparative advantage for Canada, but in general terms the emphasis should be on immigrants who fill market needs with low-supply skills rather than produce a surplus of immigrants with high-supply skills who compete away gains for working-class Canadians.
There are no doubt various other policy areas requiring attention as part of a modern and inclusive working-class agenda. But the areas cited here—health and dental benefits, child care, housing, public transit, labour standards and regulations, education, and immigration—are a good starting point. The key is to root evidence based policy-making in the conceptual and empirical taxonomy that we have aimed to provide in this paper.
References
Boessenkool, K. “Change the Child Tax Deduction to Address the Coming Childcare Shortage.” C.D. Howe Institute, May 7, 2020. https://www.cdhowe.org/intelligence-memos/ken-boessenkool-%E2%80%93-change-child-tax-deduction-address-coming-childcare-shortage.
———. “The Good, the Bad and the Opportunity in the Federal Child Care Plan.” The Hub, May 3, 2021. https://thehub.ca/2021-05-03/ken-boessenkool-the-good-the-bad-and-the-opportunity-in-the-federal-child-care-plan/.
City of Toronto. “Current City of Toronto Average Market Rents & Utility Allowances.” Last updated on March 24, 2022. https://www.toronto.ca/community-people/community-partners/social-housing-providers/affordable-housing-operators/current-city-of-toronto-average-market-rents-and-utility-allowances/.
Crosby, J. “More Seniors Drawing Paychecks from Retail Jobs.” Minneapolis Star Tribune, July 30, 2008. https://www.startribune.com/more-seniors-drawing-retail-paychecks/26120549/.
Crowley, B. L., and S. Speer. “Why Free Marketeers Should Support a New Tax on Health and Dental Plans—on One Condition.” Financial Post, December 13, 2016. https://financialpost.com/opinion/why-free-marketers-should-support-a-new-tax-on-health-and-dental-plans-on-one-condition.
Dijkema, B., and S. Speer. “Advancing Structural Reforms to the Skilled Trades and Apprenticeships in Canada.” Ontario 360 (Munk School of Global Affairs and Public Policy), February 13, 2020. https://on360.ca/policy-papers/advancing-structural-reforms-to-the-skilled-trades-and-apprenticeships-in-ontario/.
———. “The Skilled Trades Are in Need of Strengthened Apprenticeship Programs.” Policy Options, February 28, 2020. https://policyoptions.irpp.org/magazines/february-2020/the-skilled-trades-are-in-need-of-strengthened-apprenticeship-programs/.
Drault, T. “Understanding the Working Class.” Demos, April 16, 2018. https://www.demos.org/research/understanding-working-class.
Eisen, B., and M. Palacios. “Who Earns the Minimum Wage in Canada?” Fraser Institute, 2021. https://www.fraserinstitute.org/sites/default/files/who-earns-the-minimum-wage-in-canada.pdf.
Gilmore, R. “Middle Class Prosperity Minister Says Canada Can’t Measure Who Is in the Middle Class.” CTV News, January 28, 2020. https://www.ctvnews.ca/politics/middle-class-prosperity-minister-says-canada-can-t-measure-who-is-in-the-middle-class-1.4787051.
Government of Canada. “Hierarchy and Structure.” 2021, https://noc.esdc.gc.ca/Structure/Hierarchy.
———. “Skill Level.” 2021. https://noc.esdc.gc.ca/Training/SkillLevel.
Hammond, S. “‘Low skill’ as an economics term of art is misleading, but I don’t find it offensive, because value in economics is essentially never meant as intrinsic . . .” Twitter, January 5, 2022. https://twitter.com/hamandcheese/status/1478854662002520066.
Harris, S., and A. Krueger. “A Proposal for Modernizing Labor Laws for Twenty-First-Century Work: The ‘Independent Worker.’” The Hamilton Project and Brookings Institution, 2015. https://www.hamiltonproject.org/assets/files/modernizing_labor_laws_for_twenty_first_century_work_krueger_harris.pdf.
The Hub. “Brian Dijkema Examines the Holistic Value of Work, Religion in a Pluralist Society, and Why Quebec’s Bill 21 Must Be Challenged.” February 17, 2022. https://thehub.ca/2022-02-17/the-holistic-value-value-of-work-religion-why-quebecs-bill-21-must-be-challenged/.
———. “Hub Dialogues: David Goodhart on Why University Education Is Not the Only Education that Matters.” October 21, 2021. https://thehub.ca/2021-10-26/hub-dialogue-university-education-is-not-the-only-education/.
Katawazi, M. “This Is How Much Money You Need to Make to Afford a House in Toronto.” CTV News, July 22, 2022. https://toronto.ctvnews.ca/this-is-how-much-money-you-need-to-make-to-afford-a-house-in-toronto-1.5997424.
Lake, J. “Don’t Blame Trade for Killing the Middle-Tier Jobs that We Need.” Bush Center, Fall 2018. https://www.bushcenter.org/catalyst/opportunity-road/lake-job-polarization.html.
Lu, Y., and F. Hou. “Over-education Among University-educated Immigrants in Canada and the United States.” Statistics Canada, December 3, 2019. https://www150.statcan.gc.ca/n1/pub/11f0019m/11f0019m2019022-eng.htm.
McKenzie-Sutter, H. “Ontario Committed to Portable Benefits, Labour Minister Says.” Globe and Mail, July 7, 2022. https://www.theglobeandmail.com/canada/article-ontario-committed-to-portable-benefits-labour-minister-says-2/.
McNaughton, M. (@MonteMcNaughton). “Our government is standing with hardworking people . . . not those who want to “phase out” good blue-collar jobs. We know Ontario is built by those who shower . . .” Twitter, April 12, 2022. https://twitter.com/montemcnaughton/status/1514009620997541893.
Medow, J., and O. Sheldrick. “Integrating Newcomers into Ontario’s Economy: A Strategy for Professionally Skilled Immigrant Success.” Ontario 360 (Munk School of Global Affairs and Public Policy), January 30, 2020. https://on360.ca/policy-papers/integrating-newcomers-into-ontarios-economy-a-strategy-for-professionally-skilled-immigrant-success/.
Mitchell, P.J., and A. Mrozek. “Family Policy Brief.” Cardus, 2021. https://www.cardus.ca/research/family/reports/family-policy-brief/.
Ontario Workforce Recovery Advisory Committee. “The Future of Work in Ontario: Findings and Recommendations from the Ontario Workforce Recovery Advisory Committee.” December 2021. https://www.ontario.ca/files/2022-06/mltsd-owrac-future-of-work-in-ontario-november-2021-en-2021-12-09.pdf.
Rumer, M. “The Particular Horrors of Long Commutes for Young Families.” New York Times, October 31, 2018. https://www.nytimes.com/2018/10/31/well/family/the-particular-horror-of-long-commutes-for-young-families.html.
Schaefer, A. “Commuting Takes Its Toll.” Scientific American, October 1, 2005. https://www.scientificamerican.com/article/commuting-takes-its-toll/.
Sood, S. “Impact of COVID-19 on Food Services and Drinking Places, First Quarter of 2021.” Statistics Canada, March 18, 2021. https://www150.statcan.gc.ca/n1/pub/45-28-0001/2021001/article/00010-eng.htm.
Speer, S. “Building On What Works for Pharmacare.” Inside Policy (Macdonald-Laurier Institute), July 17, 2018. https://macdonaldlaurier.ca/building-works-pharmacare-speer-inside-policy/.
———. “The Conservative Case for Federal Intervention in Housing.” The Hub, April 27, 2022. https://thehub.ca/2022-04-27/the-conservative-case-for-federal-intervention-in-housing/.
———. “Conservatives Need to Start Solving the Problems of Today.” National Post, November 7, 2019. https://nationalpost.com/opinion/right-now-conservatives-need-to-start-solving-the-problems-of-today.
———. “Did We Really Experience a ‘She-cession’? The Answer Is Complicated.” The Hub, August 19, 2021. https://thehub.ca/2021-08-19/policy-pulse-day-5/.
———. “A Dose of Reality: The Need for a Targeted Approach to Pharmacare.” Macdonald-Laurier Institute, June 2019. https://macdonaldlaurier.ca/mli-files/pdf/20190528_MLI_COMMENTARY_Pharmacare_Speer_Finalweb.pdf.
———. “Targeted Reforms to Drug Coverage Can Ensure No One Is Left Behind.” Inside Policy (Macdonald-Laurier Institute), June 19, 2019. https://macdonaldlaurier.ca/targeted-reforms-drug-coverage-can-ensure-no-one-left-behind-sean-speer-inside-policy/.
———. “Unions Need Serious Renewal if They Want to Make It in the Modern Economy.” The Hub, February 28, 2022. https://thehub.ca/2022-02-08/unions-need-renewal-if-they-want-to-make-it-in-the-modern-economy/.
Speer, S., and B. Dijkema. “Fuelling Canada’s Middle Class: Job Polarization and the Natural Resource Sector.” Cardus, December 2020. https://www.cardus.ca/research/work-economics/reports/fuelling-canadas-middle-class/.
Speer, S., and S. Bezu. “Job Polarization in Canada.” Public Policy Forum, April 2021. https://ppforum.ca/wp-content/uploads/2021/04/JobPolarizationInCanada-PPF-April2021-EN.pdf.
Speer, S., and W. Ahmed. “A Place-Based Lens to the Future of Work in Canada.” Public Policy Forum, June 2020. https://ppforum.ca/wp-content/uploads/2020/06/PlaceBasedLensToTheFutureOfWork-PPF-June2020-EN.pdf.
Speer, S., B. Dijkema, and A. Wudrick. “It’s No Coincidence that We Have Shortages in Our Most Regulated Sectors of the Economy.” The Hub, September 9, 2021. https://thehub.ca/2021-09-09/opinion-its-no-coincidence-we-have-shortages-in-the-most-regulated-sectors-of-our-economy/.
Statistics Canada. 2016 Census of Population. Statistics Canada Catalogue no. 98-400-X2016356.
———. Labour Force Survey. December 2021. Public-use microdata file.
———. “Table 14-10-0287-03: Labour Force Characteristics by Province, Monthly, Seasonally Adjusted.” August 2021. https://www150.statcan.gc.ca/t1/tbl1/en/tv.action?pid=1410028703.
———. “Table 14-10-0303-01: Multiple Jobholders by Occupation, Annual.” 2021. https://www150.statcan.gc.ca/t1/tbl1/en/tv.action?pid=1410030301.
———. “Table 14-10-0315-01: Weekly Wage Distributions by Occupation, Monthly, Unadjusted for Seasonality (x 1,000).” 2021. https://doi.org/10.25318/1410031501-eng.
———. “Table 14-10-0335-01: Labour Force Characteristics by Occupation, Annual.” 2021. https://doi.org/10.25318/1410033501-eng.
———. “Table 17-10-0009-01: Population Estimates, Quarterly.” June 2021. https://www150.statcan.gc.ca/t1/tbl1/en/tv.action?pid=1710000901.
Talent Canada. “Ontario Passes ‘Historic’ Working for Workers Act.” April 8, 2022. https://www.talentcanada.ca/ontario-passes-historic-working-for-workers-act/.
Wright, D. “Rhetoric vs. Results: Shaping Policy to Benefit Canada’s Middle Class.” Public Policy Forum, June 28, 2021. https://ppforum.ca/publications/don-wright-middle-class/.