

Executive Summary
Family is a defining feature in the lives of most Canadians. Family profoundly influences our economic and social lives and our hopes and plans for the future. For many young adults, transitioning from a family of origin toward a partnership is a significant aspect of adulthood. Marriage has featured prominently in this transition, but over the last fifty years or so there has been something of a family revolution, as the portion of married “census families” in Canada has declined while common-law relationships and living alone have increased. And the young adults who do marry are doing so at later ages.
Survey data suggest that young adults generally view marriage as a positive aspect of family life but are less convinced that the institution is necessary. Still, many young adults do marry. Why do some young adults choose to marry and others do not?
This report examines three questions from Statistics Canada’s General Social Survey 2017 to better understand the main reasons that partnered young adults choose to marry or forgo marriage. One question was posed to each cohort: married, intending to marry current partner, and not intending to marry current partner. Married respondents, and those intending to marry, were asked to select the main reason for their decision, from a set of nine response options. Those who were partnered but did not intend to marry their current partner were asked to select their main reason for not marrying, from a set of ten response options. All respondents were provided with an “other” write-in option. We examined the frequency of selected responses by age and sex. Our primary focus for this report are young adults aged twenty-four to thirty-four, as the average age of first marriage is approximately thirty years old.

Our analysis finds that among young adults who are married or intend to marry, nearly half selected “proof of love and commitment” as the main reason for their decision. The second most frequently selected answer for currently married respondents was “cultural, moral, or religious reasons,” and for those intending to marry it was “next logical step.” “Legal protections and financial security” was the least selected reason among married respondents and third least selected reason among partnered young adults intending to marry their current partner.
The provided response options were open to interpretation by survey respondents, but we suggest that personal relational motivations, and culturally or community informed values, are primary motivations for marriage. A couple may choose to marry to prove their love and commitment to one another, but it might equally be true that marriage communicates the status of their relationship to friends, families, and society.
Conversely, among young adults choosing to forgo marriage, one in two men and two in five women selected “don’t believe in the institution of marriage” as the main reason for their decision. Only 5.4 percent selected “never thought about it” as the main reason for not marrying their current partner.
A pluralistic society respects that marriage is not for every individual, but neither should the personal and society benefits corelated with healthy marriage be ignored. Discussion of the economic barriers to family formation shouldn’t ignore the significant role that personal and culturally informed values have in marital decision making. Community groups, religious organizations, and others interested in the relational health of young adults should reflect on the larger societal values about marriage and consider the values that their organizations are communicating intentionally or unintentionally to young adults.

Introduction
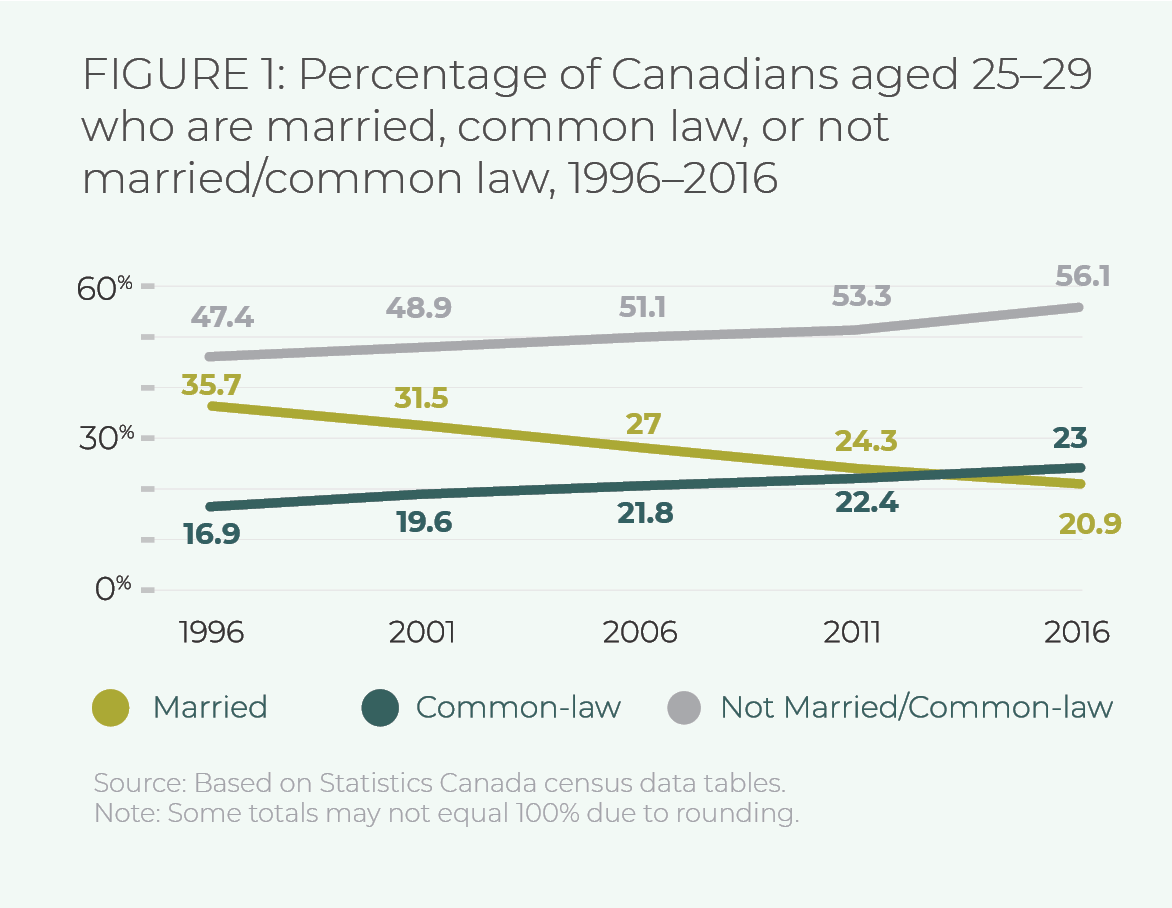
Canada has undergone something of a family revolution over the last fifty years. In 1970, married couples (with or without children) accounted for 91 percent of all “census families.” 1 1 Statistics Canada defines a census family as “a married couple and the children, if any, of either and/or both spouses; a couple living common law and the children, if any, of either and/or both partners; or a lone parent of any marital status with at least one child living in the same dwelling and that child or those children. All members of a particular census family live in the same dwelling.” Statistics Canada, “Census Family,” November 16, 2015, https://www23.statcan.gc.ca/imdb/p3Var.pl?Function=Unit&Id=32746. By 2016, that portion had fallen to 66 percent of census families. While marriage remains the predominant family form, the tendency to form families around marriage is declining. Why do some Canadian young adults still choose to marry? Why do others forgo marriage? This report analyzes data from Statistics Canada’s General Social Survey 2017 to better understand the main reasons that partnered young adults choose to marry or to forgo marriage.
Canadian young adults who marry are doing so at increasingly older ages. As the portion of married young adults aged twenty-five to thirty-four has decreased for decades, the portion of couples living common law has increased, though many of these relationships do transition into formal marriage. 2 2 Statistics Canada defines couples as common law if they are living together in a conjugal relationship but are not legally married. At the same time, the portion of young adults living unpartnered has increased faster than those living common law.
Survey data suggest that young adults largely view marriage as a positive contributor to family life. 3 3 Nanos Research, “How Canadians Feel About Family Life,” Nanos Research, May 2016, https://www.cardus.ca/assets/data/images/2016/family/2016-809-Cardus-Familyandpartnership-ReportwithTabs.pdf. Whether marriage is a necessary component for a positive family life, however, is another question. Angus Reid Institute data suggest that just over half of twenty-five- to thirty-four-year-olds say that marriage is a more genuine form of commitment than living common law, but 58 percent also say that they don’t think it is important for couples who want to spend the rest of their lives together to get married. 4 4 Angus Reid Institute, “‘I Don’t’: Four in Ten Canadian Adults Have Never Married, and Aren’t Sure They Want To,” May 7, 2018, http://angusreid.org/marriage-trends-canada/.
Marriage is not as pertinent among young adults as it was in the past, with less than 40 percent of young adults agreeing that “marriage is as relevant today as it has ever been.” 5 5 Angus Reid Institute, “I Don’t.” While there may be a sense that marriage is losing relevance, a substantial body of research shows that healthy marriage is associated with positive personal and public outcomes.
Married couples are more likely to combine and leverage income and economic resources and to pass on those resources to their children. 6 6 S. Britt-Lutter, C. Dorius, and D. Lawson, “The Financial Implications of Cohabitation Among Young Adults,” Journal of Financial Planning 31, no. 4 (2018): 38–45, https://www.onefpa.org/journal/Pages/APR18-The-Financial-Implications-of-Cohabitation-Among-Young-Adults.aspx. There are a number of correlations between healthy marriage and better physical and mental health, and better recovery from illness. 7 7 S. Martinuk, “Marriage Is Good for Your Health,” Cardus, September 2016, https://www.cardus.ca/research/family/reports/marriage-is-good-for-your-health/. Data suggest that growing up in an intact family is correlated with benefits for children. 8 8 Witherspoon Institute, Marriage and the Public Good: Ten Principles (Princeton, NJ: Witherspoon Institute, 2008). The degree to which these outcomes are the result of marriage, or are a selection effect, continues to be a matter of discussion, but on the whole, healthy, stable marriage appears to be beneficial for individuals and society.

Methodology
Using public-use microdata files from the General Social Survey 2017, we analyzed the frequency of selected responses that were provided for three survey questions, by age group and sex. We used the values weighted by Statistics Canada to extrapolate to the larger Canadian population.
We divided the sample into four age categories: age 24 and under, ages 25 to 34, ages 35 to 54, and age 55 and over. For each age group we analyzed the frequency of responses by sex, male and female. 9 9 The responses to the “Sex” category were split on the binary, and there were no responses under the “Don’t Know,” “Refusal,” or “Not Stated” categories provided by Statistics Canada.
This study focuses on Canadian young adults within the prime marrying age. The average age of first marriage in Canada in the latest year on record (2008) is 31 years for men and 29.6 years for women. 10 10 A. Milan, “Marital Status: Overview, 2011,” Statistics Canada, July 2013, 10, https://www150.statcan.gc.ca/n1/en/pub/91-209-x/2013001/article/11788-eng.pdf?st=7X49BIbv. Thus we focus most of our analysis on the age 25 to 34 category. While we analyzed the data for the age 24 and under category, we don’t report the results here, as less than 5 percent of Canadians within this age range are married, and one of the three questions are asked of married respondents.
The three questions we analyzed instruct respondents to select from nine responses for the first two questions, and ten responses for the third question. The response options included “other.” This response category offered a write-in option. Statistics Canada coded and distributed the written responses into existing categories where there was a suitable match, or left them in “other-specify” if a match with an existing category was not possible.
The first question analyzed was posed to respondents who indicated that they were married. Respondents were asked to select the main reason that they choose to marry rather than live unmarried or in a common-law relationship.
The second question was posed to respondents who indicated that they were in a common-law relationship or an intimate-couple relationship, and definitely or probably intended to marry their current partner. Respondents were asked to select the main reason that they planned to marry their current partner.
The third question was posed to respondents who were living common law or in an intimate-couple relationship and said that they definitely would not, or probably would not, marry their current partner. Respondents were asked to select the main reason that they planned to continue the relationship unmarried.
Additional methodological details are available in the appendix.
Limitations
Our analysis examines the frequency of selected responses to the provided options. Caution should be exercised in extrapolating comparative analyses beyond the frequency distributions.
As noted above, respondents were provided with nine or ten response options, depending on the question. Response options were open to the respondent’s interpretation, and we cannot be certain we have understood the full range of interpretations, which limits aspects of our analysis.
Respondents were provided with an “other” response option that included a write-in option. As previously noted, Statistics Canada recoded these responses to other options or retained them in the “Other” category. No written responses were provided in the public-use microdata file.
Finally, the survey was conducted prior to the COVID-19 pandemic and cannot account for the impact that this crisis may have had on intentions to marry.

Results
Married Couples
The first question we examined was directed to respondents who indicated that their marital status was “married.” They were asked to identify the main reason that they married their current spouse.
In the sample as a whole, the most frequently selected main reason that respondents selected was “proof of love and commitment” (40.7%), followed by “cultural, moral, or religious beliefs” (24.5%), and “marriage was the next step/logical advancement of the relationship” (8.7%).
The top two responses were consistent by sex, but for women the response “Living together without being married was not socially acceptable” (8.6%) was the third most frequently selected response.
Turning our attention to young adults ages twenty-five to thirty-four, we found that men and women shared similar frequency ranking of responses to the overall sample.
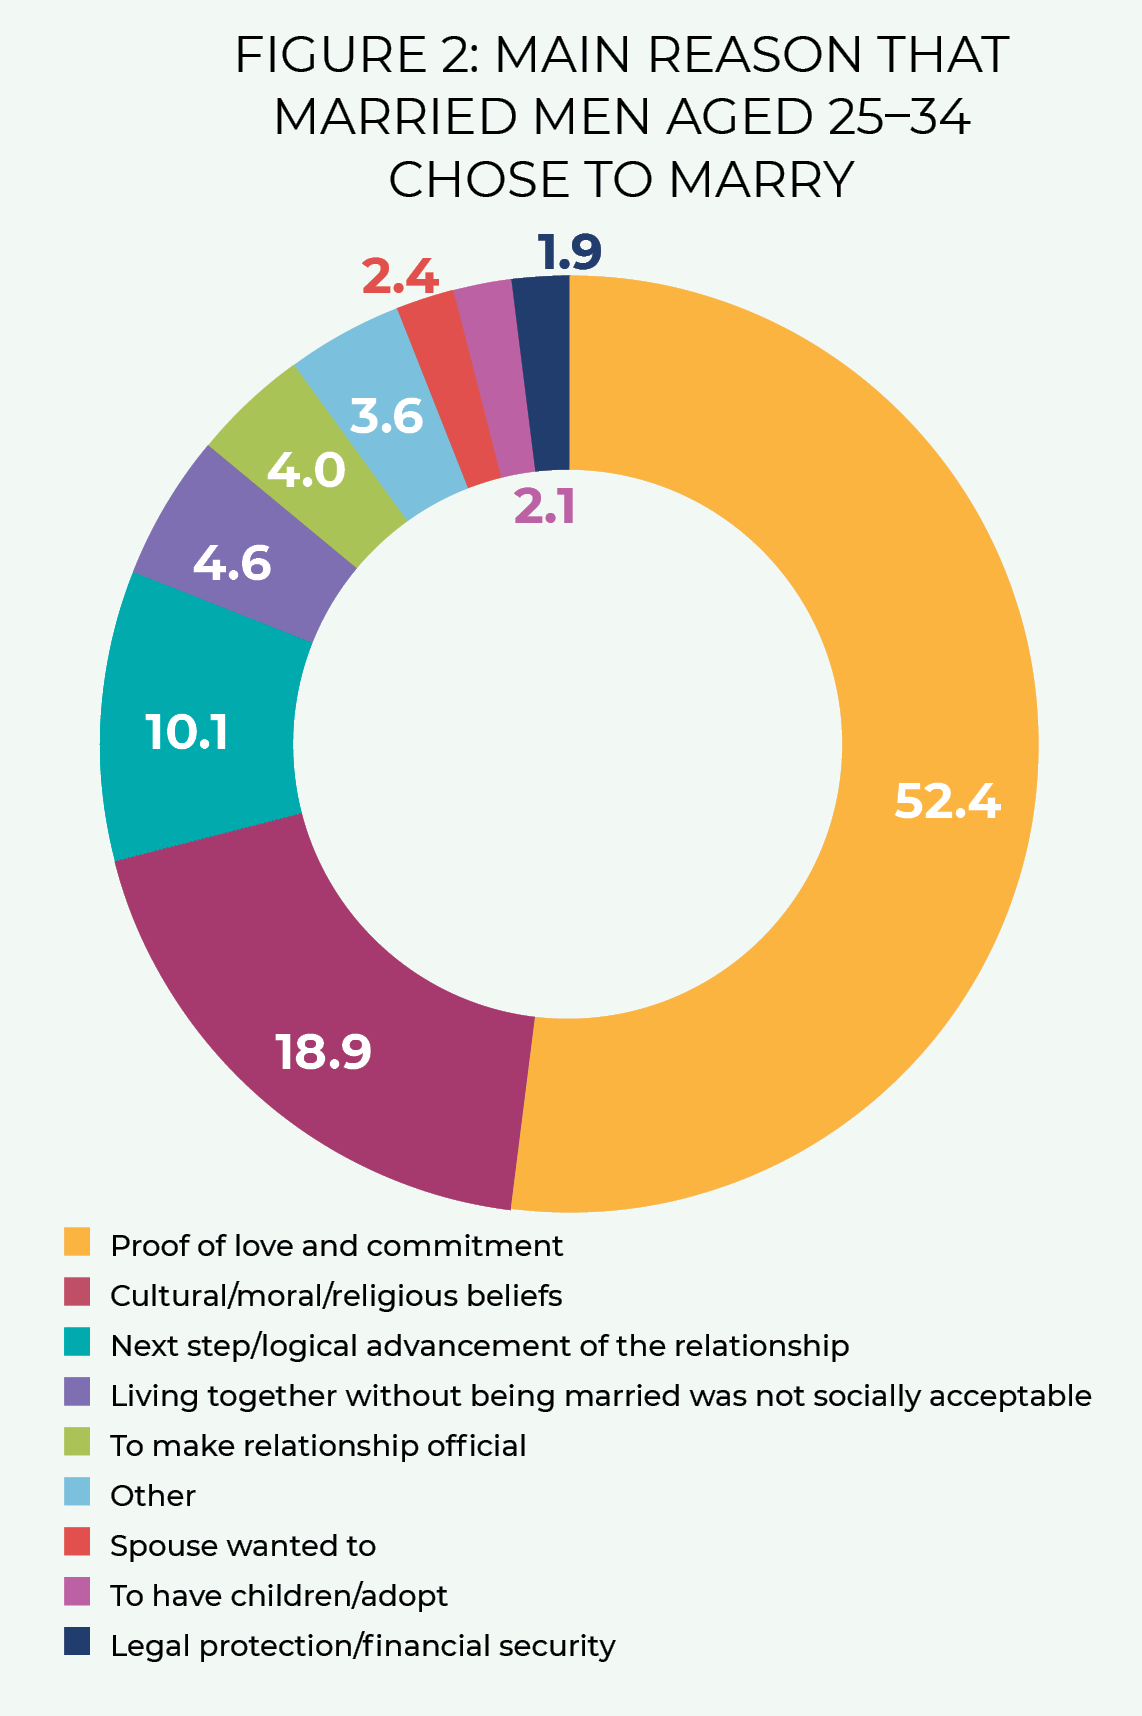
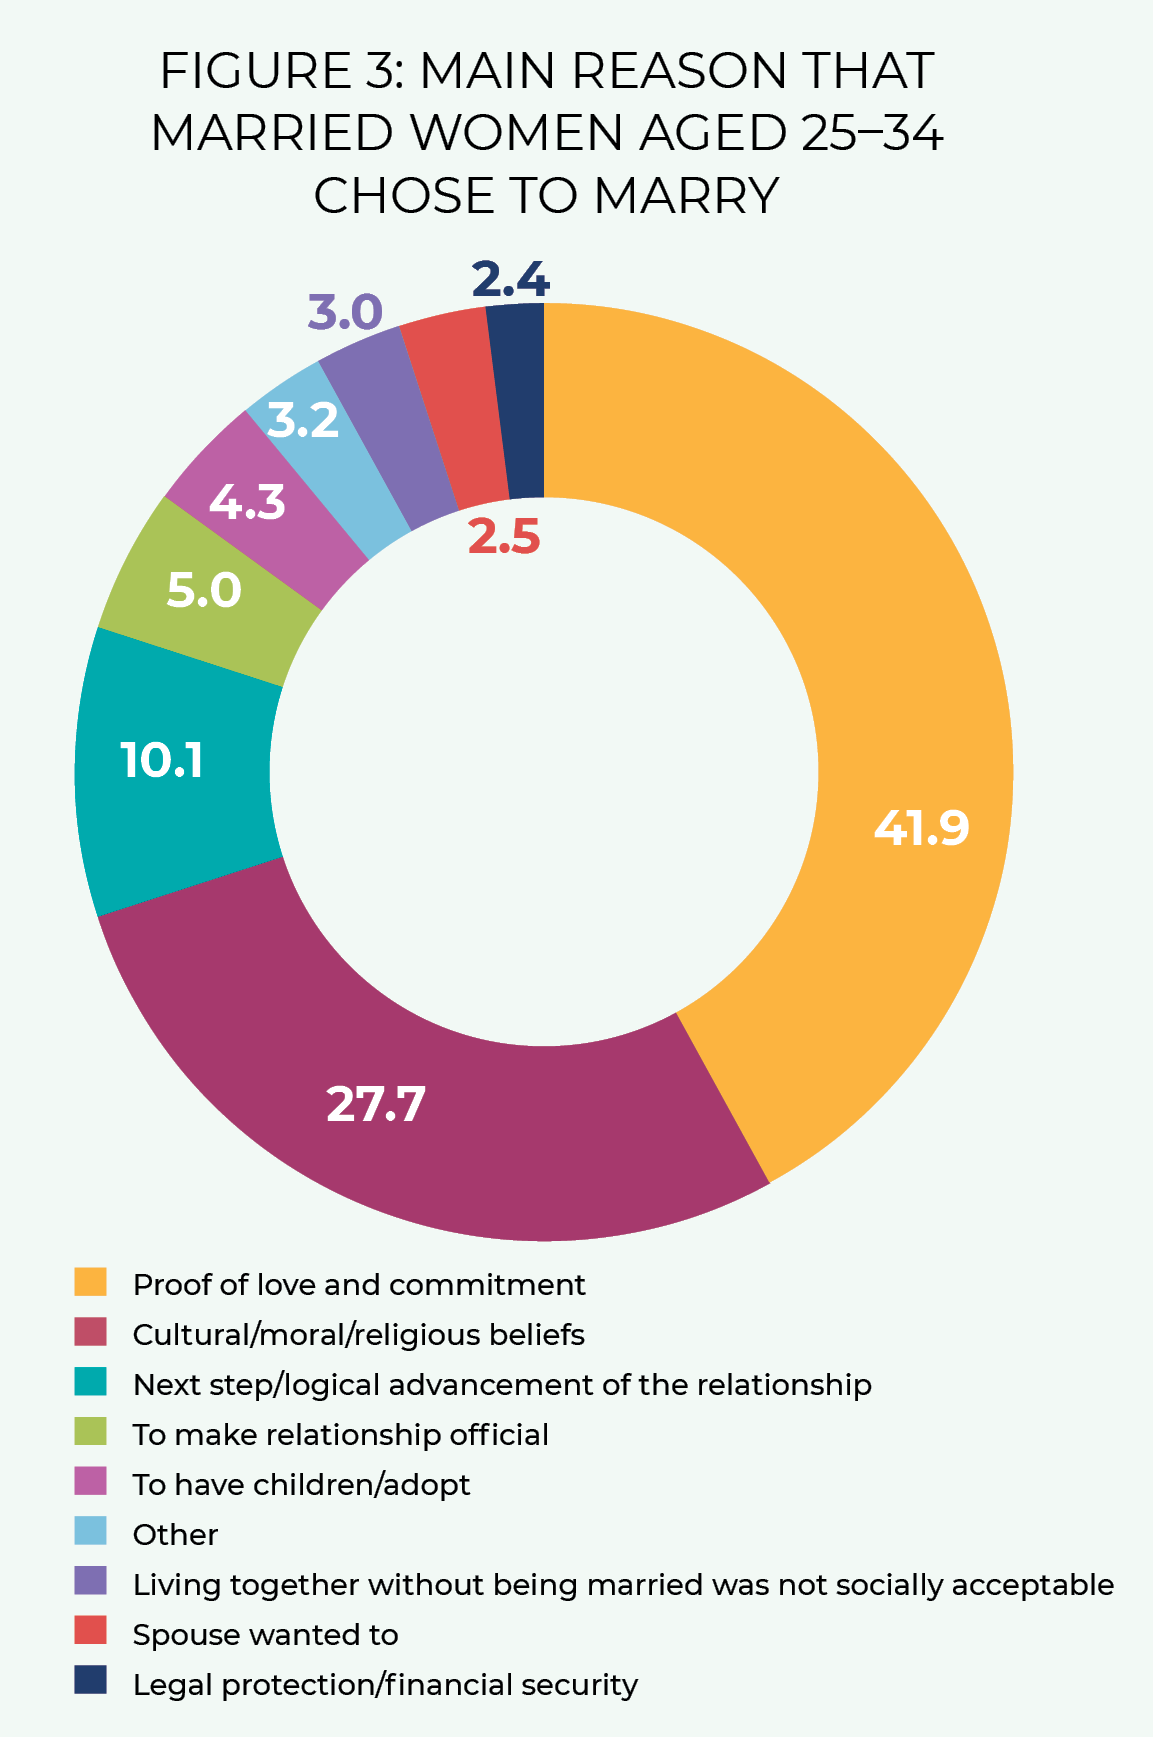
Nearly half of twenty-five- to thirty-four-year-old married couples selected “proof of love and commitment” (46.5%). The second most frequently select response was “cultural, moral, and religious reasons” (23.9%).
The three least frequently selected main reasons to marry for twenty-five- to thirty-four-year-olds was “legal protection/financial security” (2.2%), then “spouse wanted to” (2.5%), and “to have/adopt children” (3.3%). Among men in this age group, the least frequently selected main reasons to marry were “legal protection/financial security” (1.9%), “to have children/adopt” (2.1%), and “spouse wanted to” (2.4%). The least frequently selected responses for women were “legal protection/financial security” (2.4%), “spouse wanted to” (2.5%), and “living together without being married not socially acceptable” (3.0%).
Legal protections and financial security may have important implications for young adults, but this reason for marrying was infrequently selected as the main motivation.
Couples Intending to Marry
Next, we focused on prospective married couples—those who indicated that they definitely or probably intended to marry their partner. The response options provided were identical to the previous question we analyzed.
In the overall sample, the three most frequently selected main reason for intending to marry a current partner were “proof of love and commitment” (49.8%), followed by “next step/logical advancement of the relationship” (10.6%), and “to make the relationship official” (8.7%).
The response by sex followed the overall response for the top two most frequently selected answers (proof of love, next step), but the third most frequent selection for men was “legal protection/financial security” (8%) and for women was “to make the relationship official” (10.1%).
Among young adults ages twenty-five to thirty-four, the top two selected responses were similar to the overall sample: “proof of love and commitment” (48.9%) and “next step/logical advancement” (13.7%). Unlike the overall sample, however, this cohort selected “to have/adopt children” (7.6%) as the third most frequently selected reason.
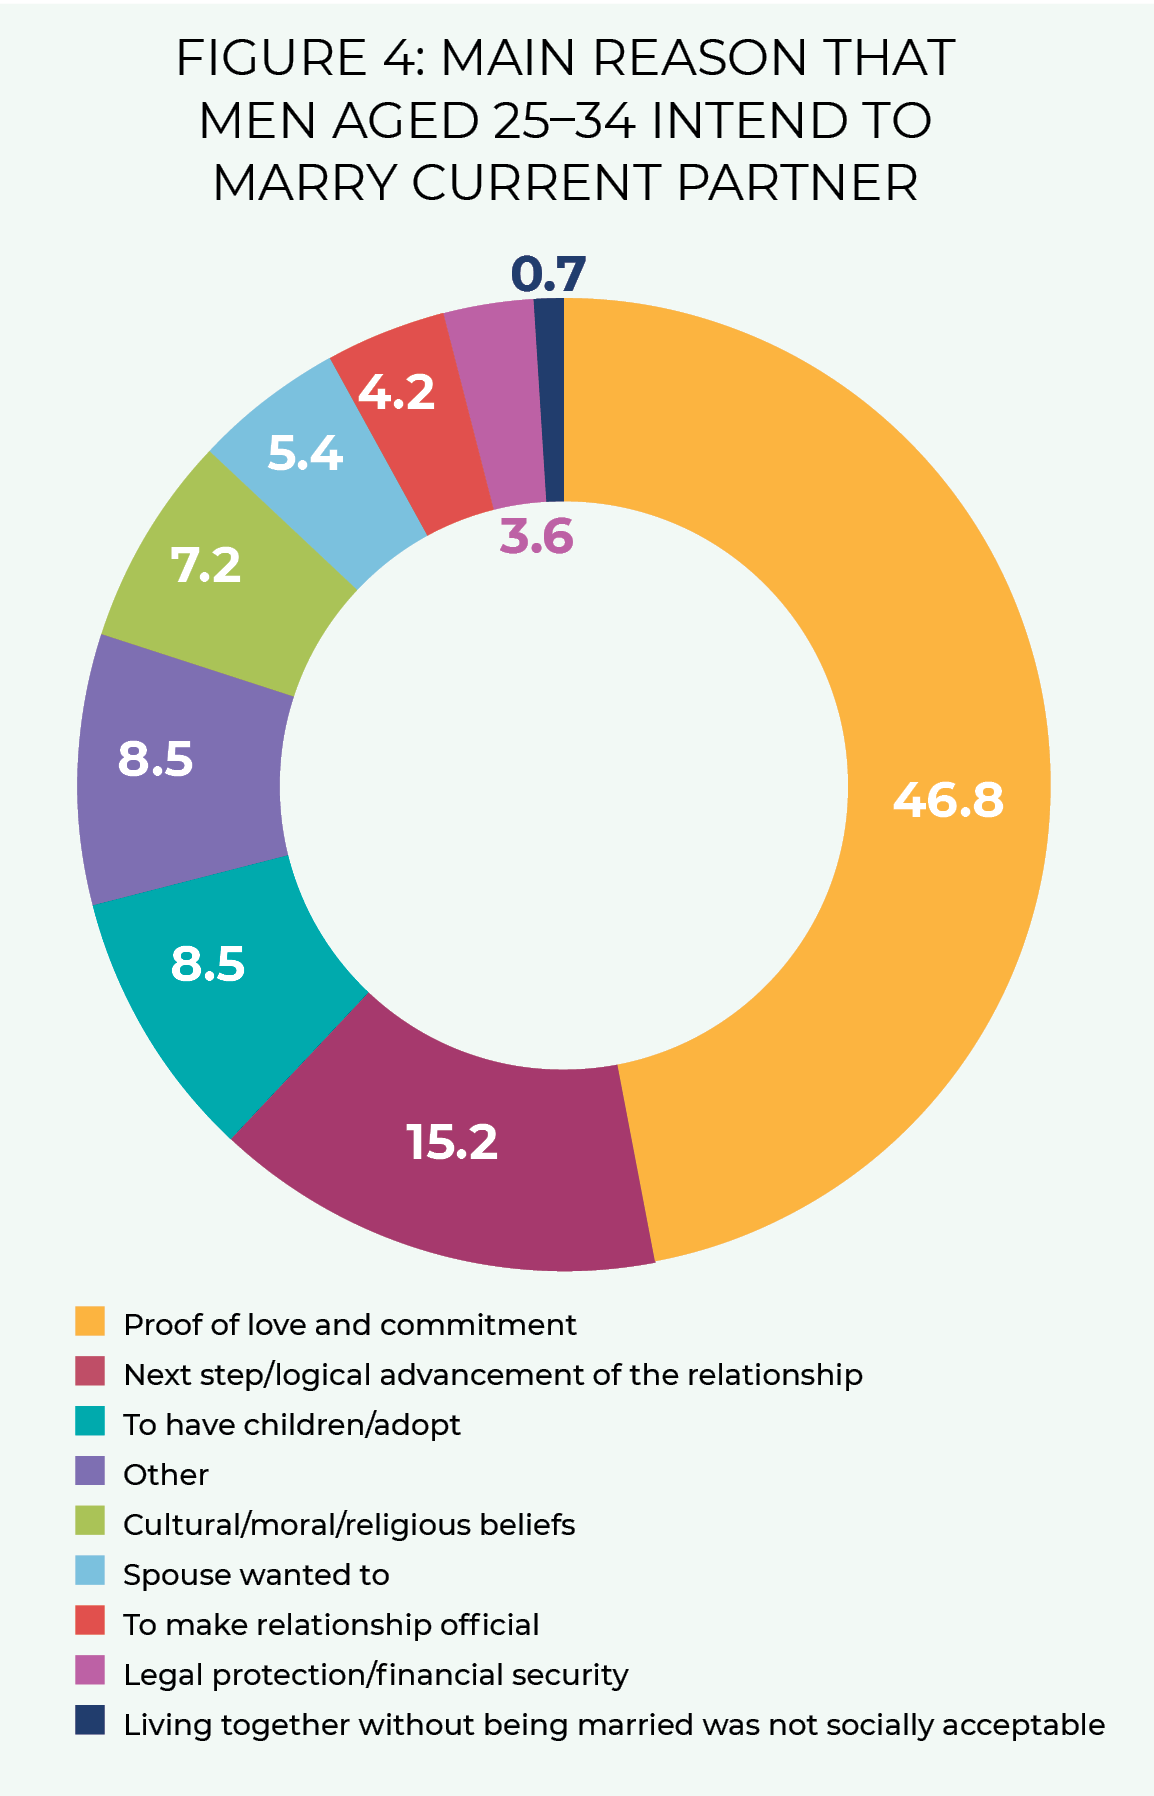
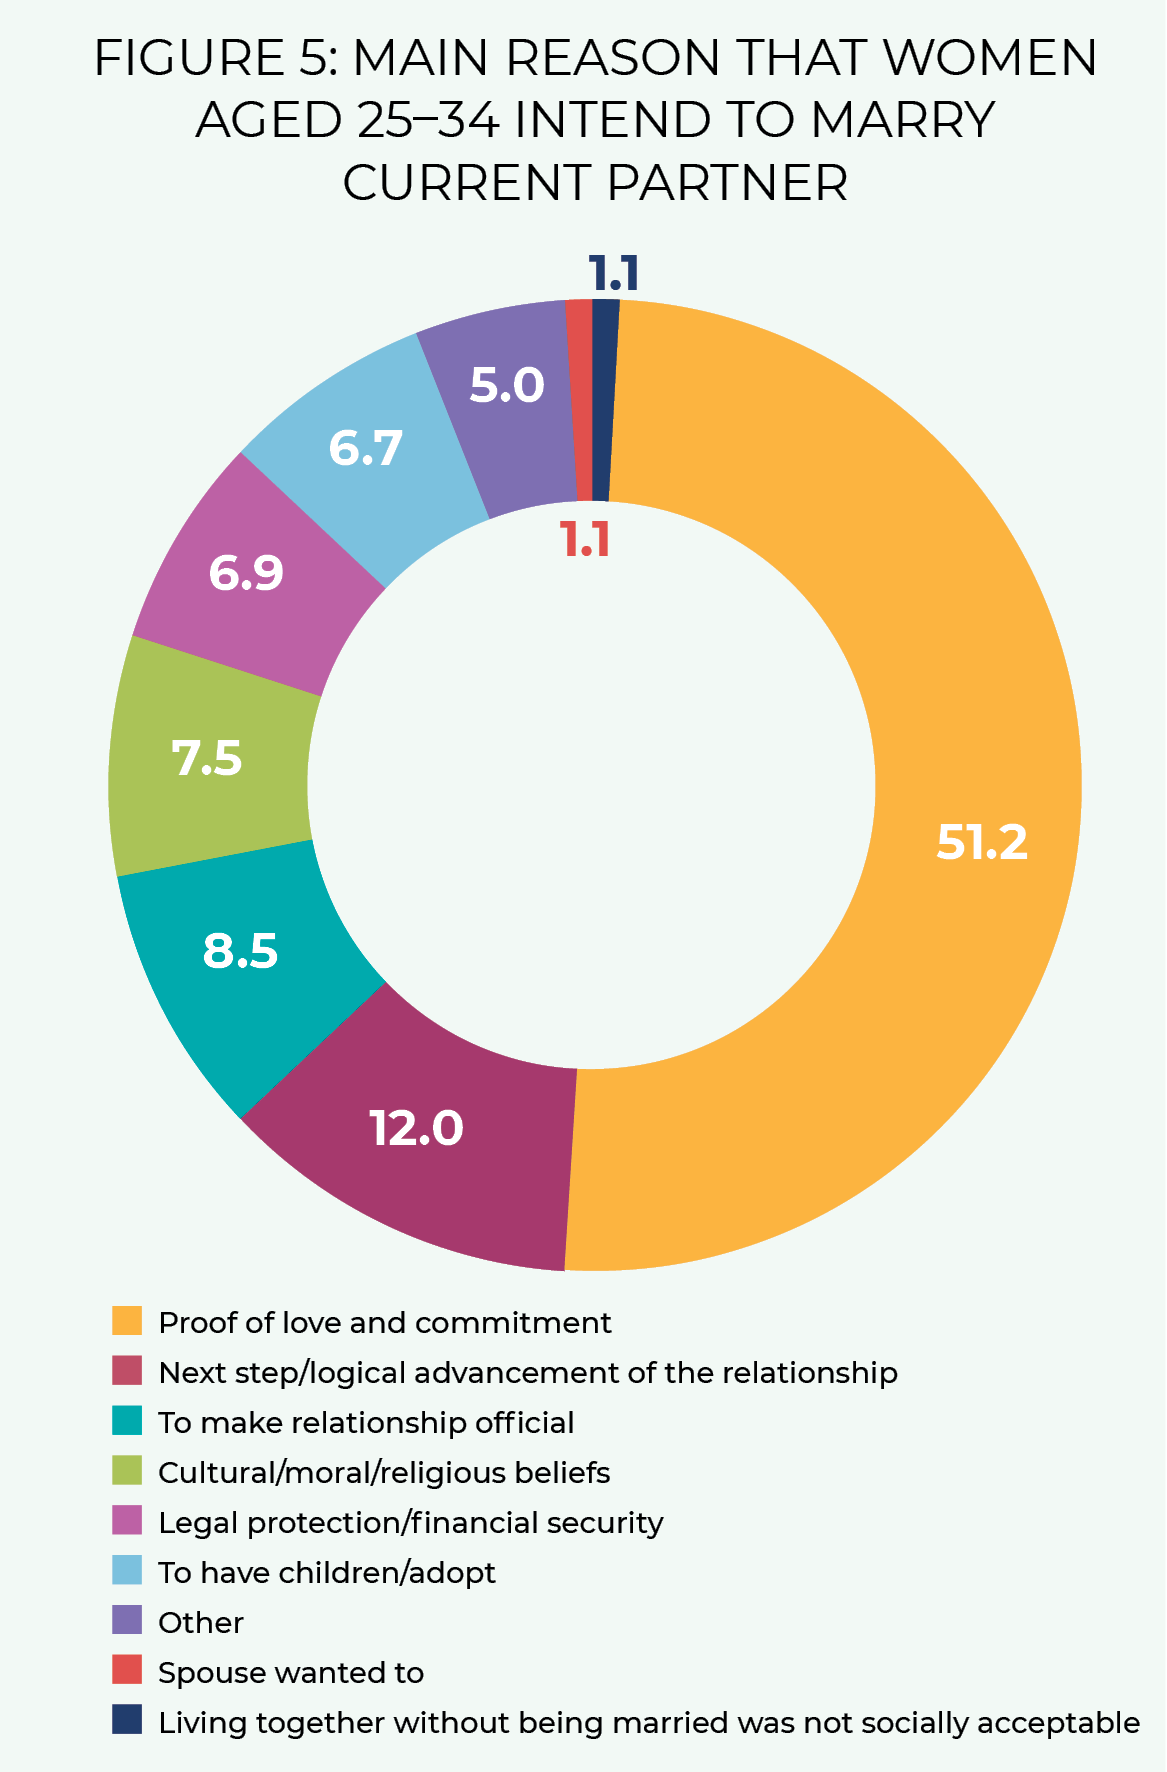
“Proof of love and commitment” and “next step/logical advancement” were the top two most frequently selected responses among young adult men and young adult women. “To make relationship official” (8.5%) was the third most frequently select response by men.
Among the cohort of interest, the least frequently selected main reasons were “spouse wanted to” (3.4%) and “living together without being married not socially acceptable” (.8%).
Legal protection and financial security ranked seventh for twenty-five to thirty-four-year-olds. This response was the third most selected response for thirty-five- to fifty-four-year-olds and the second most selected response for those age fifty-five and over.
Similar to the currently married young adult cohort, “proof of love/commitment” was the most frequently selected main reason to marry among young adults. Many young adults in this cohort viewed marriage as the “next step/logical advancement of the relationship.” As was the case with the married sample of young adults, legal protections and financial security were infrequently selected as a main reason to marry.
Couples Intending to Live Unmarried
The third question examined the main reasons that couples intend to continue living unmarried with their current partner. Respondents to this question indicated that they were living common law or in an intimate-couple relationship with someone they were not living with. Respondents were given ten response options, including an “other” option.
For the overall sample, the top three frequently selected responses for continuing unmarried were “current situation is fine as is” (37.8%), followed by “don’t believe in the institution of marriage” (24.3%), and “other” (12.9%). The order of frequencies for the top three main reasons were the same for men and for women.
For the cohort of young adults aged twenty-five to thirty-four, the main reason not to marry was “don’t believe in the institution of marriage” (43%), followed by “current situation is fine” (22.4%), and “wedding preparations and costs” (13%).
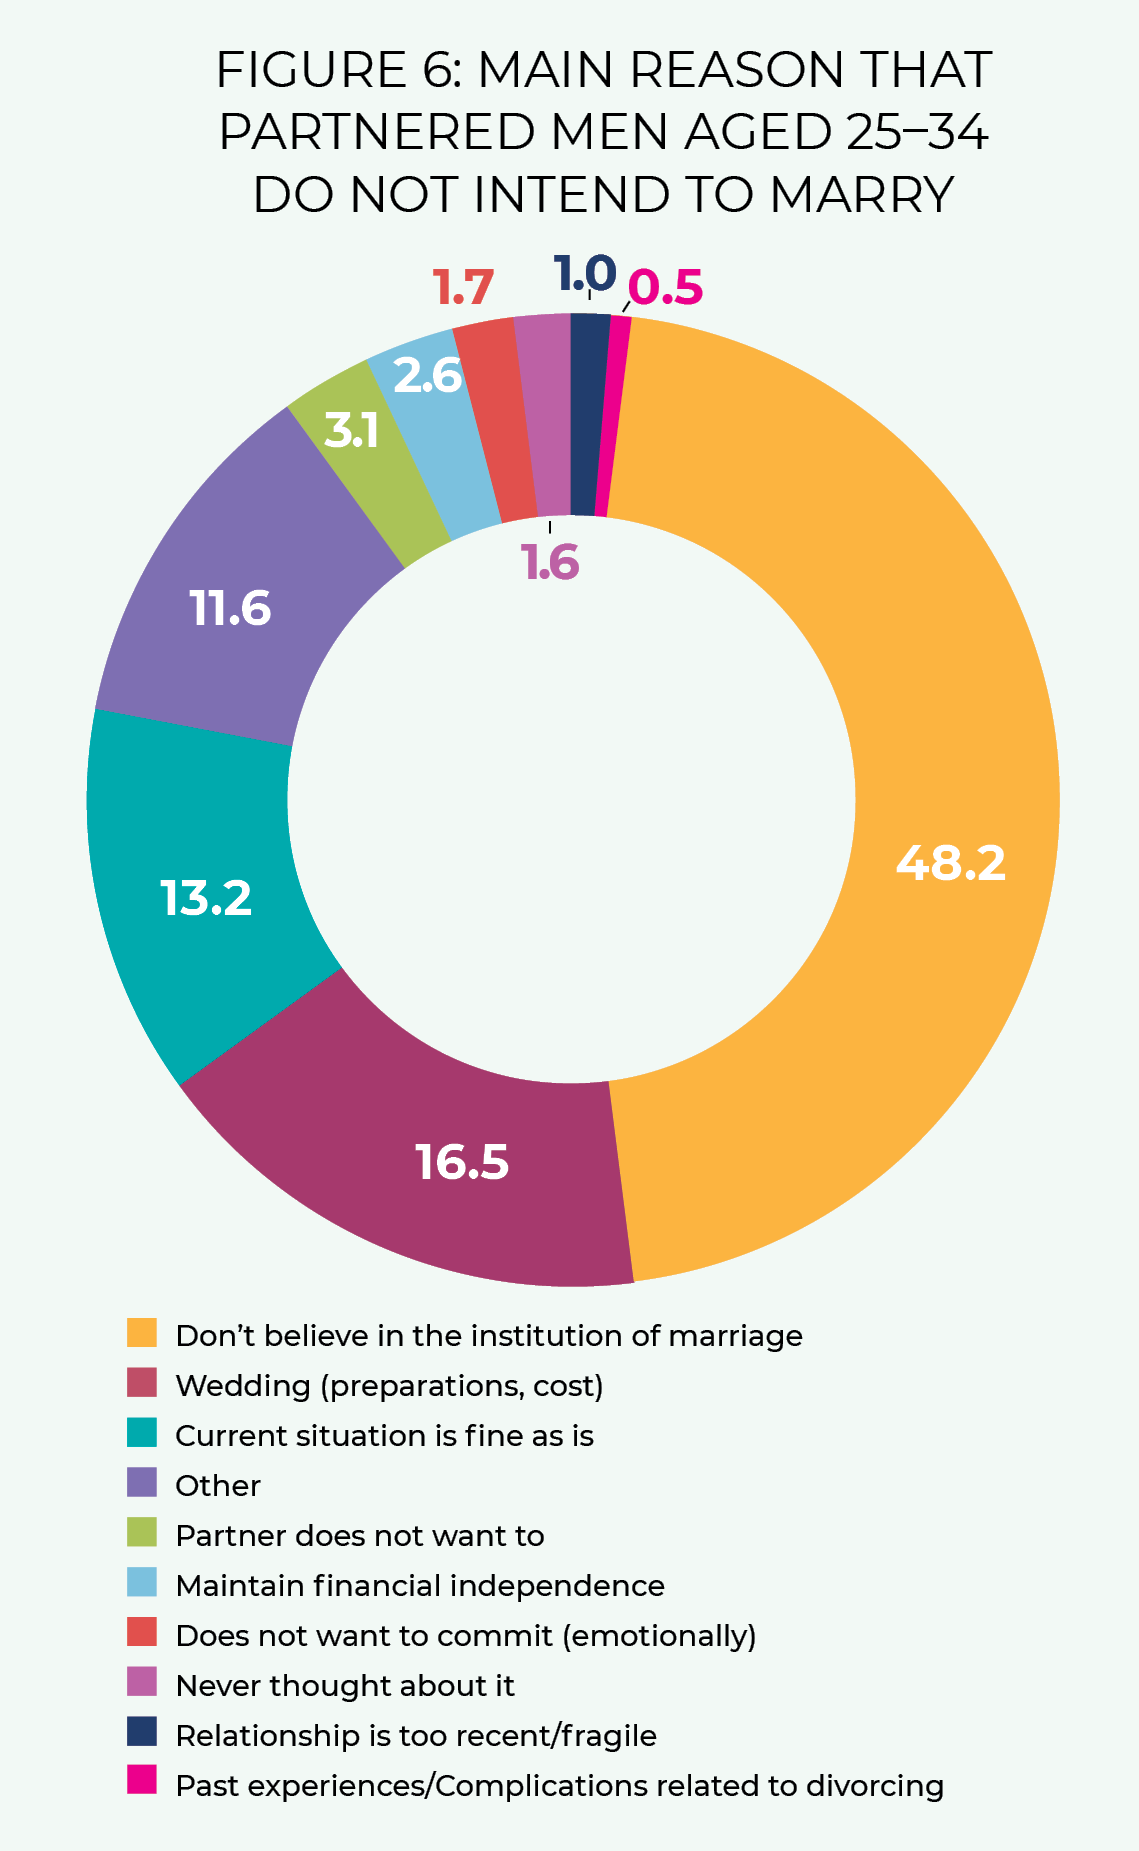
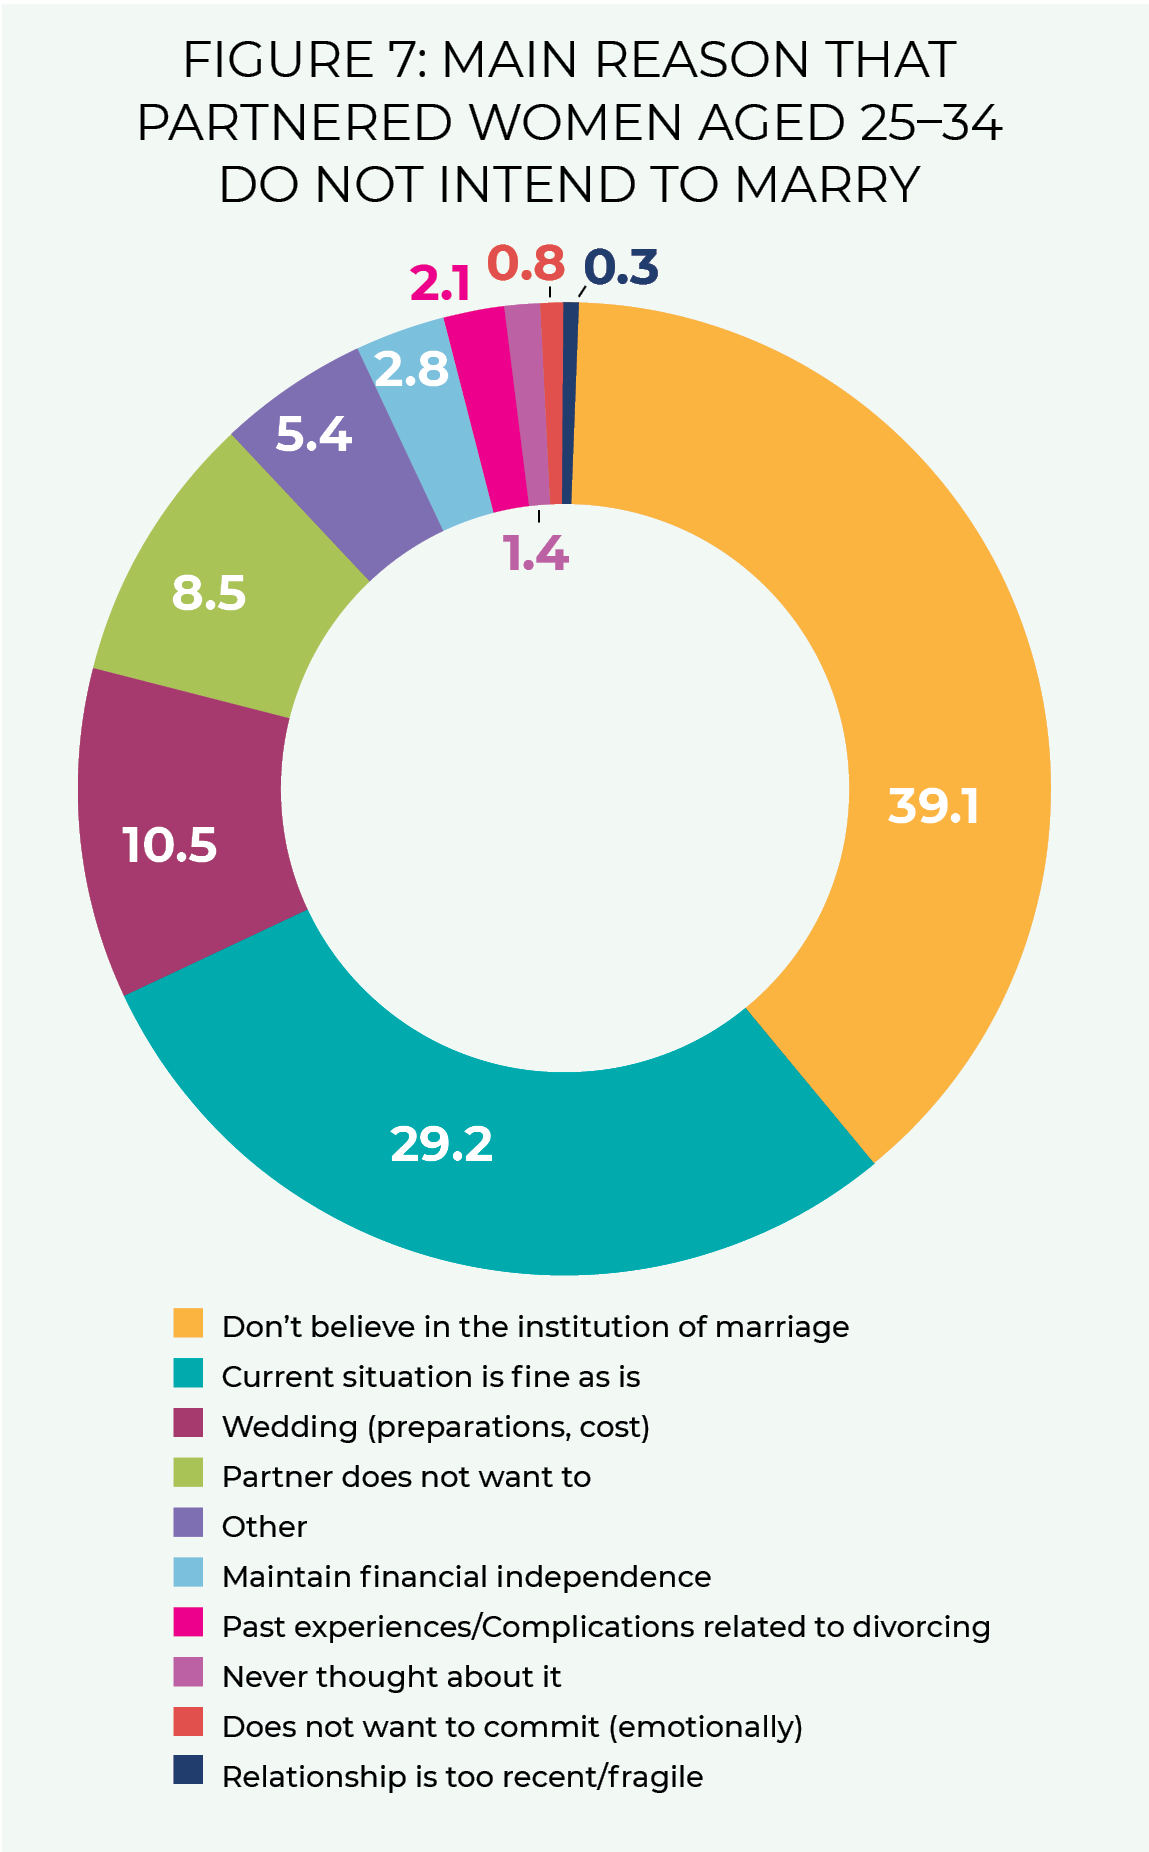
Men in this cohort most frequently selected “don’t believe in the institution of marriage” (48.2%), then “wedding preparations and costs” (16.5%), and “current situation is fine” (13.2%). Women most frequently selected “don’t believe in the institution of marriage” (39.1%), followed by “current situation is fine” (29.2%), and “wedding preparations and costs” (10.5%).
The least frequently selected reasons not to marry for the young adult cohort were “the relationship is too recent/fragile” (0.6%), and “does not want to commit” (1.1%), followed by “past experiences/complications relating to divorcing” (1.4%).
Young adult men’s least frequently selected responses were “past experiences/complications relating to divorcing” (.5%), then “relationship too recent/fragile” (1.0%), and “never thought about it” (1.6%). Women’s least frequently selected responses were “relationship too recent/fragile” (.3%), followed by “does not want to commit” (.8%), “and “never thought about it” (1.4%).
Of note, the young adult cohort significantly selected “don’t believe in the institution of marriage” as the main reason for continuing unmarried. “Never thought about it” was infrequently selected by young adults. This suggests that respondents’ views and opinions on marriage influenced their decisions about their partnership status.

Discussion: What Are the Main Reasons That Young Adults Marry?
Among already married young adults, “proof of love and commitment,” and “cultural / moral / religious reasons” accounted for the main reasons to marry for a significant portion of the sample. The third most frequently selected answer was that marriage was the “next logical step in the relationship.” These reasons were similar for men and women.
Among unmarried twenty-five- to thirty-four-year-olds intending to marry or likely intending to marry, “proof of love and commitment” and “next logical step” were the top most frequently selected response accounting for the majority of responses.
The most frequently selected response (“proof of love and commitment”) may have been interpreted by respondents in several ways. One interpretation is that getting married proves one’s love and commitment to the other person. It is also possible that respondents viewed this response as akin to signaling to friends, family, and society about the nature of the partnership, i.e., that they in fact were in a relationship of love and commitment. In both interpretations, marriage confirms and communicates the commitment level of the relationship. We wonder to what degree the decision to marry as “proof of love and commitment” is a confirmation to partners, or confirmation to friends, family, and the community.
Another interpretation we consider is that respondents married because they were already assured of their relational commitment. In this case, “proof of love and commitment” is the prerequisite for getting married. This interpretation reflects something similar to marrying because it is “the next logical step.”
When considering these responses, we wonder to what degree proof of love and commitment and marriage as the next logical step are culturally informed. Likewise, moral and religious reasons for marrying may be very personal, but they also reflect the shared values of a community or wider society. Our analysis does not illuminate the nature of the relationship between personal and cultural values, but it is possible that the combination of personal values and community influence shape the decision to marry.
The third most frequently selected reason to marry, among married women, was “living together without being married was not socially acceptable.” Yet for married women aged twenty-five to thirty-four, this reason was the second least selected reason to marry. This likely reflects the cultural shift that has occurred over the last number of decades in the social acceptance of living together outside of marriage. The absence of a cultural norm to marry is in itself a cultural influence on decisions about marital status.

Marriage is not merely a legal agreement, but it is legally recognized and comes with certain legal and financial protections and benefits. The dissolution of a marriage may require certain obligations, such as alimony and child support, that recognize the interdependence within marriage. Beyond legal benefits and obligations, marriage is associated with economic behaviours such as income pooling, saving, and investing. Legal protection and financial security were among the least frequently selected main reasons that young adults gave for marrying. Legal status and financial security have significant lifelong implications and young couples may value these benefits, but very few young adults selected this as their main motivation to marry.
These reasons were more frequently selected by older adults. It may be that legal and financial considerations are less important for young adults, who typically have fewer assets. It is also possible that lower importance placed on legal and financial security is correlated with lower financial literacy among young adults. 11 11 C. de Bassa Scheresberg, “Financial Literacy and Financial Behavior Among Young Adults: Evidence and Implications,” Numeracy 6 (July 1, 2013): https://doi.org/10.5038/1936-4660.6.2.5
Another speculative explanation for why legal and financial security were not selected more frequently as the main reason to marry is that that common-law couples in Canada (outside of Quebec, which has its own civil code) share many of the same legal rights and obligations as married couples.
Examining responses by partnered young adults who say they will definitely not or probably not marry their current partner is also instructive. One in two men and two in five women in the young adult cohort said that they were choosing not to marry because they “don’t believe in the institution of marriage.” As with those who choose to marry, there may be personal and communal values at play that our analysis is unable to illuminate further. We wonder what sources of cultural influences or communal values contribute to the juxtaposing views between those who marry and those who do not.
The survey data do not reveal how respondents perceive the institutional nature of marriage or what precisely they are rejecting about marriage. The data also cannot tell us how young adults form their opinions about marriage.
The next frequently selected response was that “the current situation is fine.” We wonder if respondents selecting this option see little difference between their relationship status and marriage, or if there are specific aspects of marriage that are unappealing to them, resulting in their preference for or contentment with their current situation.
Research suggests that there is a growing economic gap between those who marry and those who do not, and that economic barriers prevent some young adults from entering into marriage. As noted above, married respondents and those intending to marry did not frequently select “legal and financial stability” as their main reason to marry. Among young adults not intending to marry their current partner, “cost of wedding/preparations” (13%) was the third most frequently selected main reason. We note that cultural expectations about the size and scale of weddings and honeymoons may differ significantly and may contribute to the decision not to marry. Additionally, high student and consumer debt may also deter couples from entering into marriage.
We note that this study examines the main reasons to marry and does not identify prerequisites for entering marriage, such as income and financial stability. Further work from the General Social Survey data examining the income of respondents could provide some insight.
A pluralistic society respects that marriage is not for everyone. But marriage is associated with benefits for couples and their children, and for the wider society. Marriage is both a private and a public relationship. Healthy marriage contributes to family stability, with social and economic implications for neighbourhoods and communities. 12 12 A. Mrozek and R. Wallberg, “Private Choices, Public Costs,” Institute of Marriage and Family Canada, June 2009, https://www.imfcanada.org/sites/default/files/Cost%20of%20Family%20Breakdown%20final_0.pdf.
We wonder how an increased availability of information about the benefits of healthy, stable marriage would inform decisions about partnership. Community groups supporting young adults are best positioned to communicate the function and value of marriage in the private and public spheres. Previous work at Cardus has noted the opportunity for informed discussion of marriage in school-based sexuality curriculum. 13 13 A. Mrozek and R. Feddema, “Please Say Yes? Why Marriage Should Be Included in Modern Sexuality Education Curricula,” Cardus, December 6, 2018, https://www.cardus.ca/research/family/reports/please-say-yes/.

Appendix
Extended Methodology
The target population for the General Social Survey (GSS) 2017 includes all residents in Canada over the age of fifteen years (n = 20,602; weighted n = 30,302,287) in all provinces except the Yukon, Northwest Territories, and Nunavut. Full-time residents of institutions are not included. For further details on Statistics Canada stratification, survey sampling frame and collection strategies, data reliability, sampling variability, and error are available in the GSS 2017 user guide.
Analysis for this study uses Statistics Canada data microfile, metadata, and syntax command files (specific to statistical analyses software), codebook, and the GSS 2017 user guide. Metadata and syntax were edited in order to agree with the codebook. The syntax was then run to generate a system file used to perform data analyses using IBM SPSS statistical software.
Frequency analyses were run as follows:
- Based on overall unweighted respondent data, and also using the Statistics Canada weighted values extrapolated to the larger Canadian population. The output was aligned with the Statistics Canada frequencies per the codebook in order to ensure the accuracy of the created system file.
- Based on a comparison of the two sex categories of Male (49.4%) and Female (50.6%) using unweighted and weighted values. (Note: the responses to the SEX category were split on the binary and there were no responses under the “Don’t Know,” “Refusal,” or “Not Stated” categories provided by Statistics Canada.)
- Based on unweighted and weighted values by age group categories: (a) equal to and less than twenty-four years, (b) twenty-five to thirty-four years, (c) thirty-five to fifty-four years, and (d) equal to and greater than fifty-five years.
- Based on respondents’ sex (Male and Female) after dividing data into three specific age groups: (a) twenty-five to thirty-four years, (b) thirty-five to fifty-four years, and (c) equal to and greater than fifty-five years.

Basic Personal Weight
Following the Statistics Canada user manual (Sections 7.1, 8.4, 8.5), a basic person weight was assigned to each respondent (unweighted n = 20,602) to extrapolate the survey sample to the estimated national population over age fifteen years (weighted n = 30,302,287).

Minimum Sample Sizes for Estimate and Sampling Error
As per the GSS 2017 user’s guide, if analysis of variance calculations or other calculations of a given estimate are prepared, the number of persons or households contributing to the weighted values should not be less than fifteen, and weighted estimates should generally not be released regardless of the value of the coefficient of variation. As the current project is a reiteration of frequencies only, and no analyses of variance has been done, variables with less than fifteen respondents have not been excluded. Caution should be exercised in terms of extrapolating any comparative analyses beyond the frequency distributions reported herein.
Per Statistics Canada, confidence intervals for estimates of variance may be obtained under the assumption that estimates are normally distributed about the true population value, and chances are sixty-eight out of one hundred that the difference between a sample and the true population would be less than one standard error and about ninety-five out of one hundred that the difference would be less than two standard errors.
Response Category “Other”
As per the Statistics Canada GSS 2017 user’s guide, when the “Other” category had an option for write-in responses, Statistics Canada coded and distributed the written responses into existing categories when there was a match, or left them in “other-specify” if a match with an existing category was not possible. For the “Other” response category for the questions of interest for this project, no written responses were provided by Statistics Canada.
References
Angus Reid Institute. “‘I Don’t’: Four in Ten Canadian Adults Have Never Married, and Aren’t Sure They Want To.” May 7, 2018. http://angusreid.org/marriage-trends-canada/.
Bassa Scheresberg, C. de. “Financial Literacy and Financial Behavior Among Young Adults: Evidence and Implications.” Numeracy 6 (July 1, 2013): https://doi.org/10.5038/1936-4660.6.2.5
Britt-Lutter, S., C. Dorius, and D. Lawson. “The Financial Implications of Cohabitation Among Young Adults.” Journal of Financial Planning 31, no. 4 (2018): 38–45. https://www.onefpa.org/journal/Pages/APR18-The-Financial-Implications-of-Cohabitation-Among-Young-Adults.aspx.
Witherspoon Institute. Marriage and the Public Good: Ten Principles. Princeton, NJ: Witherspoon Institute, 2008.
Martinuk, S. “Marriage Is Good for Your Health.” Cardus, September 2016. https://www.cardus.ca/research/family/reports/marriage-is-good-for-your-health/.
Milan, A. “Marital Status: Overview, 2011.” Statistics Canada, July 2013. https://www150.statcan.gc.ca/n1/en/pub/91-209-x/2013001/article/11788-eng.pdf?st=7X49BIbv.
Mrozek, A., and R. Feddema. “Please Say Yes? Why Marriage Should Be Included in Modern Sexuality Education Curricula.” Cardus, December 6, 2018. https://www.cardus.ca/research/family/reports/please-say-yes/.
Mrozek, A., and R. Wallberg. “Private Choices, Public Costs.” Institute of Marriage and Family Canada, June 2009. https://www.imfcanada.org/sites/default/files/Cost%20of%20Family%20Breakdown%20final_0.pdf.
Nanos Research. “How Canadians Feel About Family Life.” Nanos Research, May 2016. https://www.cardus.ca/assets/data/images/2016/family/2016-809-Cardus-Familyandpartnership-ReportwithTabs.pdf.