Table of Contents
Table of Contents
Executive Summary
“The next winner could be you!” “100% of OLG proceeds have been invested in Ontario.” 1 1 OLG, “Home page.” Both are technically true; both are designed to portray government-run gambling as fun, harmless, and constructive. But they mask an unhealthy dependency. The slogans are a colourful façade that the province uses to cover a socially destructive addiction. And like any addiction, the government’s dependency ends up harming those it has a responsibility to help.
In this paper, we tell the story of Ontario’s involvement with gambling and explore how it got hooked. The state has not always been the leading dealer in gambling or user of the revenue it produces. In fact, gaming’s path from an illegal and suppressed activity to a legal one, and its eventual transmogrification into a lean, mean, revenue machine having the government’s full support and encouragement, was circuitous and filled with ironies and unintended consequences.
Recent provincial governments have pursued lottery and casino revenue with gusto, often overlooking or downplaying the problems that arise from their dependency on the billions that gambling provides to the provincial treasury. As our analysis of the economics of gambling revenue, and our review of the demographic data of Ontario’s lottery and gaming players show, the state’s gambling monopoly operates as a tax on the marginalized—preying on the poor and those who are playing hard to join them.
So what can be done about the government’s gambling problem? We offer a program for Ontario’s recovery, aimed at building a policy framework that enables the poor and builds good economic habits for government and citizens alike.
Given that OLG (Ontario Lottery and Gaming Corporation) profits are extracted disproportionately from those on the margins, gambling funds should not be lumped in with general tax revenue to be used the same way. Instead, we make the case for putting this money back in the hands of the poor. Direct redistribution to low-income households would be one way to accomplish this. Alternatively, the government could use OLG revenue to help the poor build savings. The sudden spike of layoffs created by the COVID-19 outbreak has made the need for savings more obvious than ever, with an unprecedented number of households facing an unexpected loss of income. The financial shock of the pandemic, and the almost complete decline of provincial revenues from gambling provide an unprecedented opportunity for the province to cut its addiction to OLG profits cold turkey and to rebuild its economy with structures that are healthy, just, and prosperous for all. Breaking the harmful cycle of dependency will not be easy, but the rewards of getting clean are well worth it. It’s time for Ontario to quit its bad gambling habit and pick up some good habits instead.
From Morality to Money-Making Monopoly: A Brief History of Gambling and the State
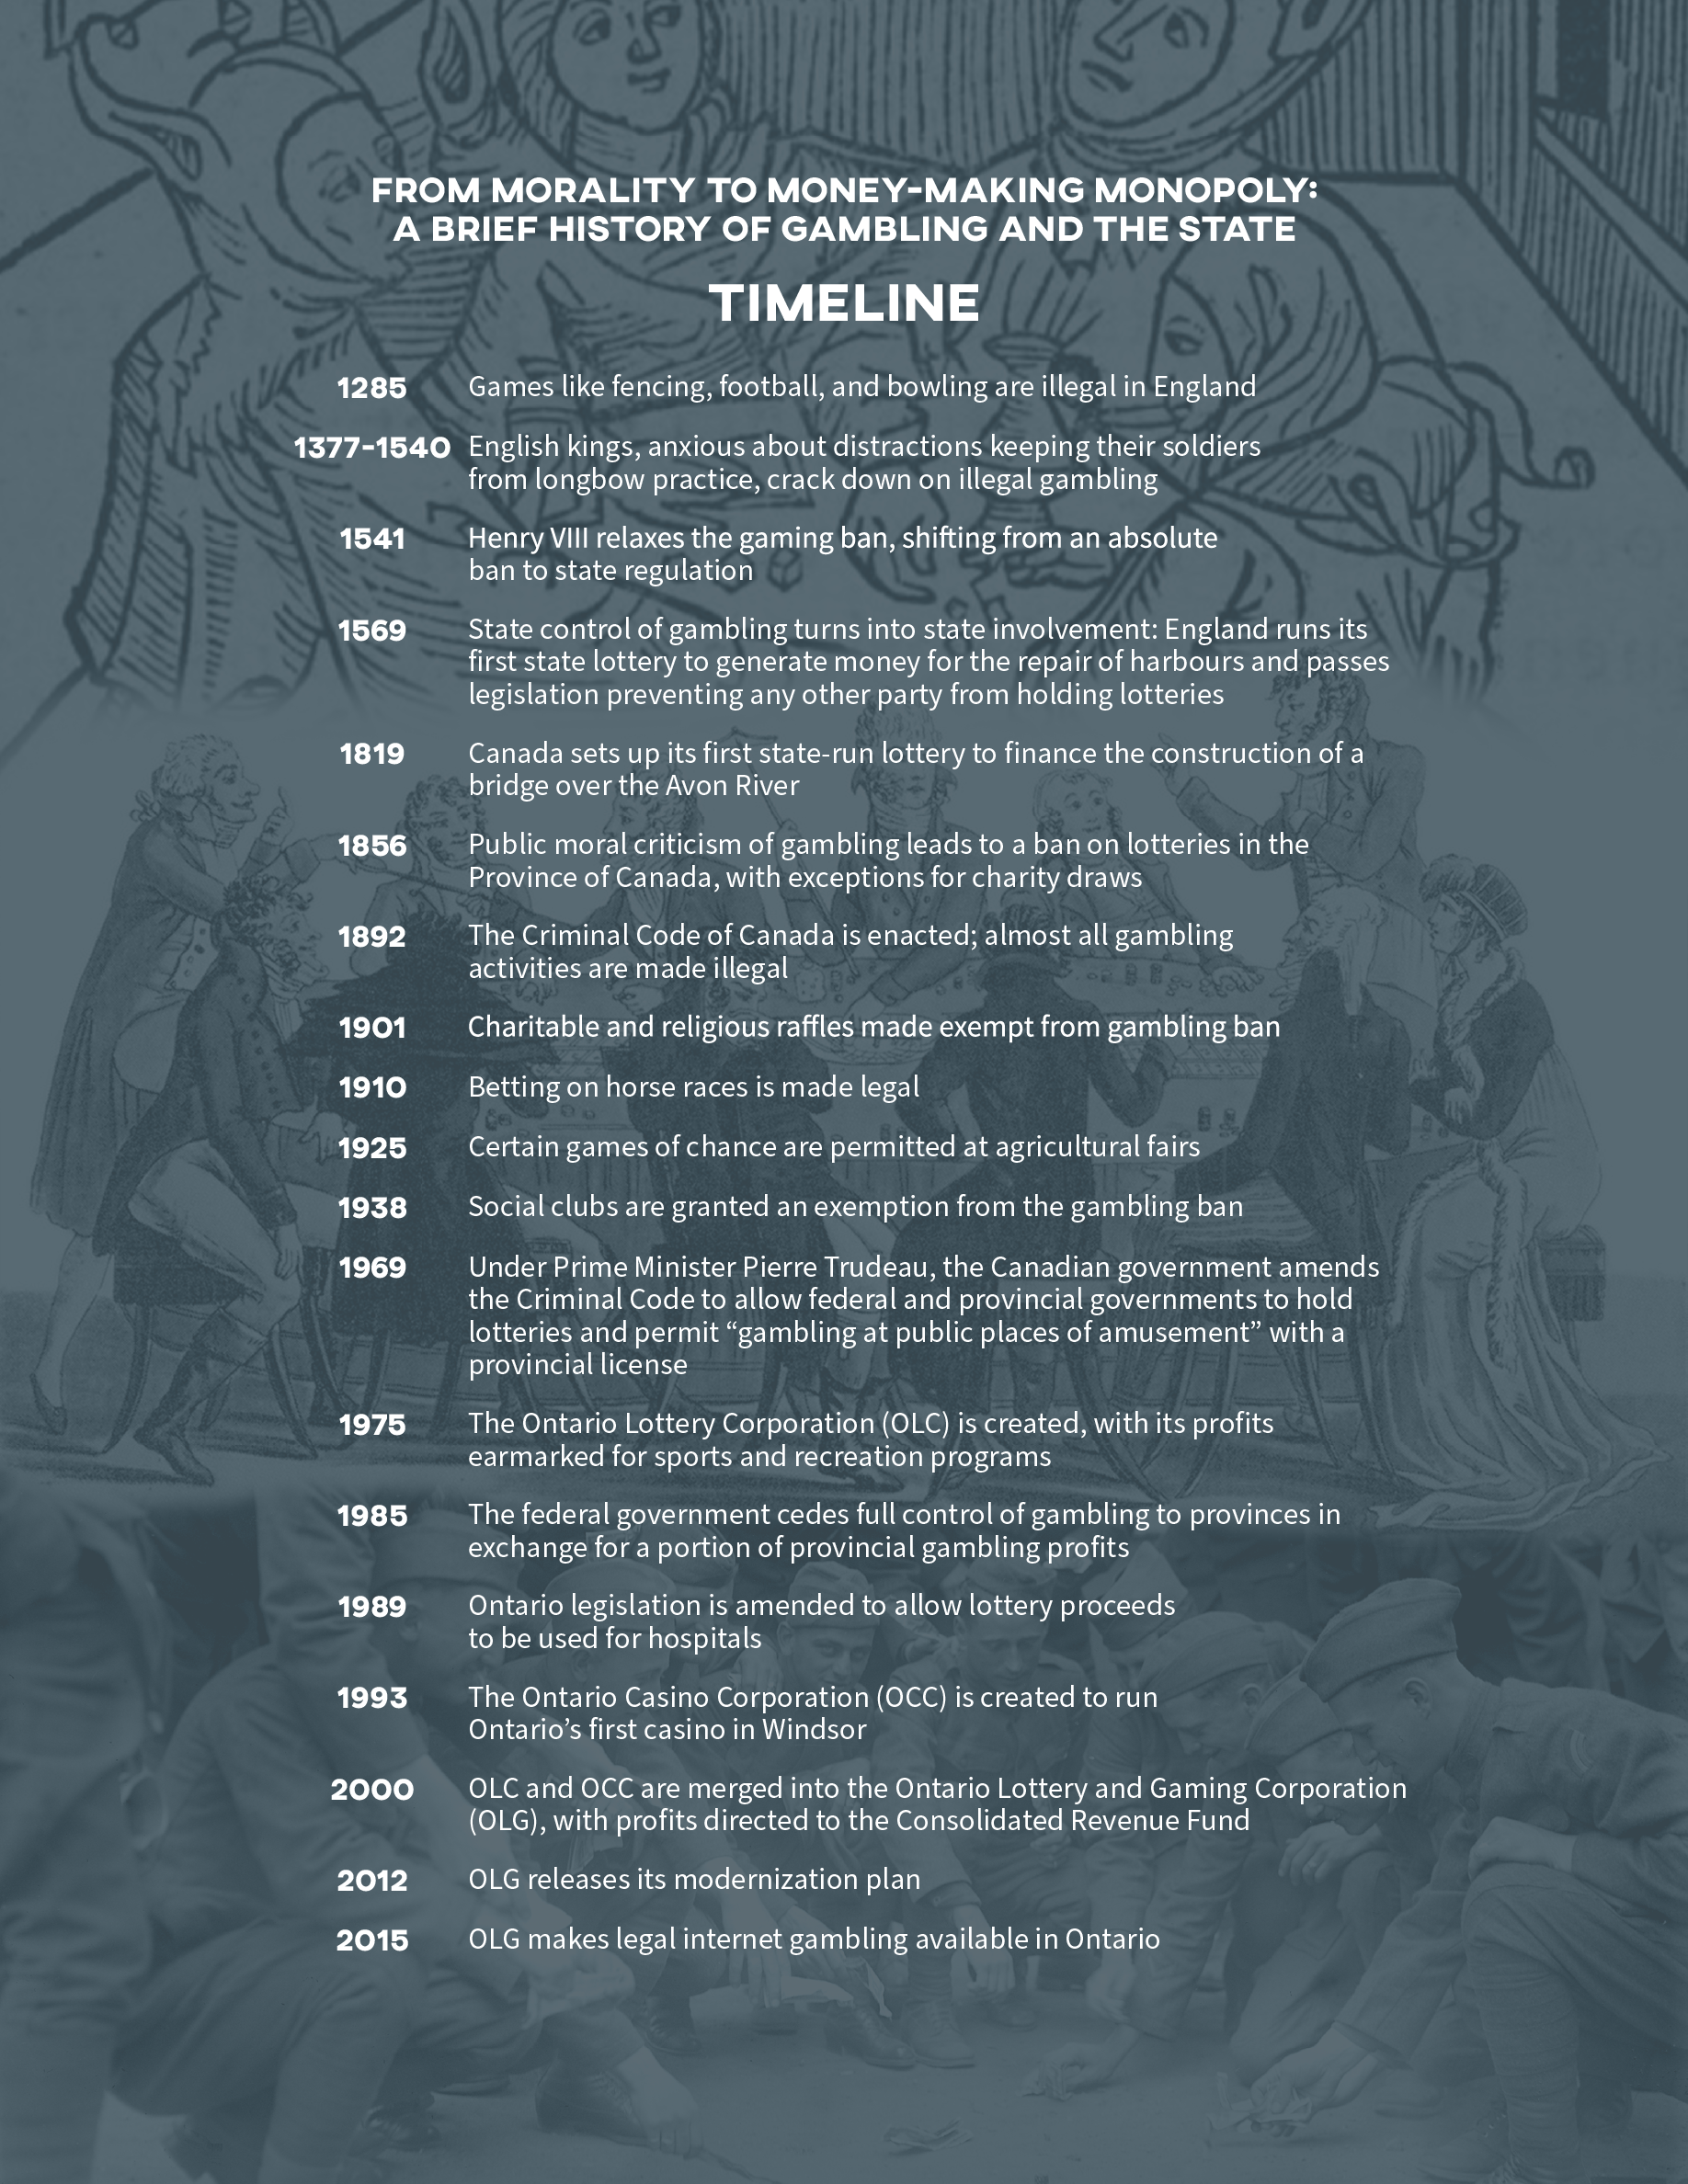
The history of gambling legislation in Ontario is long and complicated. Like many of our laws, its roots are found across the pond in England. 2 2 Robinson, History of the Law of Gaming, 2. The earliest prohibitions against various games set the tone for the state’s relationship to games of chance in the centuries that followed: gambling was a vice that the state had a responsibility to restrain among its population. 3 3 See Belanger, Gambling with the Future, 36. These bans targeted the “inferior classes,” the prevailing sentiment being that “gaming was a diversion among gentlemen, but a pernicious vice among the poor.” 4 4 Belanger, Gambling with the Future, 5. It is worth noting that this attitude foreshadows our current situation: a poor person who spends money on lottery tickets is irresponsible, but a government that takes this money is being prudent. Even as gaming laws gradually shifted from banning gambling outright to regulating it, the system remained biased toward the rich: only the wealthy could afford licences to operate a gambling house. 5 5 Robinson, History of the Law of Gaming, 11–15.
The next shift in gaming policy was the move from state control to state involvement. In 1569, the first lottery run by the English state was drawn for the repair of harbours. A slew of other state-run lotteries followed on both sides of the Atlantic, as did legislation that prevented all but the state from holding lotteries. 6 6 “At one point all thirteen colonies of the original United States employed lottery schemes and encouraged their citizens to play as a civic responsibility” (Belanger, Gambling with the Future, 42). See also Robinson, History of the Law of Gaming, 13–15.
By this period, the suppression of gambling was less a matter of maintaining public morality than maintenance of a government monopoly. The English government was involved in the sale of lottery tickets, dice, and playing cards, making money on both the sale of gambling services and the collection of fines for unlicensed gaming operations. 7 7 Robinson, History of the Law of Gaming, 32-33. Early Canada’s official stance on gambling was shaped by both the legislation and the moral ambivalence it inherited from Britain. 8 8 Seelig and Seelig, “‘Place Your Bets!’” 92; Smith, “Nature and Scope,” 706.
Lotteries were a key way for cash-strapped colonies to finance major public projects: Canada set up its first state-run lottery to build a bridge over the Avon River in 1819. 9 9 Barmaki, “Gambling as a Social Problem,” 49; Robinson, History of the Law of Gaming, 45; Morton, At Odds, 7–8. Gambling was not, however, without its opponents, the most vocal of which tended to hail from Protestant churches. Yet efforts to tighten gambling restrictions met fierce opposition from Francophones in Catholic Quebec, who resisted what they felt to be the imposition of English Protestant values. 10 10 Morton, At Odds, 8–11. In 1856 the Province of Canada made it illegal to hold draws or sell lottery tickets, but the Catholic Church pressured the government of Canada East to loosen the restrictions and allow charity lotteries offering non-cash prizes. Barmaki, “Gambling as a Social Problem,” 49.
When the Criminal Code of Canada was first enacted in 1892, the “Offenses against Religion, Morals, and Public Convenience” section set strict limits on gambling, outlawing (at least officially) almost everything beyond informal private bets. 11 11 Campbell, Hartnagel, and Smith, “Legalization of Gambling in Canada.” Slowly but surely, a series of seemingly minor amendments loosened this legislation and facilitated the expansion of legal gambling into the twentieth century. 12 12 Campbell, Hartnagel, and Smith, “Legalization of Gambling in Canada,” 13–14; Robinson, History of the Law of Gaming, iii; Smith, “Gambling in Canada,” 707. Charitable and religious raffles were among the first to win exemptions from the gambling ban. Keeping with the theme that “gambling was acceptable for elites that possessed both money and ‘self control’ but was dangerous for working-class Canadians,” betting on horse races—the purview of the rich—was close behind. 13 13 Morton, At Odds, 12. New restrictions on various games of chance were introduced in 1922 after a wartime gambling surge, though many of these games were given exemptions for agricultural fairs three years later. By 1938, permission to run gambling activities was extended to social clubs as well. 14 14 Campbell, Hartnagel, and Smith, The Legalization of Gambling in Canada, 14; Morton, At Odds, 11.
These incremental adjustments paved the way for a major shift in the second half of the century. In 1969, prime minister Pierre Trudeau passed an omnibus bill that, among other things, permitted federal and provincial governments to hold lotteries and allowed “gambling at public places of amusement” with a provincial license. 15 15 Campbell, Hartnagel, and Smith, “Legalization of Gambling in Canada,” 17–18. While shifting moral standards in Canadian society were working in the background, the immediate catalyst was a cash shortage: Quebec, desperate for new revenue to fund Expo 67 and the 1976 Montreal Olympics, had been urging Ottawa to allow provincial lotteries. 16 16 Cosgrave and Klassen, Casino State, 122. After Trudeau’s 1969 changes, provincial gambling operations skyrocketed. Lotteries proved so lucrative, in fact, that federal and provincial governments spent the next decade fighting over who should receive the profits. The conflict was eventually settled with a compromise in 1985, when the Criminal Code was amended to give provinces full control of gambling in exchange for sending the federal government a portion of received revenue: $100 million for the 1988 Calgary Olympics, and a total of $24 million—indexed to inflation and divided according to each province’s respective share of sales—every year thereafter. 17 17 Campbell, Hartnagel, and Smith, “Legalization of Gambling in Canada,” 15–21. The federal-provincial agreement is dated 1979, with funds indexed to inflation from the same year. In 2018–19, the Canadian federal government’s proceeds from lotteries were just under $75.9 million. Government of Canada, Public Accounts of Canada 2019, 2:151.
With these changes to the Criminal Code in place, Ontario and other provinces could control the gambling within their respective jurisdictions. This was a critical turning point, providing a new way to pull in more cash without touching tax rates. This provided an enticing opportunity for provinces that lacked Ottawa’s level of control over corporate and personal taxes. 18 18 Cosgrave and Klassen, Casino State, 122-3.
Gaming was seen as a form of public entertainment, and the relatively modest profits returned by the Ontario Lottery Corporation (OLC), OLG’s predecessor, were invested in other forms of public entertainment. The Ontario Lottery Corporation Act, which created the OLC in 1975, limited the use of lottery proceeds “to the promotion and development of physical fitness, sports, recreational and cultural activities and facilities thereof.” 19 19 Ontario, “C. 126 The Ontario Lottery Corporation Act, 1974”; see also Dijkema, “Government Addictions.” When the province spent its first gambling cheque on a TVO expansion in 1980, the government made sure to point out that it was going to cover only the capital costs of the endeavour:
As honourable members know, the Ontario Lottery Corporation Act dedicates Lottario proceeds to cultural and recreational activities and facilities. This is the very first Lottario allocation that has been made. Frankly, I cannot think of a more useful way to spend the money. I would emphasize that only the one-time capital investment in this extension is coming from lottery proceeds. We will not be depending on lottery proceeds for the continuing operation of the new facilities. 20 20 Ontario Legislative Assembly, Hansard, 31st Parl., 4th Sess., November 18, 1980; see also Dijkema, “Government Addictions.”
Subsequent years saw the province moving steadily, if imperceptibly, away from its “games for games” approach, and its commitment to use funds solely for capital expenses. Over time, the list of expenditures for gambling monies grew. In 1989, OLC legislation was amended to allow gambling profits to be used for hospitals. 21 21 Ontario, “Ontario Lottery Corporation Act, R.S.O. 1990”; OLG, “Our History: 1989–1975.” A few years later, “protection of the environment” was added to the list as well. 22 22 Ontario, “Ontario Lottery Corporation Act, R.S.O. 1990”; OLG, “Our History: 1999–1990.”
Several MPPs expressed alarm when these changes were first introduced to the legislature, pointing out that it would be impossible to track how lottery money was used. As one MPP remarked when the environment was added to the list of lottery beneficiaries:
There is no special accountability for the expenditure of the lottery funds so appropriated by the Legislature beyond the usual standing committee on estimates and standing committee on public accounts review after the event. In fact, I am saying that in Bill 114 the vague phrase “for the protection of the environment” is absolutely meaningless. 23 23 Ontario Legislative Assembly, Hansard, 34th Parl., 2nd Sess., May 29, 1990, at 1520.
These fears proved to be well grounded. The dangers of having “lottery funds go into the big, black hole of the bottomless pit of the consolidated revenue fund,” 24 24 Ontario Legislative Assembly, Hansard, 34th Parl., 2nd Sess. June 26, 1990, at 1550. as another MPP put it, were obvious to lawmakers even then:
What this bill is saying and what this government wants to do is take all the profits of the lotteries and pay them into the consolidated revenue fund, which is that whole pool of money that comes just like every other tax in the province comes and is paid into the consolidated revenue fund. Once it is in there, the cabinet “in such manner . . . may direct to be available [sic] for appropriation by the Legislature.” . . . You do not have to have a paranoid mentality to see what is possible with this bill. 25 25 Ontario Legislative Assembly, Hansard, 34th Parl., 1st Sess., February 28, 1989, at 1600.
Indeed, one does not have to be paranoid to point out that slippery slopes are indeed slippery.
By the time the Ontario Casino Corporation (OCC) was set up in 1993 to run Ontario’s first casino in Windsor, the government had abandoned the “games for games” pretense altogether: casino revenues would be piped directly into the Consolidated Revenue Fund. 26 26 Ontario, “Ontario Casino Corporation Act, 1993.”
In what is surely one of the most tragic of ironies in Canadian history, Floyd Laughren, the NDP MPP for Nickel Belt who so perspicaciously described the implications of moving gaming revenues into the Consolidated Revenue Fund, was the finance minister who introduced casinos into Ontario.
With the merging of the OCC and the OLC into the Ontario Lottery and Gaming Corporation (OLGC, later rebranded OLG) in 2000, 27 27 OLG, “Our History: 2004–2000”; OLG, “Our History: 2009–2005.” the last connection between gambling money and specific public entertainment projects vanished. Gambling revenues are now pocketed by the government to use however it sees fit. 28 28 Ontario, “Ontario Lottery and Gaming Corporation Act, S.O. 1999.”
This brings us to today’s Ontario, where gambling is treated not as a vice the state should restrain but rather as a source of income the state can—and should—encourage. The province treats its gambling manager as a revenue generator, an identity that OLG has fully embraced. According to the Ontario Ombudsman’s 2007 report on OLG and fraud, “The OLG had become fixated on profit rather than public service. It had come to define itself by its role as a cash cow.” 29 29 Marin, “Game of Trust,” 11. Thus OLG’s ongoing modernization plan under the Liberal government, which began in 2010: as Globe and Mail columnist Adam Radwanski commented, “Now, for the first time, it will be purely about profit. With what is somewhat euphemistically described as a ‘more market-driven and consumer-responsive strategy,’ Ontario will try to milk every single dollar there is to be spent.” 30 30 Radwanski, “McGuinty Can’t Afford Misgivings”; OLG, “Modernizing Lottery and Gaming in Ontario.”
As this history shows, governments of all ideological stripes have participated in creating and have profited from the reality we have today. Addiction has a way of eating away at even the most principled among us.
History, as it turns out, tends to repeat itself. Consider the following opposition member’s statement on the provincial government’s proposal to move gambling money into the general revenue fund:
They’ve subverted [the act] by taking the dollars out of a transparent, accountable process and slipping it into the government’s back pocket, where they can begin to distribute money in any way they choose to do so without accountability to an act. Before, when the lottery dollars came in, they would have to demonstrate to the public that they actually did with the money what the lottery act said that they should do with the money. Now, instead, they could decide on any average day to reduce the amount of money put out in the lottery fund by, let’s say, 50 per cent and would not have to be accountable to any kind of an act. 31 31 Alberta Legislative Assembly, Hansard, 30th Leg., 1st Sess., October 29, 2019, at 2064.
Yet this quote comes not from 1989 Ontario, but from 2019 Alberta, which took the same approach to a cash crunch as its counterpart in Ontario had thirty years earlier: siphoning gambling profits into the province’s general coffers. 32 32 Alberta Legislative Assembly, Bill 20. Like a tumbler of whiskey placed in front of an alcoholic, a fund full of gambling money is irresistible for cash-strapped provinces. But could this enticing stream of non-tax revenue be too good to be true?
Where the Chips Lie
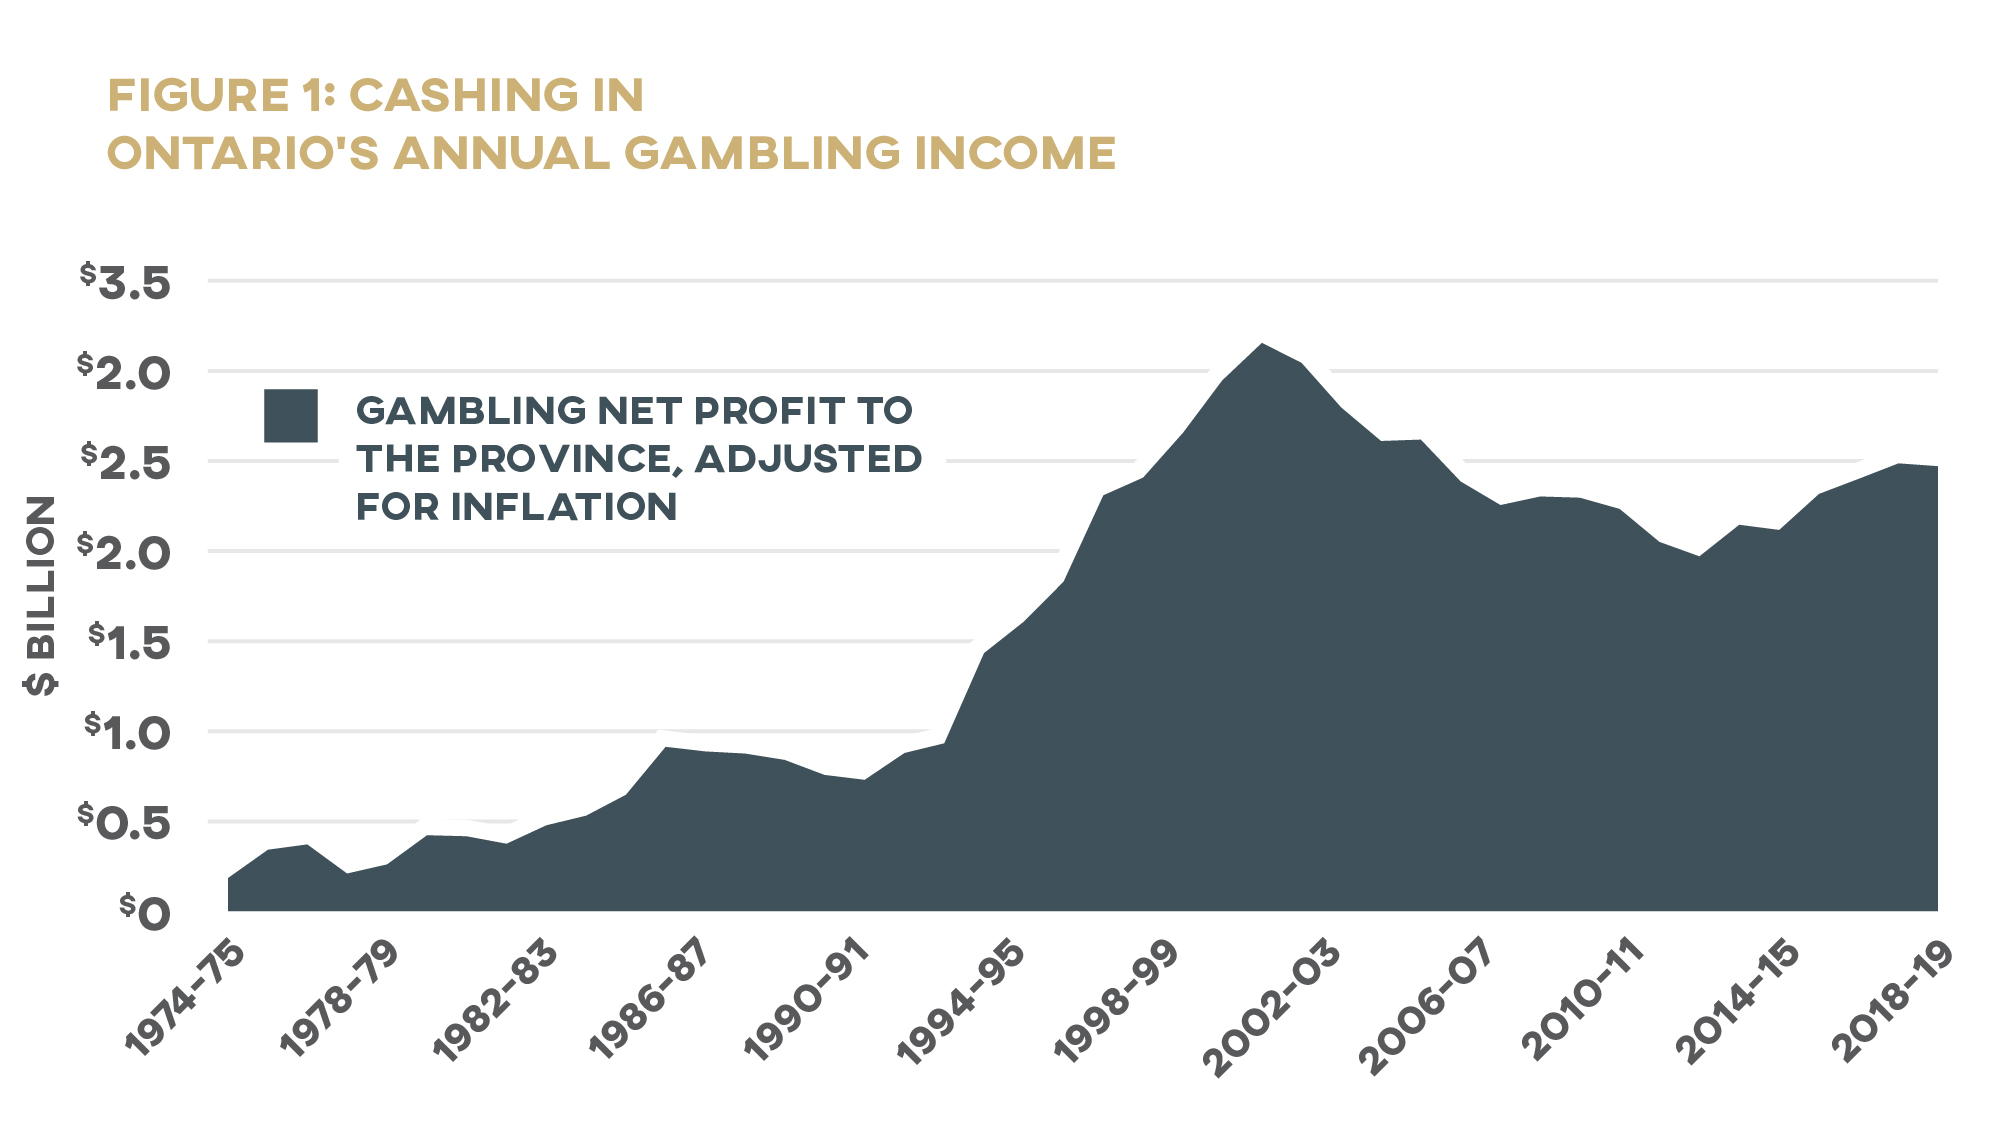
Today, OLG is well on track to achieve its stated goal of “generating greater and more sustainable Net Profit to the Province.” 33 33 OLG, “Modernizing Lottery and Gaming in Ontario,” 2. One need look no further than OLG’s own financial statements to see the fruits of its aggressive new strategy. Ontario’s first year of government-sponsored gambling, 1975, generated a modest $43 million for the province; four decades later, gambling contributes over $2 billion to provincial coffers.
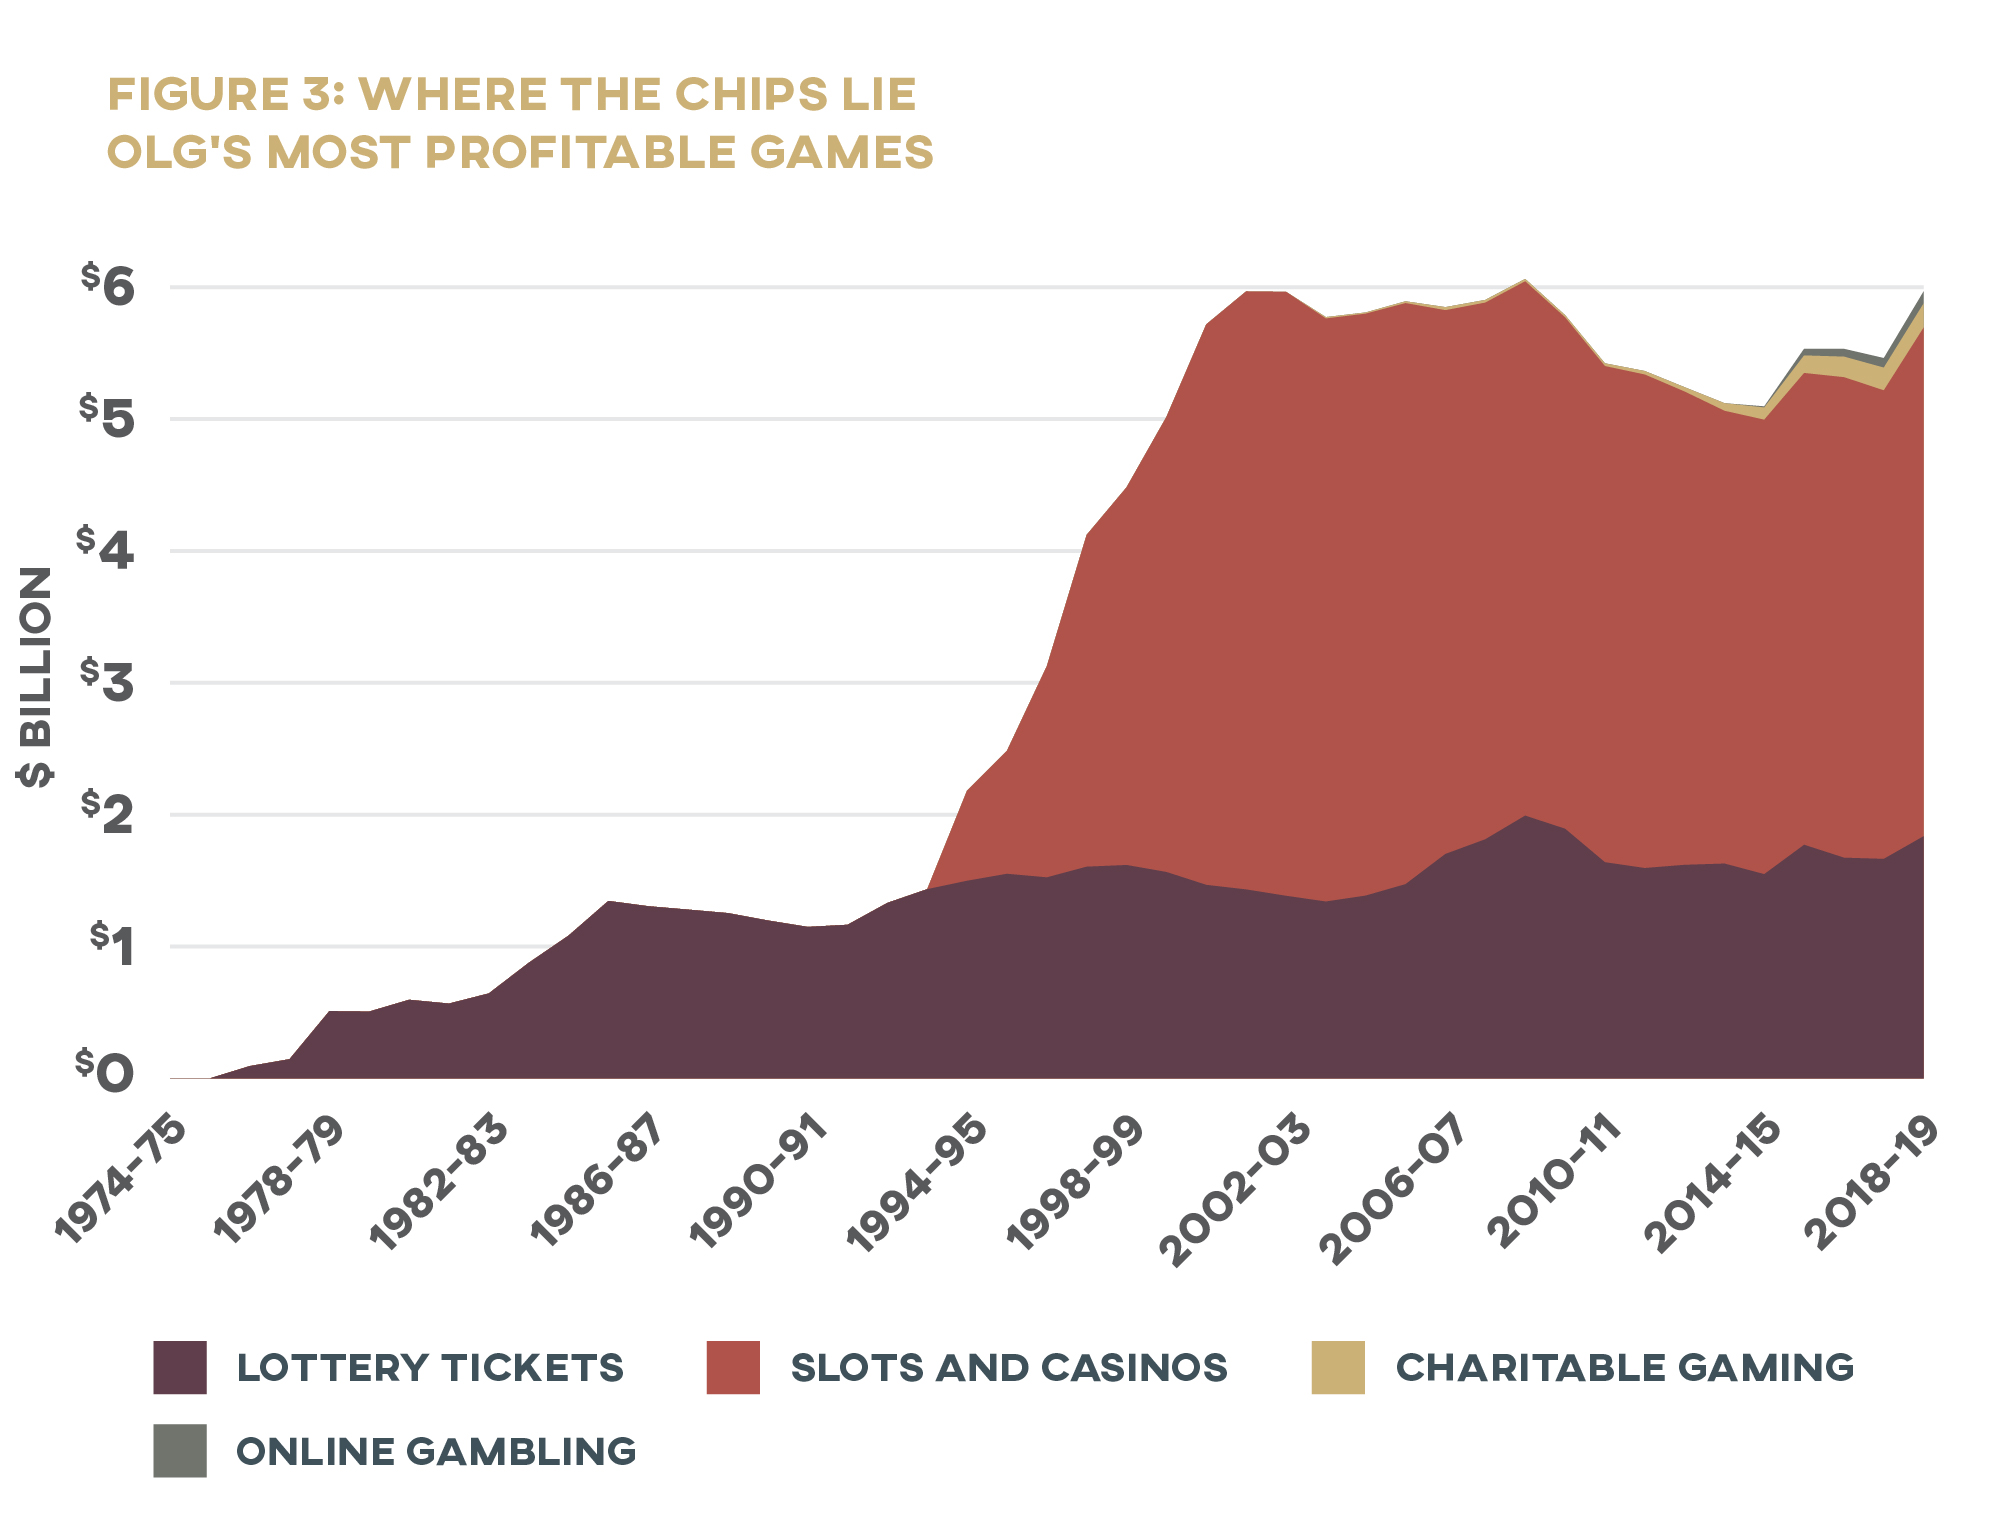
OLG’s revenue comes from a range of gambling operations. According to its 2018-19 report, the largest share of gambling revenue comes from the lottery, which took in about half of total proceeds at $4.2 billion. The other major revenue source is land-based gaming (the business line that includes slots and casinos—such as Woodbine or Kawartha Downs—and resort casinos such as Fallsview), bringing in another $3.9 billion. 34 34 OLG, “Annual Report 2018–19.” While these two business lines take in similar shares of revenue, there is a significant difference in their profit margins: the lottery’s net profit to the province is less than $1.2 billion (barely 28% of proceeds), while land-based gaming contributes over $1.6 billion (42% of proceeds) to provincial coffers.
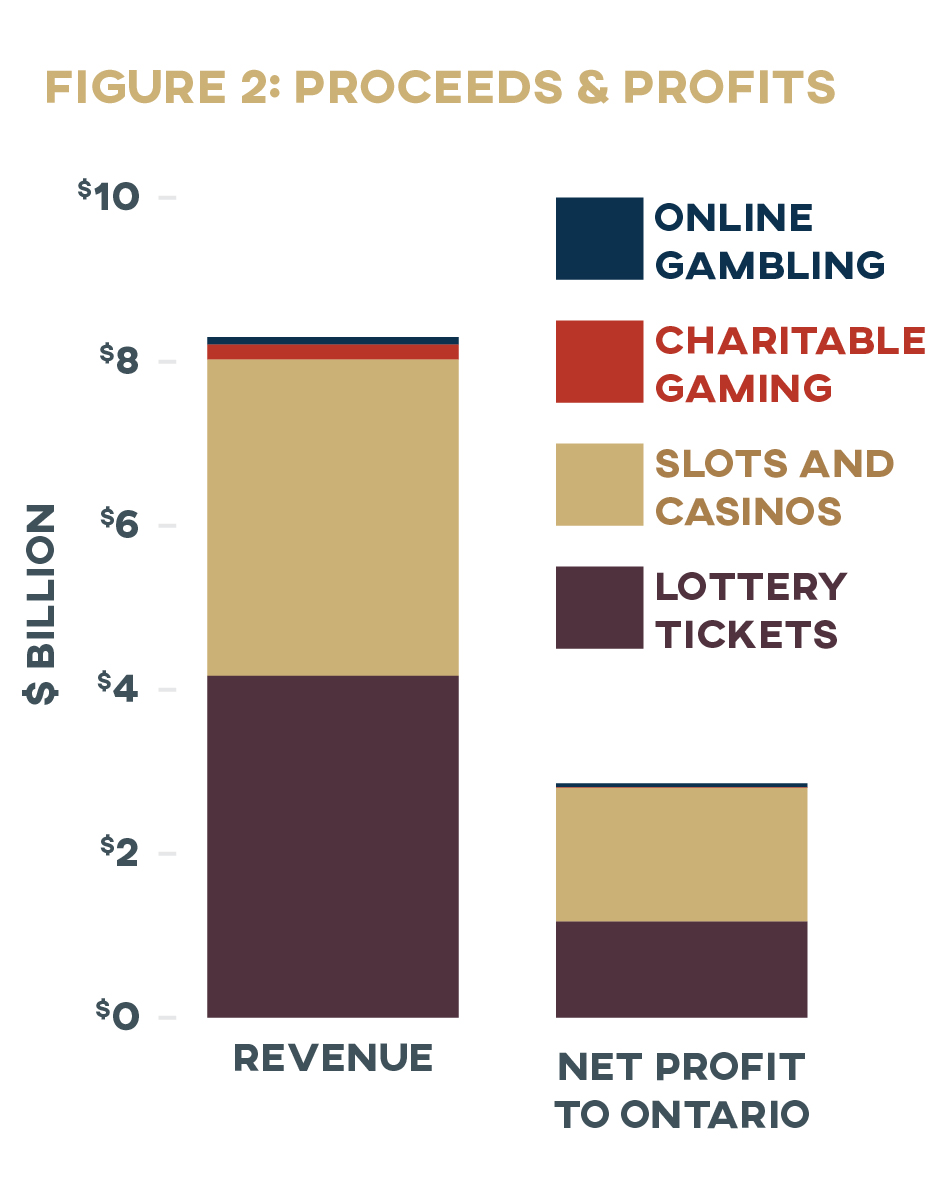
These games are also growing at very different rates. The revenue after prizes (but before expenses) of land-based gaming has grown substantially since casinos were introduced, shooting from $693 million in 1994 to $3.86 billion in 2019. In contrast, lottery revenue after prize payments has grown far more slowly, boasting only a 21 percent bump over the same period. 35 35 OLG, “Annual Report 2018–19,” Public Accounts of Ontario 1994–95. The last, very small, portion of gambling revenue is made up of charitable gambling (2% of proceeds) and online gambling (1% of the corporation’s total proceeds, but with the highest profit margin of OLG’s four business lines at 54%). 36 36 OLG, “Annual Report 2018–19.”
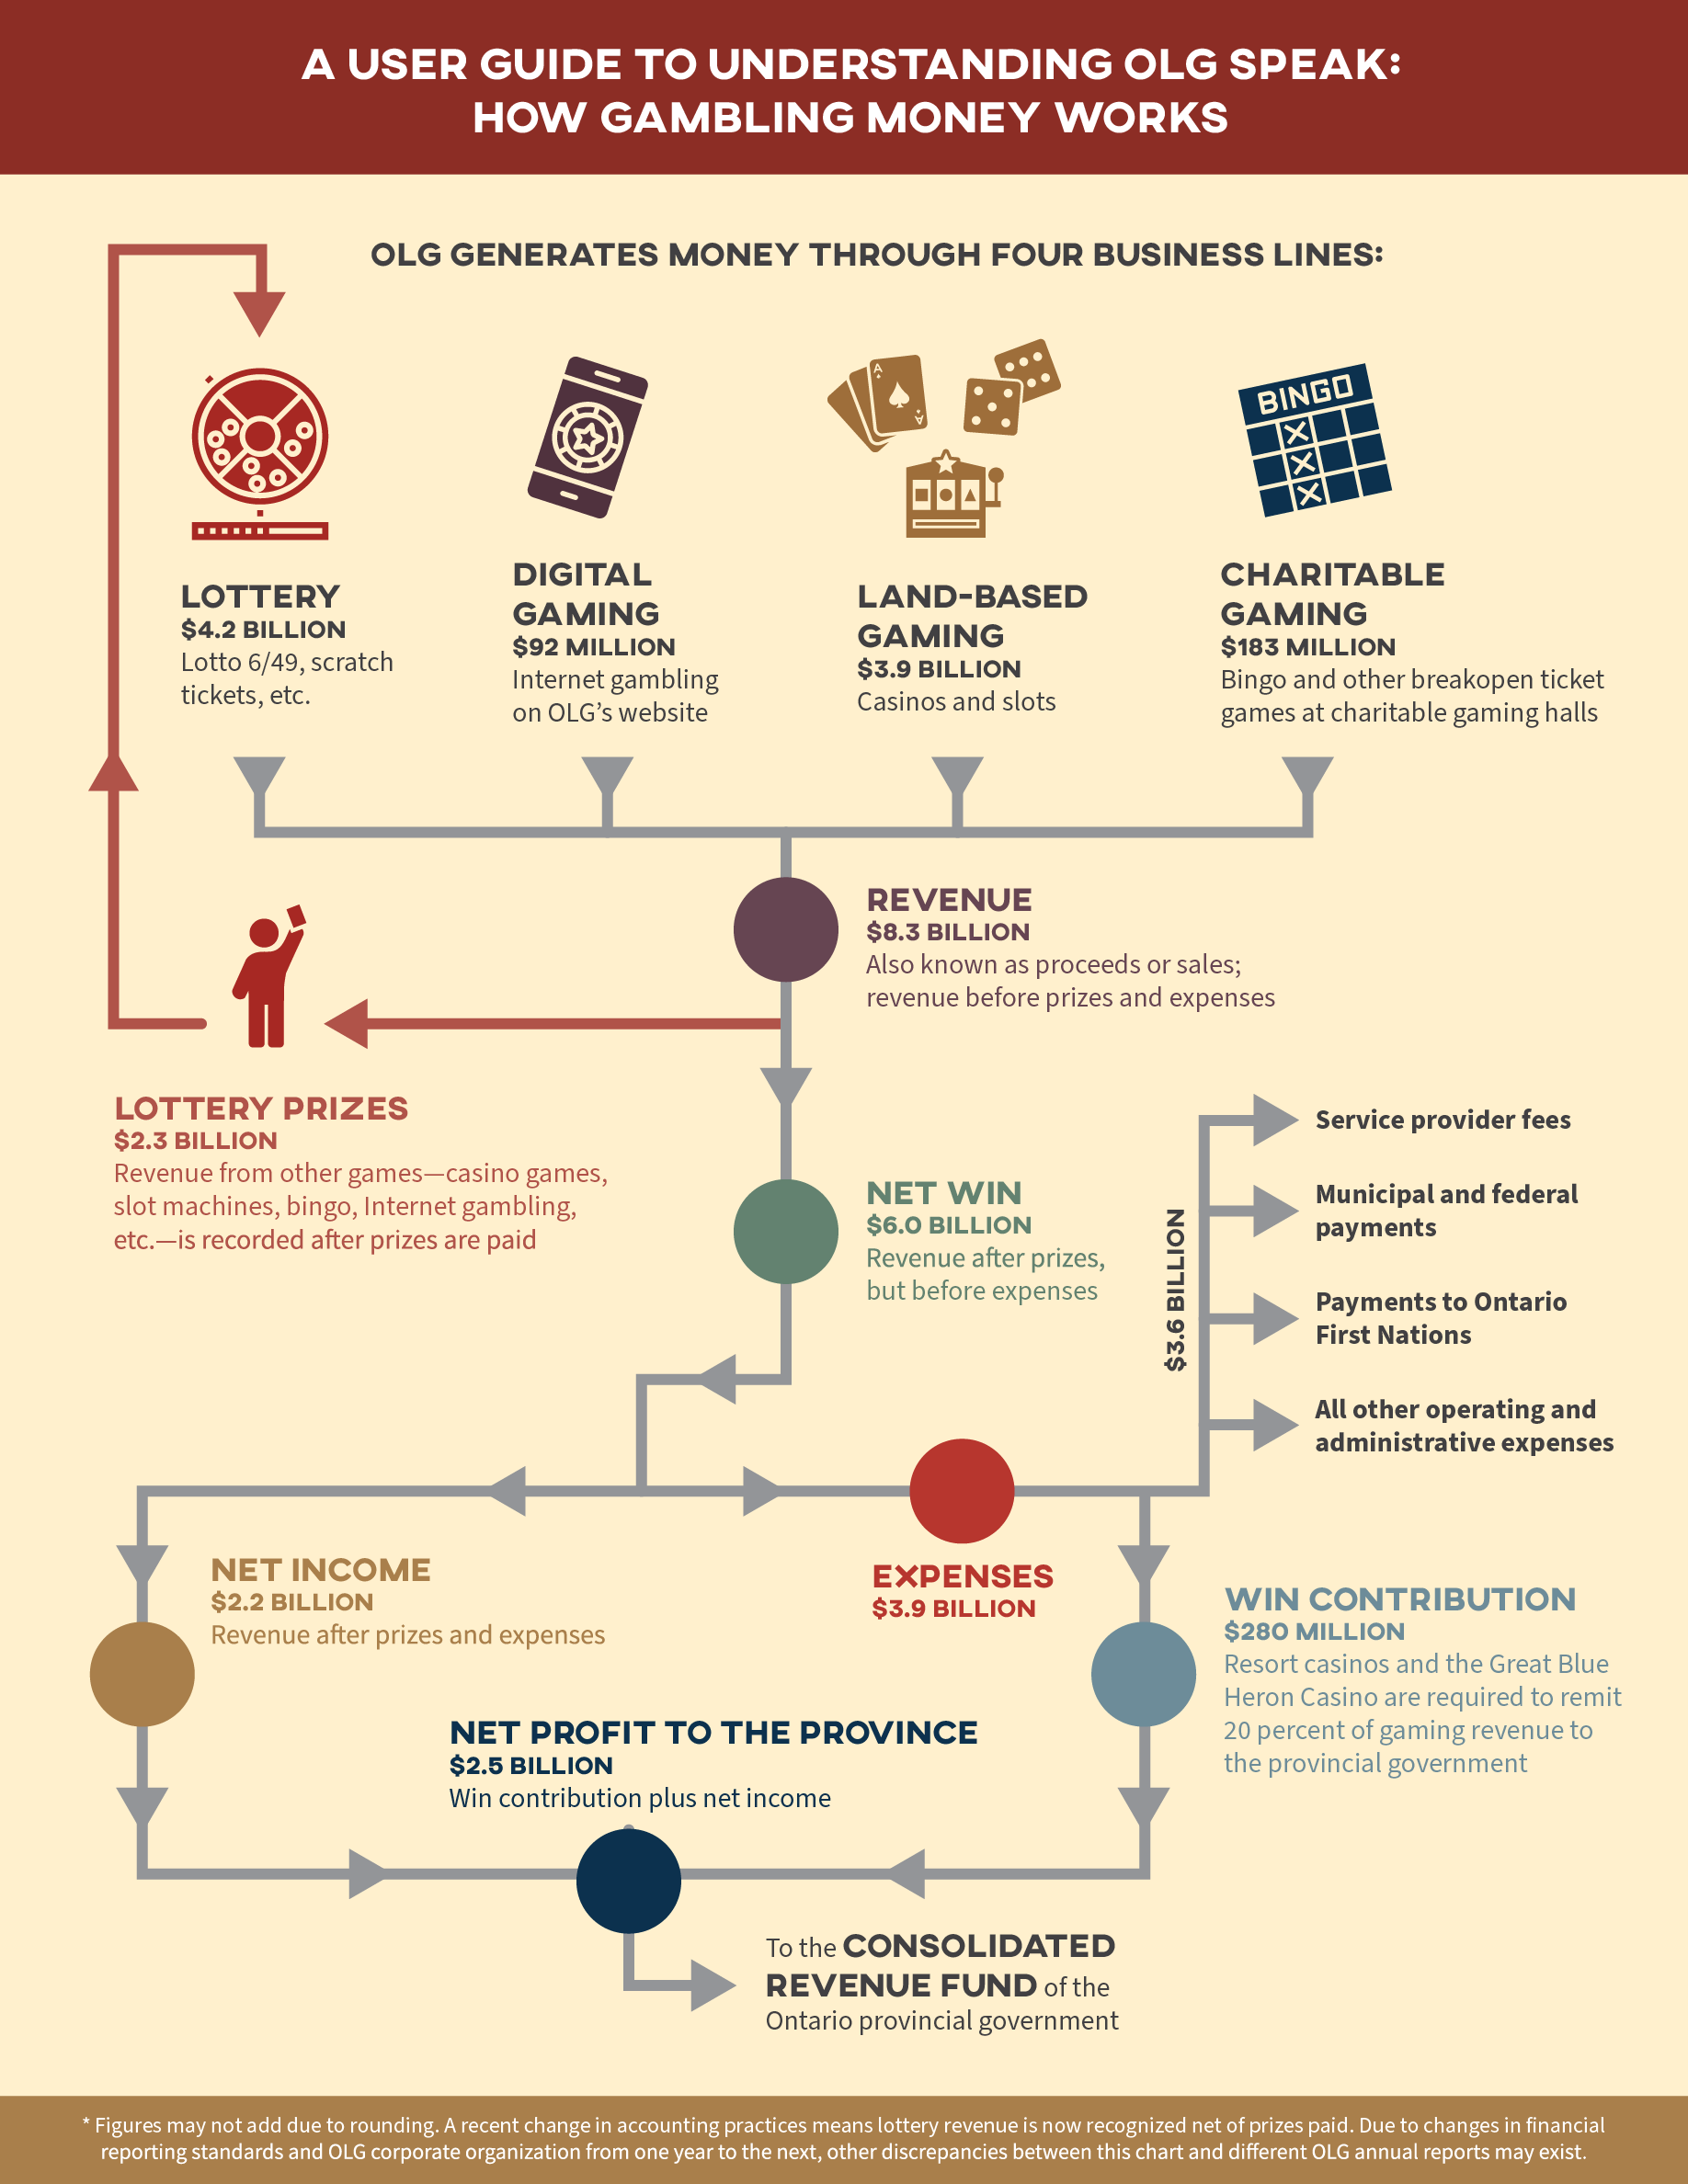
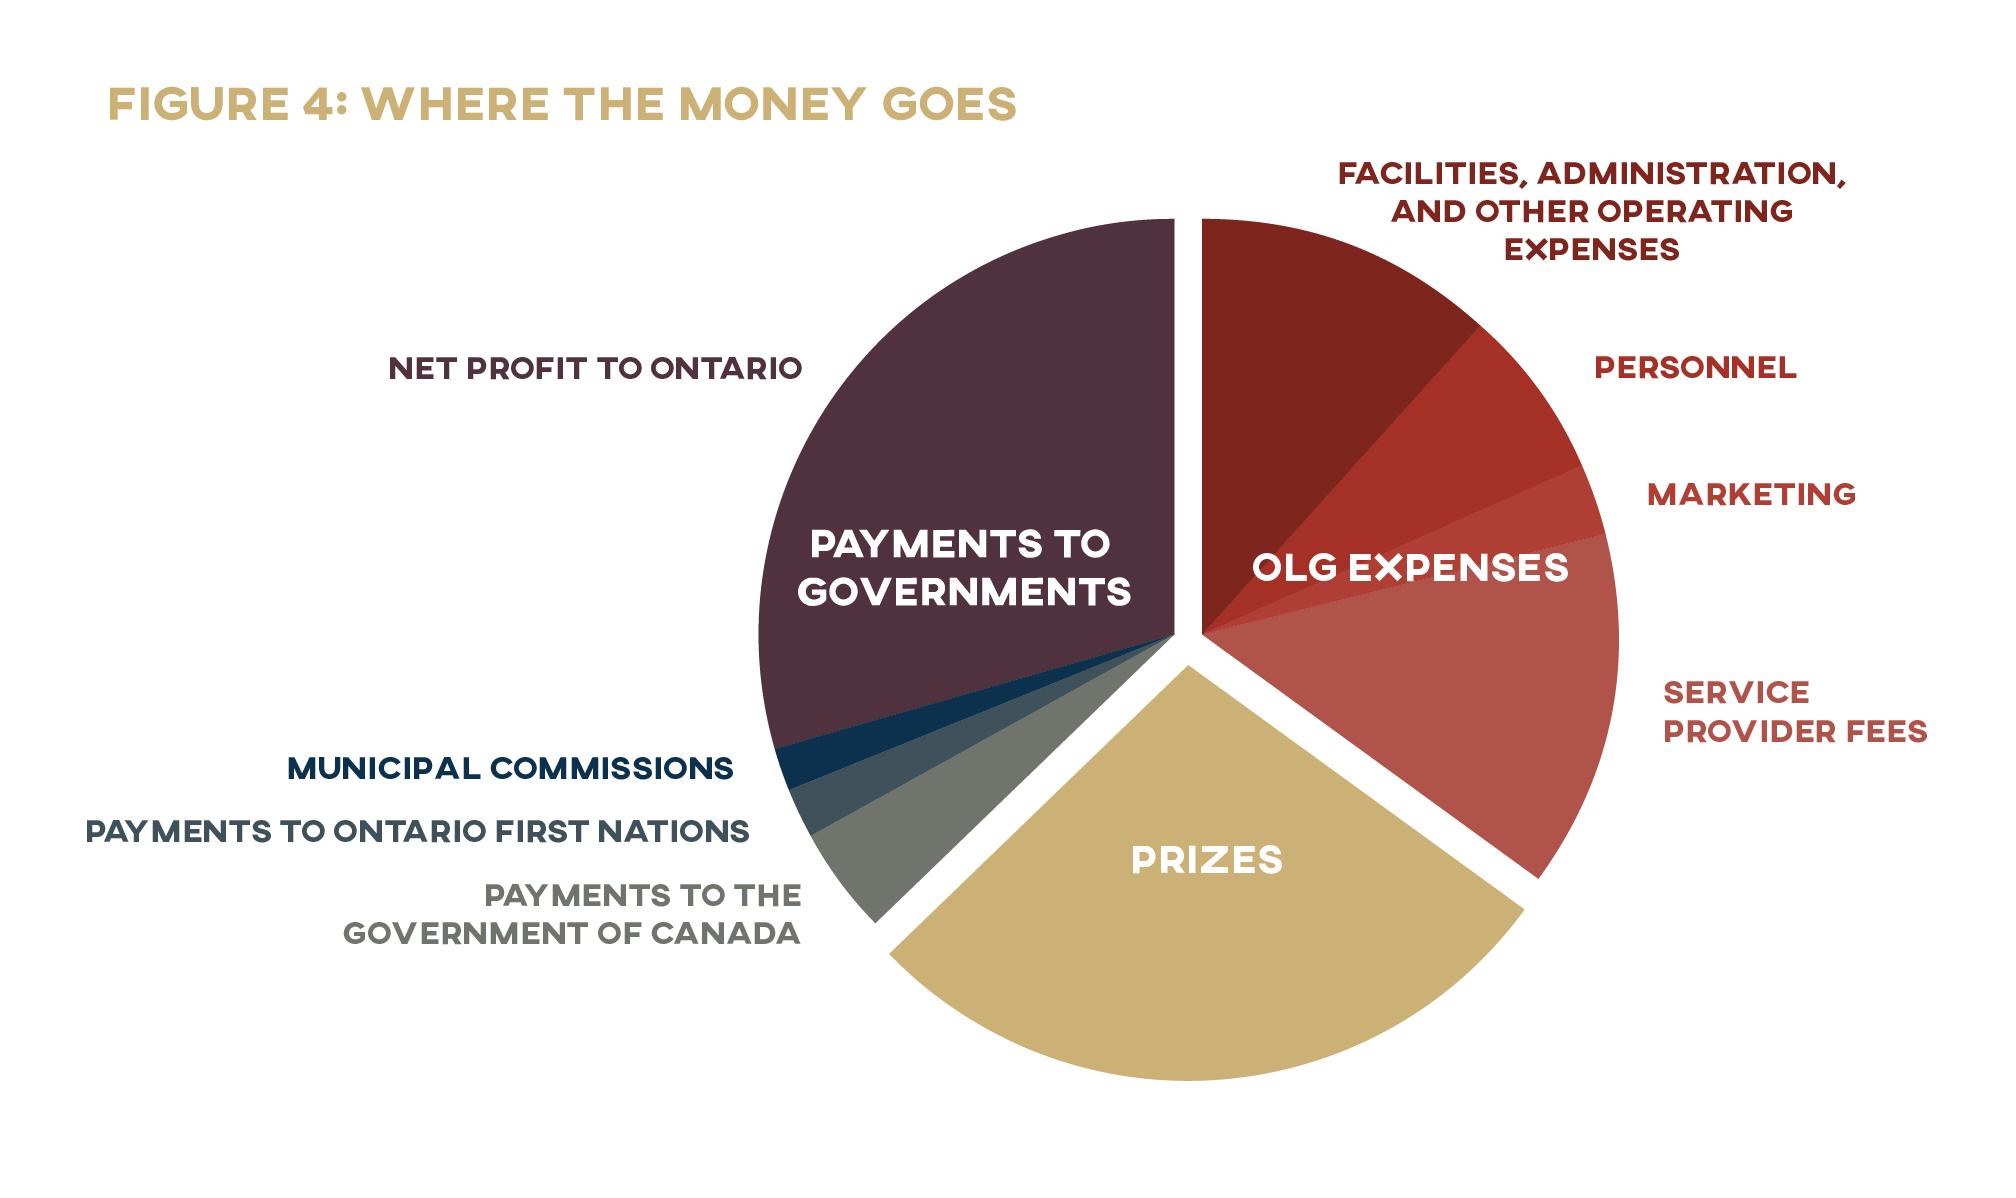
This revenue is destined for many pots. OLG’s largest expense is prizes: $2.3 billion, or approximately 28 percent of total gaming proceeds, was paid out to winners across the province last year. Payments to land-based gaming service providers is a distant second at $1.2 billion. Another $694 million went to stakeholders, among which the OLG includes the government of Canada, Ontario First Nations, and municipal commissions. Personnel costs ($572 million) and marketing and promotion ($215 million) are among OLG’s highest indirect expenses. The corporation’s various other operating expenses, such as commissions and fees, ticket printing, facilities, and administration, totaled $940 million. Everything left over after all these bills have been paid—nearly $2.5 billion last year, about a third of total revenue—goes to the province. 39 39 OLG, “Annual Report 2018–19.”
Setting the Hook? Gambling Revenue as Proportion of Government Revenue
OLG sees its expansion as a success story for Ontario, proudly pointing out that its payments to the province “have increased by $908 million or a record 47.7 per cent” in the past decade. 40 40 OLG, “Annual Report 2017–18,” 23. Though gambling money has declined somewhat as a share of provincial income over the last fifteen years, it has nonetheless held relatively steady since around 2012, when the modernization process began. OLG contributions have had a powerful impact on the province’s finances. 41 41 Authors’ calculations based on data from Ontario, “Public Accounts of Ontario: Past Editions.” In 2005, former premier Bob Rae, the architect of casino legalization in Ontario, confessed: “There is no doubt about it, we have come to rely on gambling revenues. . . . Perhaps in a better world we wouldn’t, but the fact of the matter is it’s here, it’s here to stay.” 42 42 Robson, “Game Goes On.”
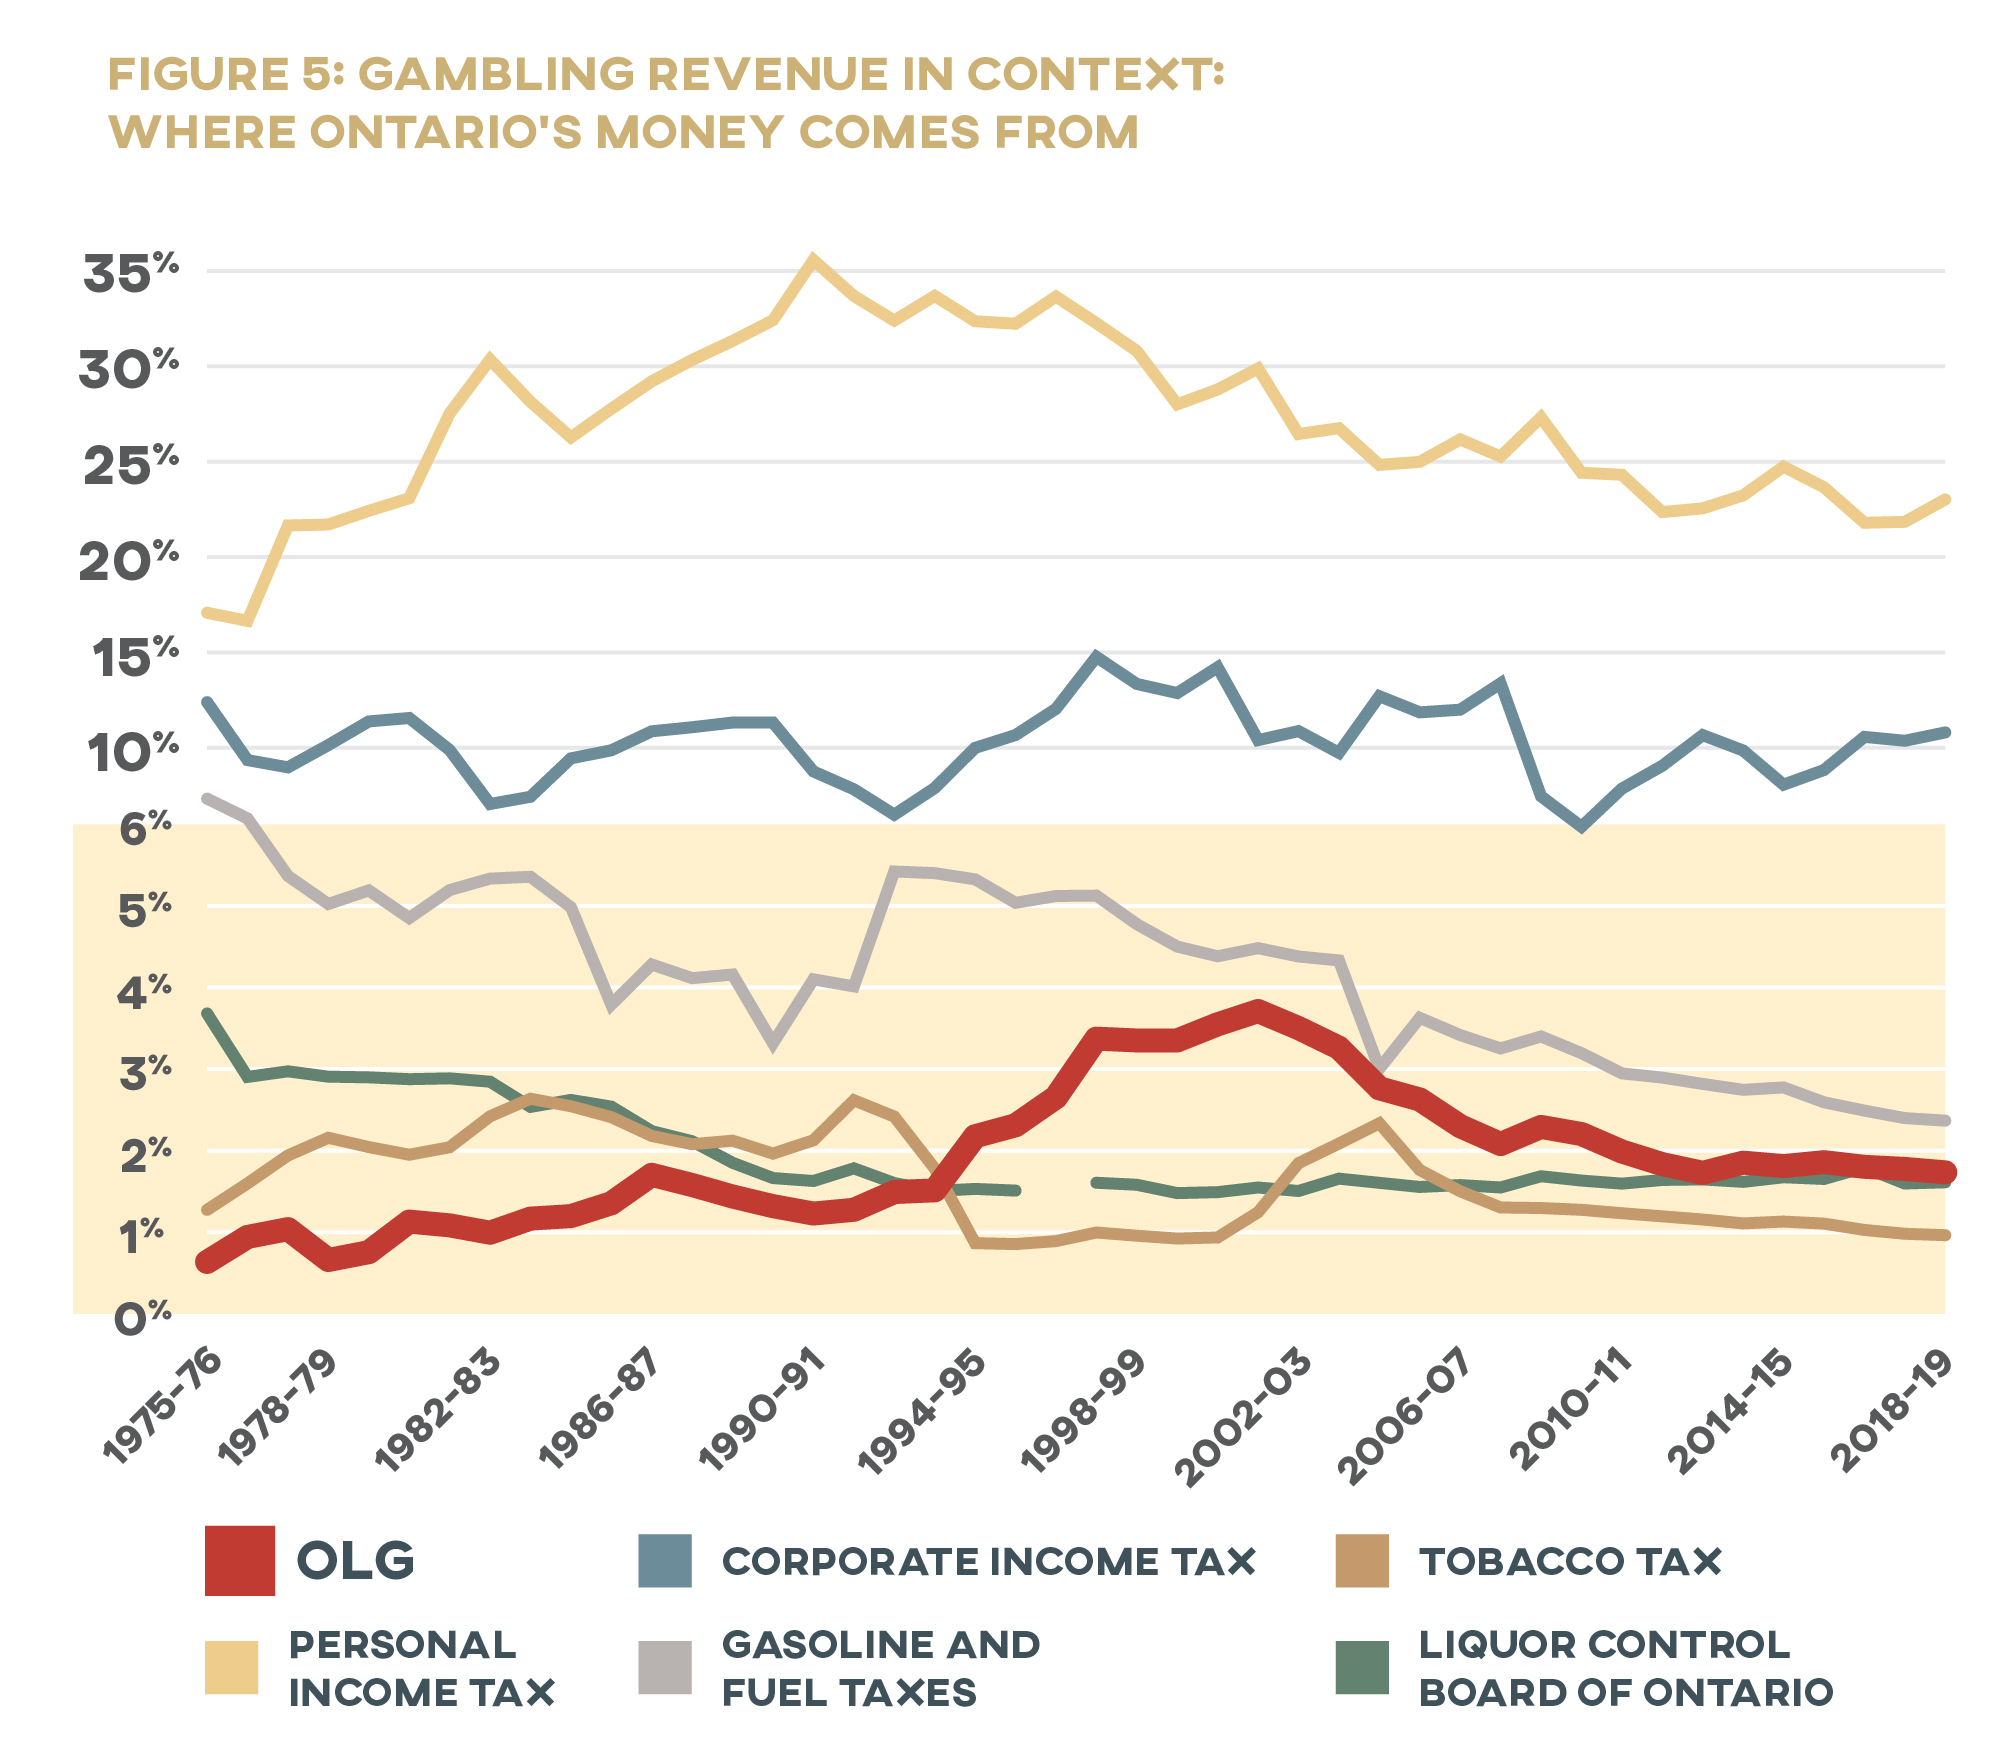
Ontario has become dependent on its yearly $2 billion-plus gambling cheque. OLG contributions made up 1.6 percent of the provincial government’s income in the 2018–19 fiscal year. To put that in context, the $2.4 billion of government payments from OLG just two years earlier matched the $2.4 billion government deficit. 43 43 The Ontario government reported $140.7 billion in total revenue and a $2.4 billion annual deficit for the 2016–17 fiscal year (both figures restated actual), while OLG reported $2.4 billion in net profit to the province. OLG, “OLG Annual Report 2016–17”; Ontario Treasury Board Secretariat, Public Accounts of Ontario 2017–18. But where is the money coming from? Who, and what communities, are the source of these funds?
P(l)ayer Profile: Demographics
Most of Ontario’s population is paying into the pockets of OLG in some form or another. Researchers have offered different estimates over the years of how many Ontarians gamble, from around two in three (63 to 66%) 44 44 Wiebe, Mun, and Kauffman, Gambling and Problem Gambling in Ontario 2005, 22; Marshall, “Gambling 2011,” 6. to just over four in five (83%). 45 45 Williams and Volberg, “Gambling and Problem Gambling in Ontario,” 54–55; Wiebe, Single, and Falkowski-Ham, “Measuring Gambling,” 18. This is roughly consistent with estimates of the Canada-wide average (67-81%). 46 46 Marshall, “Gambling 2011,” 6; MacDonald, McMullan, and Perrier, “Gambling Households in Canada,” 194; McCready et al., “Gambling and Seniors,” 57.
Ontario’s population is not paying OLG equally, however. It’s common to hear the state’s use of gambling money described as a “voluntary” tax. We disagree for reasons we outline below, but regardless, this is a tax that disproportionately burdens the poor, the marginalized, and the addicted.
Money In, Money Out: Gambling by Income
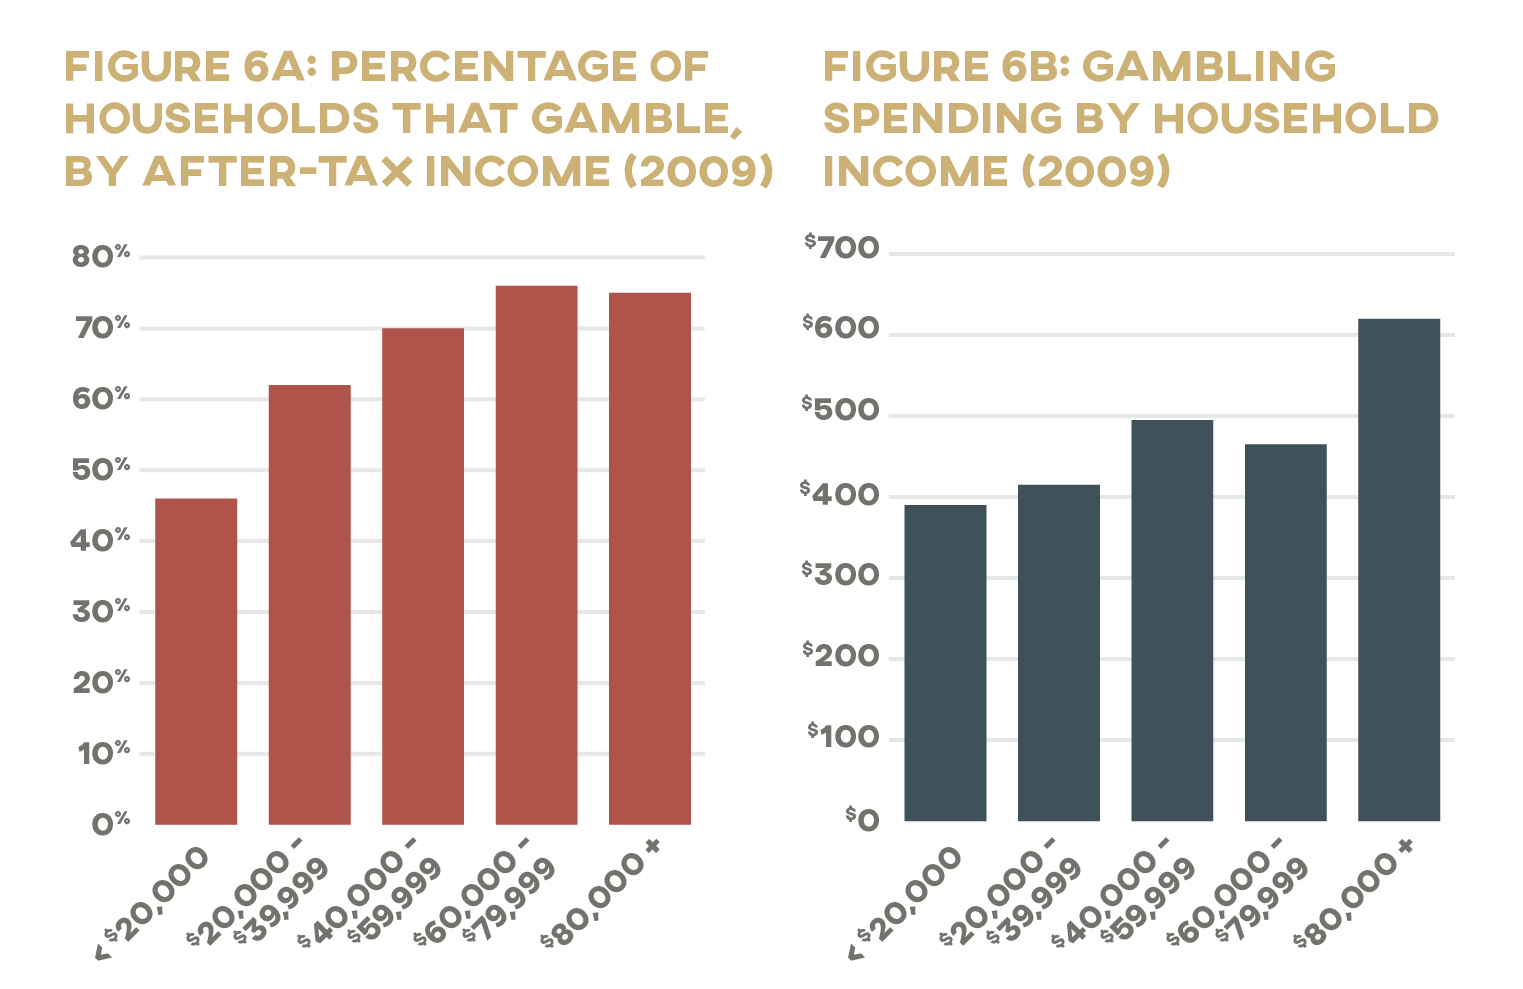
On the surface, the regressive nature of gambling revenue can be hard to see. The data collected by Statistics Canada seem to show that those who have more money are more likely to gamble and to spend more money when they do. Data published in 2011, for instance, found that only 46 percent of households that took home less than $20,000 after tax gambled, compared to three-quarters of those making $60,000 or more. Those in the highest income bracket spent $620 a year on gambling, more than half again as much as the nation’s lowest earners. 47 47 Marshall, “Gambling 2011,” 6.
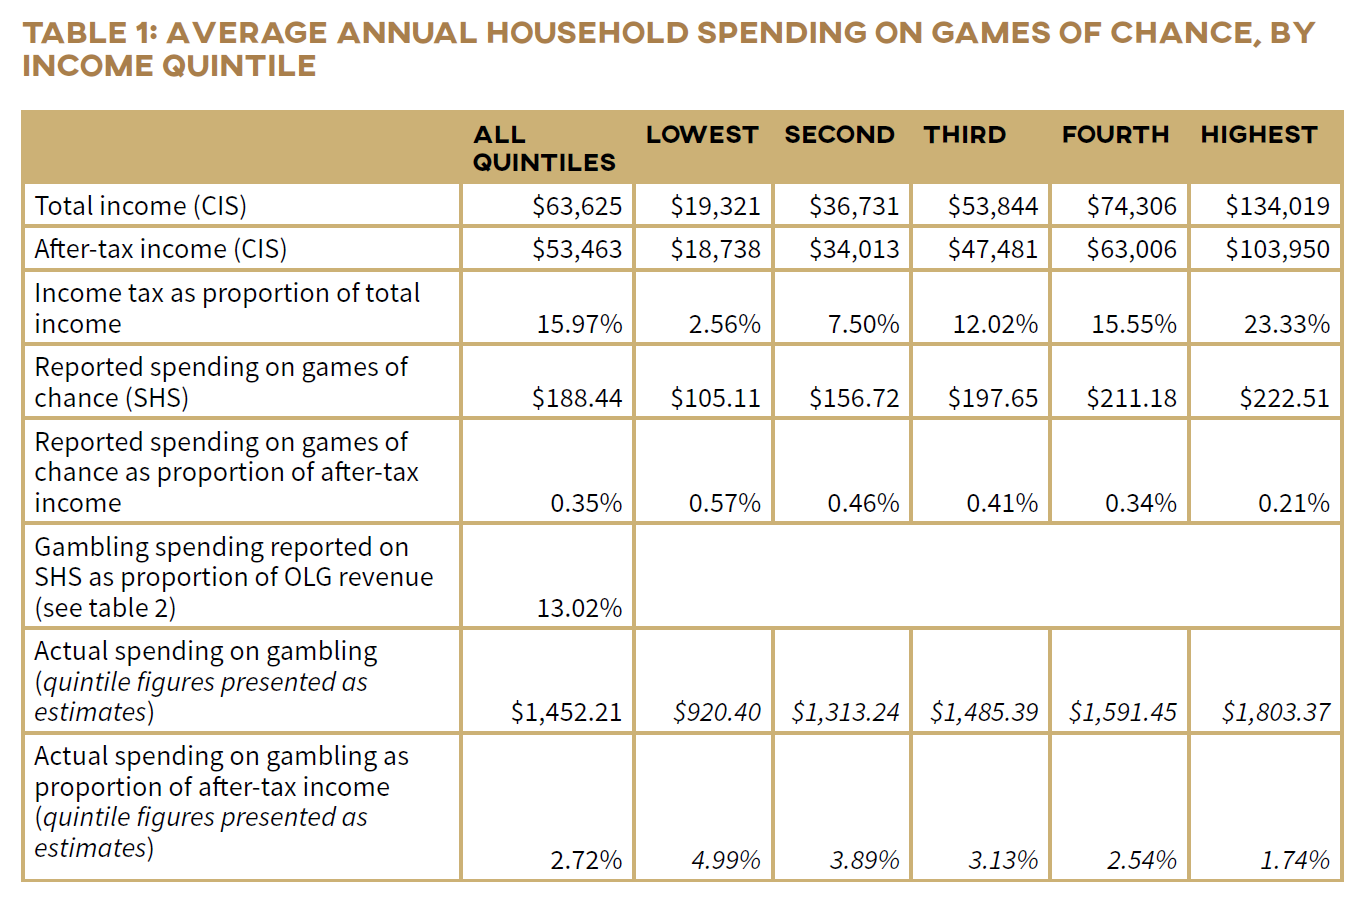
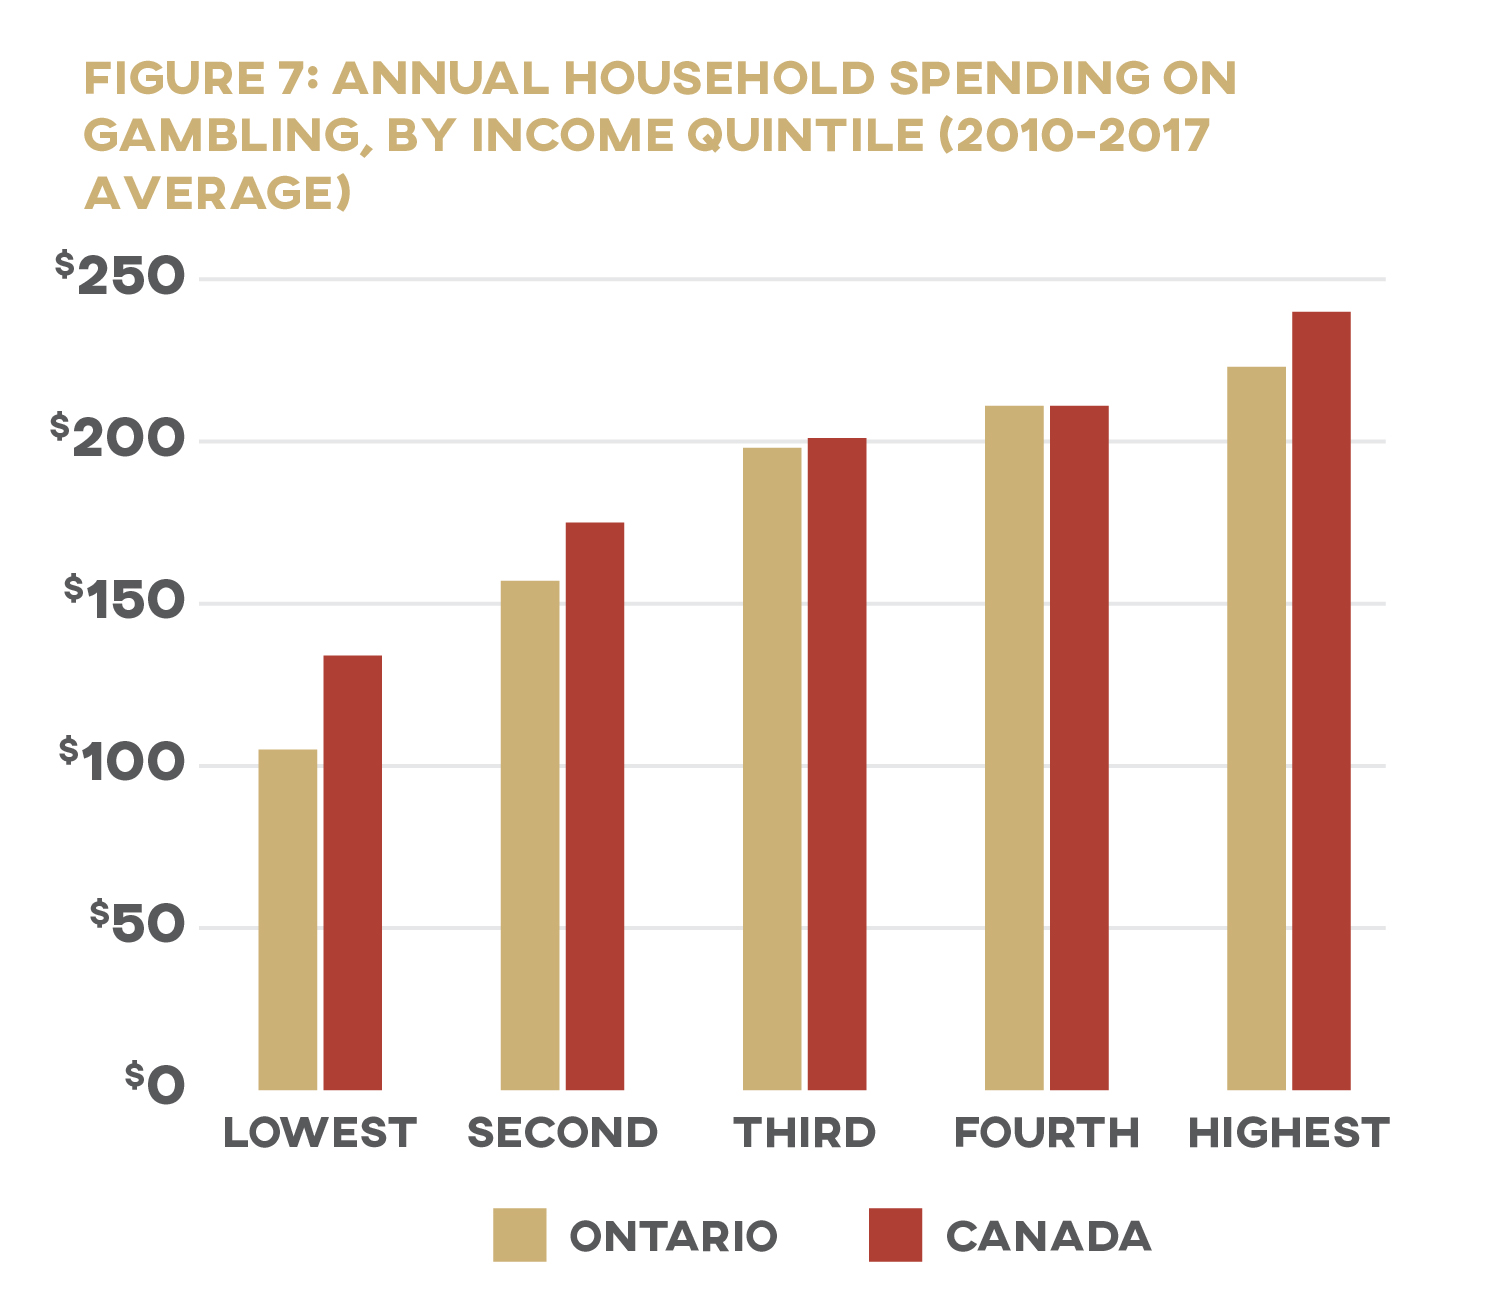
The Survey of Household Spending (SHS) provides a slightly different set of data—average expenditures on “games of chance” are broken down by income quintile, and data on the proportion of participating households is unavailable—but the numbers seem to tell the same story. Canada’s highest-earning households (averaging $100,000 in after-tax income) spent an average of $240 each year on gambling from 2010 to 2017; this is almost twice as much as those in the lowest-earning category (average after-tax income of $18,900), who spent only $134. The pattern holds for Ontario as well: households making $18,700 spent just $105 on gambling, while those making $103,900 spent more than double at $223. 48 48 Authors’ calculations based on data from Statistics Canada, “Table 11-10-0223-01.” See appendix for details.
But first glances can be deceptive. Higher earners may be spending more of their paycheques at the casino, but gambling eats up a much higher proportion of the poor’s income. According to SHS data, households in Canada’s highest income quintile spend an average of 0.24 percent of their after-tax earnings on games of chance each year; those in the lowest quintile spent nearly three times as much at 0.71 percent. In Ontario, bottom-quintile households spend 0.57 percent of their after-tax income gambling, more than two and a half times as much as the 0.21 percent spent by top-quintile households. 49 49 All figures are authors’ calculations based on data from Statistics Canada’s Canada Income Survey and Survey of Household Spending. See appendix for details. Statistics Canada, “Table 11-10-0223-01”; Statistics Canada, User Guide; Statistics Canada,“Table 11-10-0193-01.”
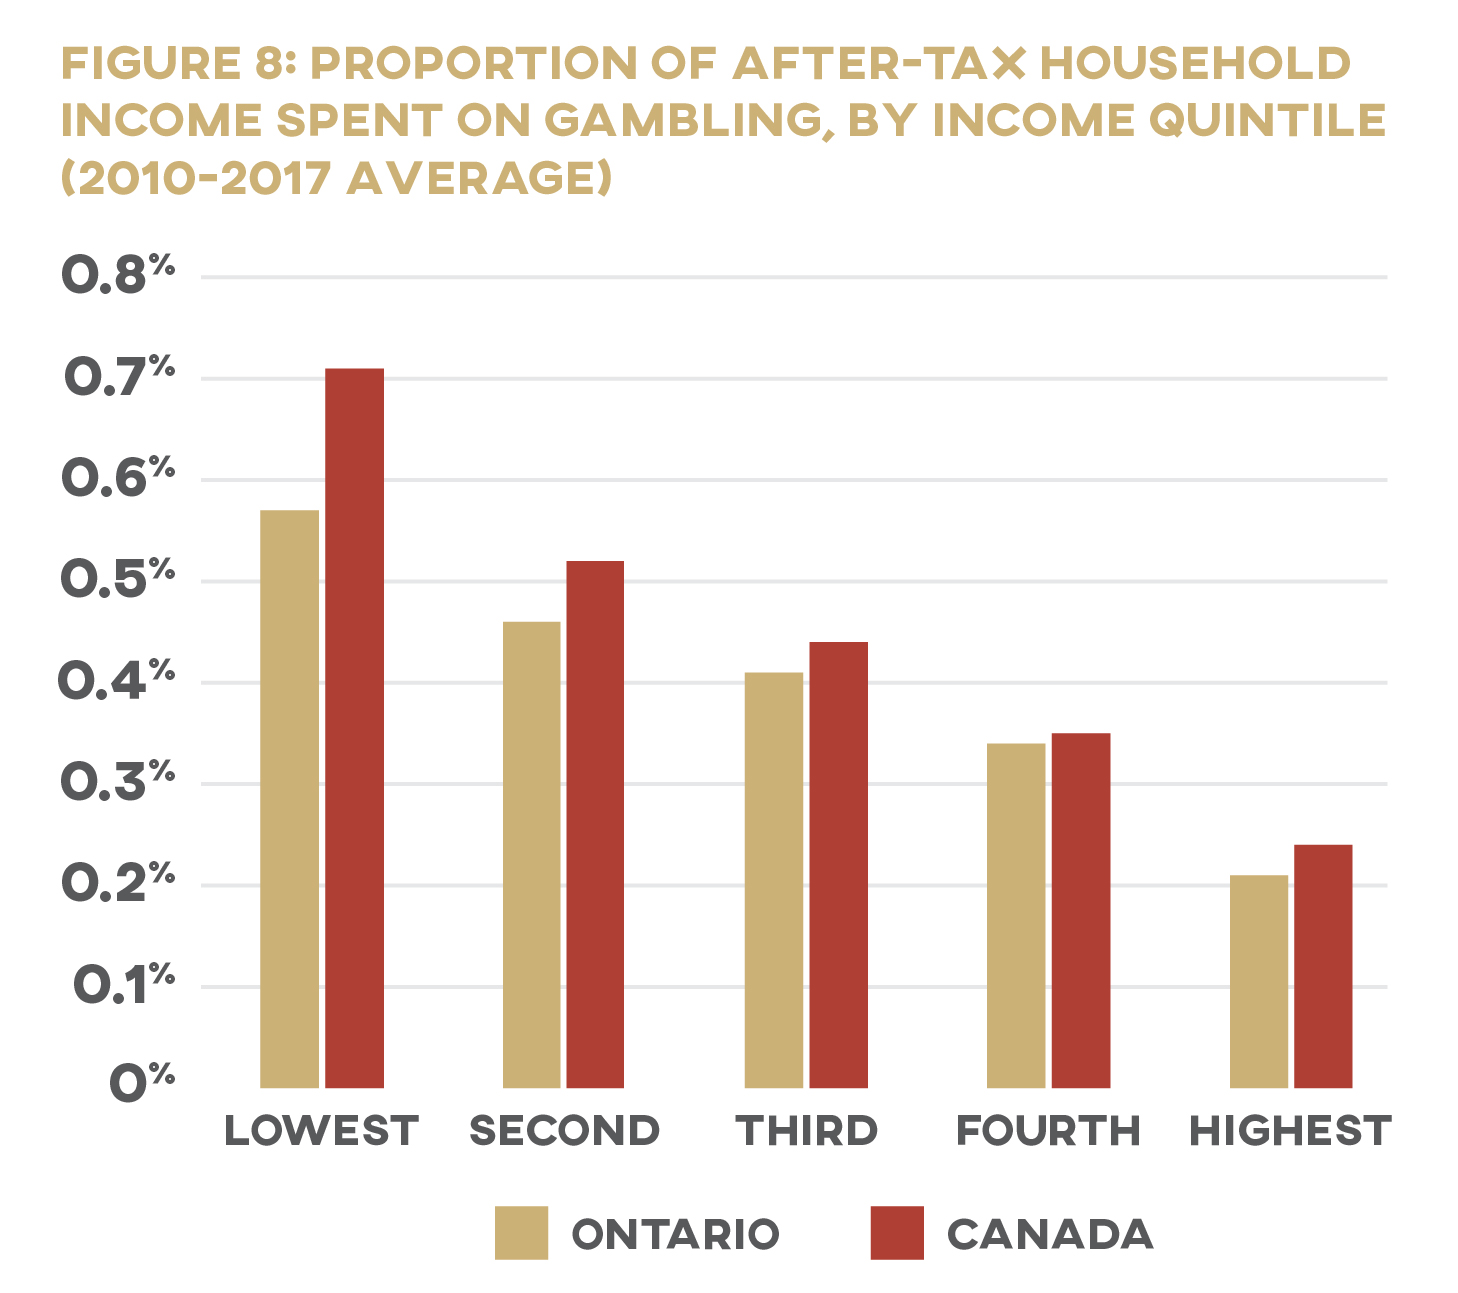
Less than one percent of a household’s annual earnings may not seem like a lot of money, even for a low-income family. We agree that $134 per year is a modest amount—spending ten bucks a month on entertainment is hardly unreasonable (though, as we’ll discuss below, these SHS figures understate actual spending by a dramatic margin). These seemingly low numbers, however, should not distract us from the high-stakes problem at play: when Ontario collects lottery and casino money, it is digging deeper into the pockets of the poor than of the rich. Gambling may be a “voluntary” tax (more on the accuracy of this description below as well), but it is a tax. And this means the province is paying its bills in a way that hits low-income families hardest.
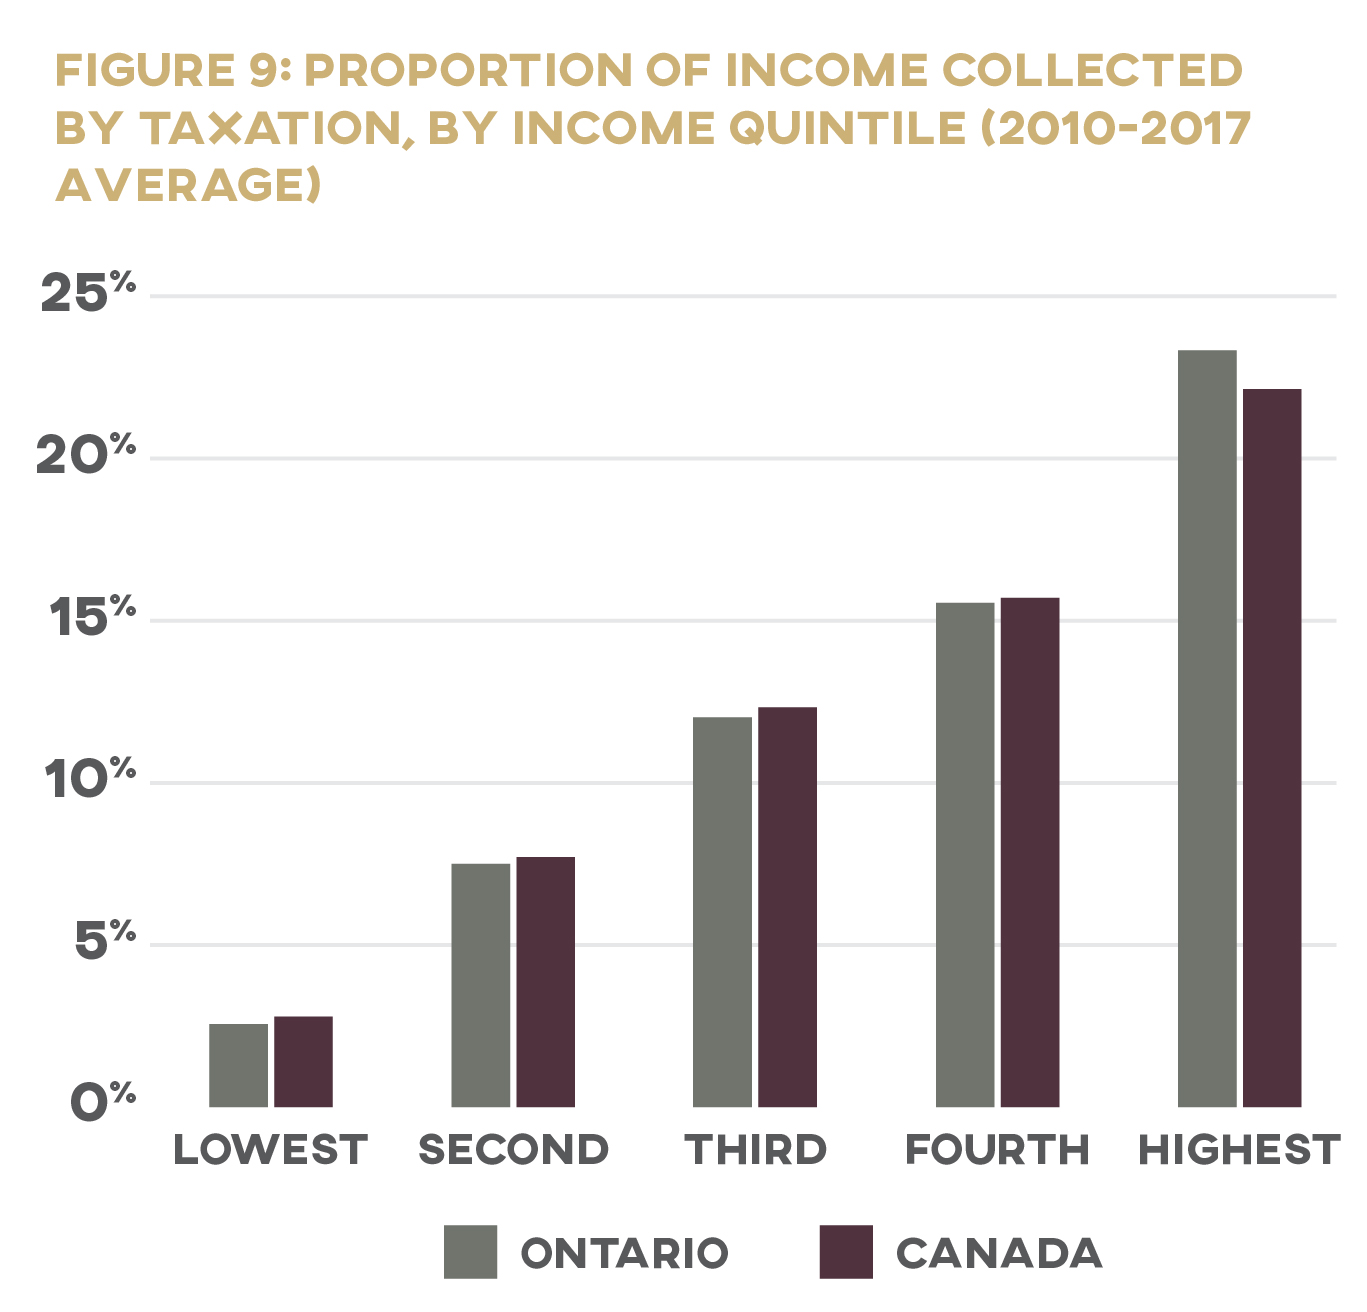
And yet this is exactly the opposite of how other tax revenue functions. Our progressive tax system is designed to tax the rich more heavily than the poor: those who have more pay more. The lowest income quintile in Ontario loses barely 2.5 percent of its total income to taxation, while the average household in the province’s highest income quintile turns over to the government over nearly ten times more of its total income at 23 percent. 50 50 Authors’ calculations based on data from Statistics Canada, “Table 11-10-0193-01.” (The relative proportion of OLG revenue derived from low-income households may, in fact, be even higher: a recent study found that richer gamblers spent more on gambling activities that were outside OLG’s jurisdiction, such as social gambling and at casinos located outside Ontario.) 51 51 Williams and Volberg, “Gambling and Problem Gambling in Ontario,” 57. This report on gambling in Ontario, which was based on a survey of over 4,000 adults, found that those making under $20,000 per year spent 4% of their income gambling, more than double the proportion spent by those in higher-earning categories. The gambling-expenditure reports obtained by the authors of this study are likely more reliable than those obtained through the SHS, given their much closer match to actual OLG revenue (88.1%; see below for comparative SHS figures). While acknowledging the unreliability of gambling-expenditure reports, the authors note that “certain procedures have been shown to produce a reasonable approximation to gambling expenditure as recorded in daily diaries as well as actual jurisdictional gambling revenue” (33).
The regressive nature of gambling taxes is no secret. Ontario has known for decades that its collection of lottery revenue “is a regressive tax and that it hurts poor people more than it hurts those people who are better off,” as one MPP put it back in 1989. 52 52 Ontario Legislative Assembly, Hansard, 34th Parl., 1st Sess., February 28, 1989, at 1750. Nor is Ontario an outlier: research both within Canada and internationally has consistently found that poor households spend a greater percentage of their income on gambling than their wealthier neighbours do. 53 53 See, e.g., MacDonald, McMullan, and Perrier, “Gambling Households in Canada”; Wisman, “State Lotteries”; Orford et al., “Role of Social Factors,” 258; Bol, Lancee, and Steijn, “Income Inequality and Gambling,” 64; Lang and Omori, “Can Demographic Variables Predict,” 173; Castrén et al., “Relationship Between Gambling Expenditure,” 91–92.
The Demographics Data Gap
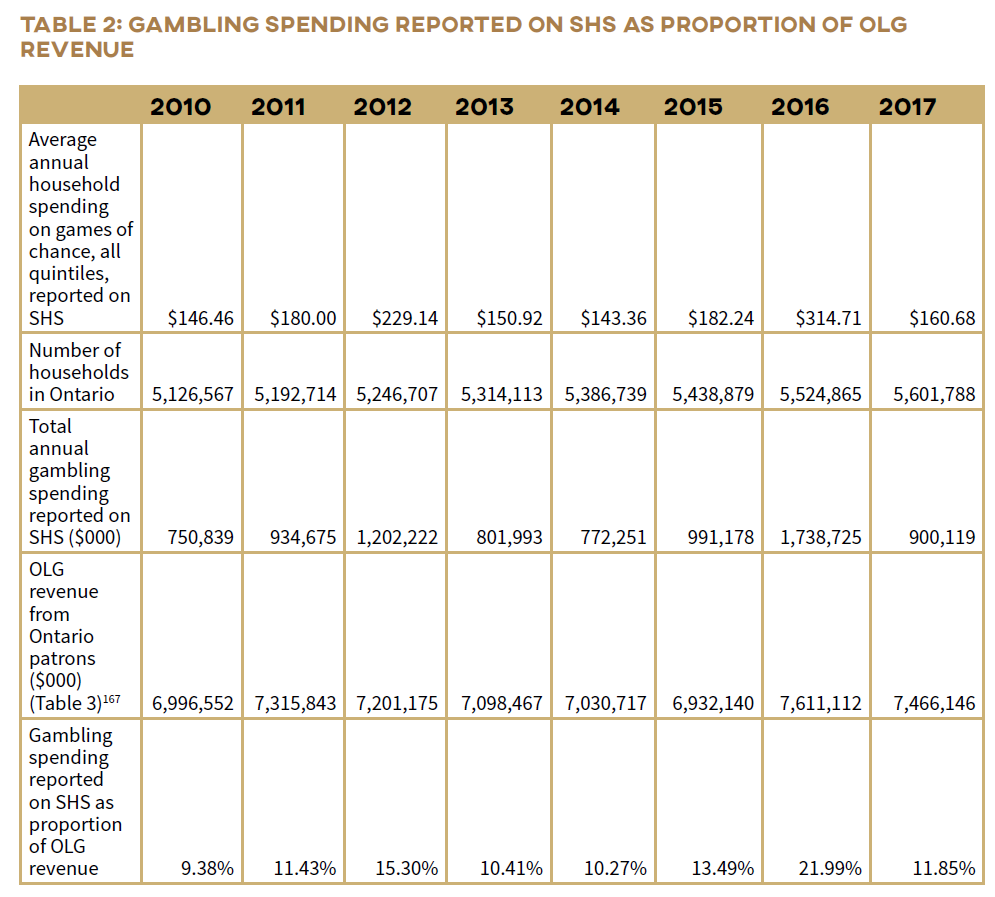
Statistics Canada’s data on spending and income across the country provide a window into the relationship between gambling and household earnings. But these figures are not without their limitations. As with other addictions, most of us don’t want to admit we have a problem. We gamble more than we think we do. According to the Survey of Household Spending, the average Ontario household spent $158 on games of chance in 2017. Multiply this figure by the number of households in Ontario that year (5.6 million 54 54 Statistics Canada, “Table 36-10-0101-01.” ), though, and the province’s total gambling spending comes to only $885 million—a mere 12 percent of OLG’s reported revenue that year ($7.5 billion 55 55 OLG, “OLG Annual Report 2016–17.” ).Put another way, the average Ontario household would have had to gamble more than $1,300—well over eight times more than they reported spending—in 2017 for OLG’s books to balance.
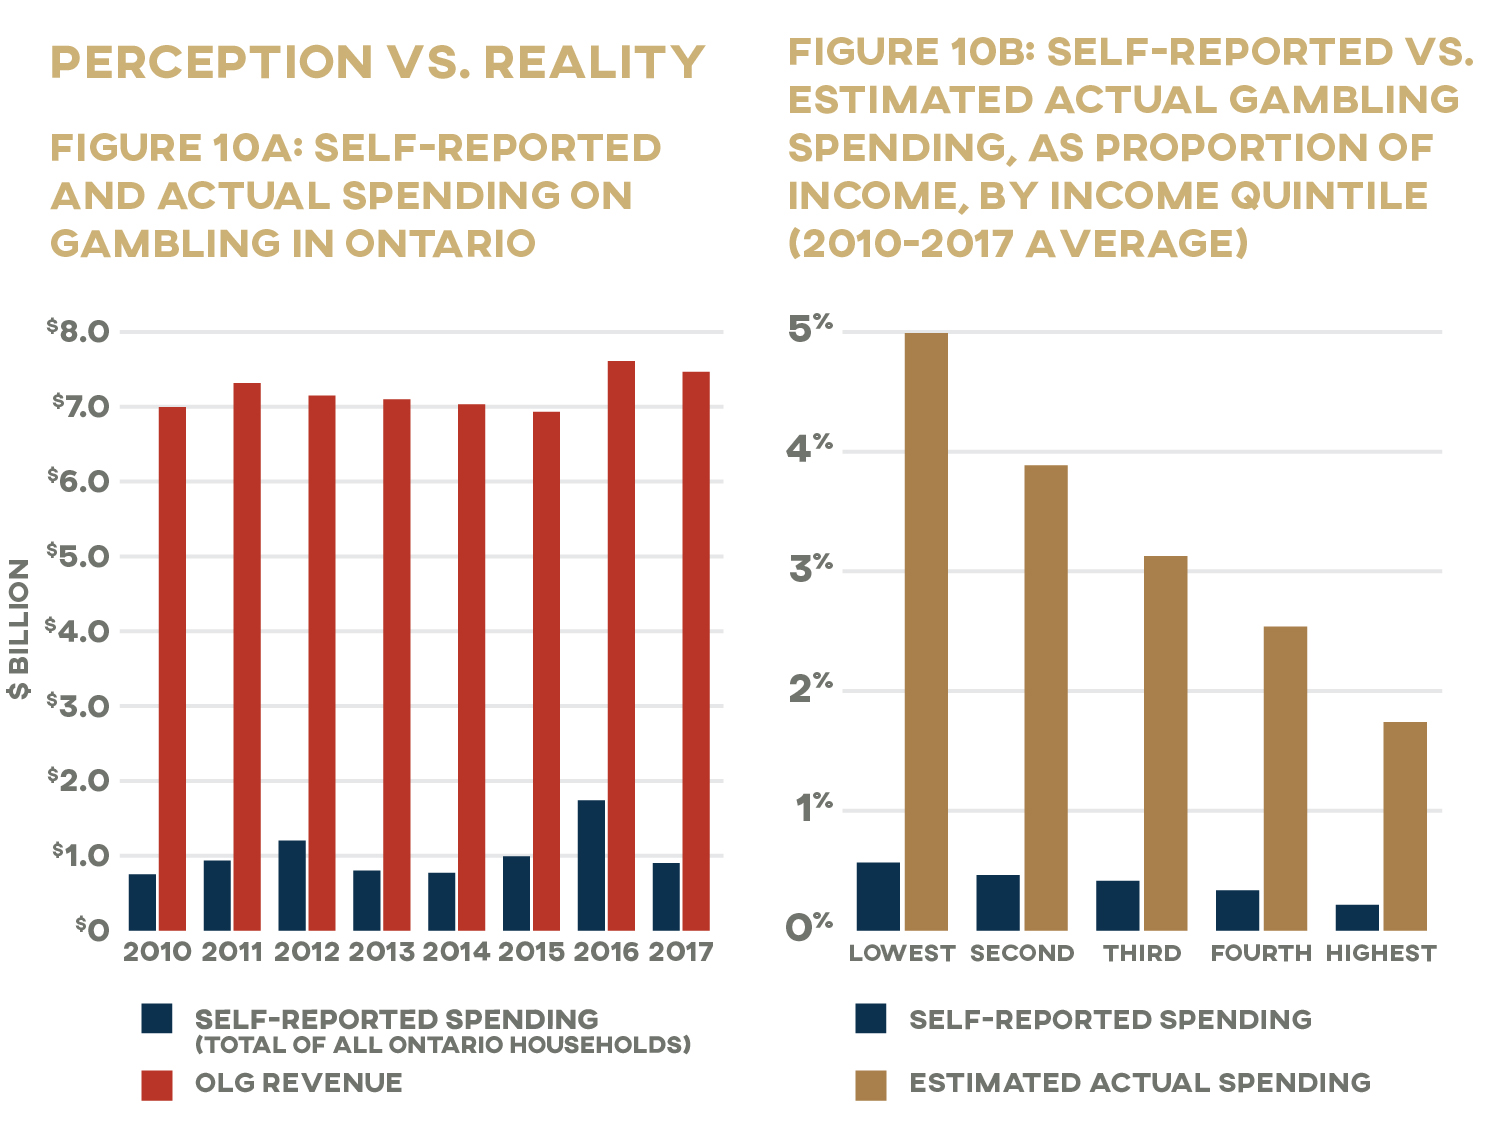
If households across all income quintiles are underestimating their gambling spending by approximately the same margin in their SHS expenditure records, it would mean that Ontario’s lowest income households are spending more than 4.5 percent of their income on gambling. 56 56 Potential actual spending figures are estimates and should be treated with caution. Authors’ calculations based on OLG annual reports and Statistics Canada, “Table 11-10-0223-01.” See appendix for calculation details. The Ontario government uses income taxes—which are set through a transparent process and for which it is held publicly accountable—to collect an average of $2,747 from households making $10,918 a month, and only $47 from households making $1,567 a month. At the same time, and away from the gaze of the public eye, it takes another $55 of what remains in its poorest citizens’ pockets—an average of $1,519 for the month—but just $82 more ($138) from those who have five and a half times more after-tax income ($8,262) left to pay their monthly bills.
Gambling disproportionately burdens the poor.
This inconsistency is not uncommon: people consistently underestimate how much they actually spend gambling in self-reported household expenditure surveys, often dramatically. 57 57 Wood and Williams, “‘How Much Money.” This is not to say that these survey respondents are necessarily making a conscious decision to fudge the numbers—it is likely that many people are simply unaware of how much their weekly lottery habit drains from their bank account, particularly since less than half of Canadians track their income and expenses in a budget. 58 58 Financial Consumer Agency of Canada, “Canadians and Their Money: Key Findings from the 2019 Canadian Financial Capability Survey,” https://www.canada.ca/en/financial-consumer-agency/programs/research/canadian-financial-capability-survey-2019.html. It is important to acknowledge this limitation, but what we believe to be the core issue at hand remains: gambling disproportionately burdens the poor, a finding that not only is consistent across provinces in SHS data, but has been repeatedly borne out by other research as well.
Cause for Concern
Demographics are tough to tease out. 59 59 One of the biggest obstacles is the ambiguity surrounding the definition of “gambling,” both in academic reports and public opinion. Should shelling out a few dollars for raffle tickets at a charity fundraiser be classified as gambling, for instance? What about buying high-risk stocks or day-trading? Where’s the line between “gaming” and “gambling” (if it exists at all)? Researchers have answered these kinds of questions differently, which makes comparing statistics across multiple studies challenging. See, e.g., Zaloom, “Derivative World”; King et al., “Distinguishing Between Gaming and Gambling”; Williams et al., “Definition, Dimensionalization”; Economist, “When Does Investing Become Gambling?”. Finding up-to-date data on gambling in Ontario for this paper was challenging, especially since existing research has tended to focus on problem gambling specifically rather than on gambling participation in general. 60 60 Rodgers, Caldwell, and Butterworth, “Measuring Gambling Participation.” The latest comprehensive national investigation of gambling in Canada was published in 2002 by Statistics Canada. More recent research exists at the provincial level, but various problems including low response rates and small sample sizes, make these data less reliable than desired. While a group of researchers from the Alberta Gambling Research Institute is working on a major study to fill this gap, the project had not yet been completed at time of writing. 61 61 Williams et al., “Gambling and Problem Gambling in Canada.”
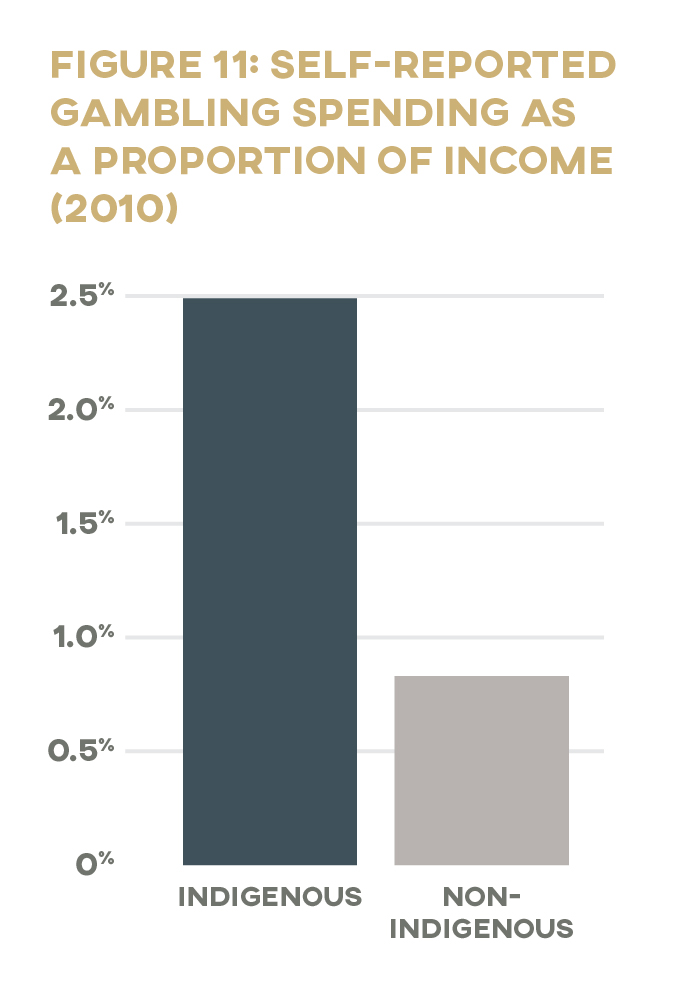
Despite challenges in determining who’s wagering what in Ontario, there’s strong evidence that those at the margins of society are paying disproportionately into the coffers of OLG. Take, for example, Canadian and international studies that establish links between lower levels of education and higher levels of gambling participation. 62 62 For Canadian research, see, e.g., Abdel-Ghany and Sharpe, “Lottery Expenditures in Canada”; MacDonald, McMullan, and Perrier, “Gambling Households in Canada.” For international research, see, e.g., Castrén et al., “Relationship Between Gambling Expenditure”; Tan, Yen, and Nayga, “Socio-demographic Determinants.” A comprehensive examination of demographic trends in Australia’s gambling industry, for example, found “a striking gradient in that losses are much higher for people with lower levels of education.” 63 63 Davidson et al., Gambling Expenditure. A study of Lotto players in Germany likewise emphasized the significance of education: “Education proves to be one of the most important determinants both for participation in the lottery and for the amount of expenditures. . . . The demand for lottery tickets appears to be, first and foremost, a question of education, since the group of Lotto players, which is already overrepresented by lower levels of education, also displays distinctly higher expenditures within these levels.” 64 64 Beckert and Lutter, “Inequality of Fair Play,” 482. Given that lower levels of education are also linked to lower job earnings, 65 65 Speer, “Forgotten People.” the overrepresentation of less-educated groups in the lottery market is likely to amplify the lottery’s regressive effect. Indigenous peoples also have disproportionately lower incomes compared to majority populations and as such are disproportionately affected by the expansion of gambling. 66 66 Income data from Statistics Canada, Aboriginal Statistics at a Glance. An in-depth review of the literature on gambling among Indigenous communities is beyond the scope of this paper, but readers are encouraged to explore the substantial body of research on this topic. See, e.g., Breen and Gainsbury, “Aboriginal Gambling”; Wardman, El-Guebaly, and Hodgins, “Problem and Pathological Gambling”; Belanger, First Nations, 166–94; New Zealand Ministry of Health, “Gambling and Problem Gambling”; Dyall, “Gambling”; Williams and Wood, “Demographic Sources”; Stevens and Young, “Betting on the Evidence”; Currie et al., “Racial Discrimination.”
Problem Gambling
Research also suggests that Ontario’s gambling addiction is being fed disproportionately by gambling addicts. Those classified as problem gamblers make up an estimated 1–3 percent of Ontario’s total adult population, depending on how problem gambling is defined and measured in a given survey. 67 67 For a collected summary of provincial gambling prevalence studies conducted in Canada, see Alberta Gambling Research Institute, “Prevalence—Canada Provincial Studies.” This is more or less consistent with problem gambling rates in Canada and similar jurisdictions (i.e., large Western countries with legalized gambling, such as Australia and the United States), which also hover around 1–2 percent. 68 68 MacLaren, “Video Lottery,” 460; Wiebe and Volberg, “Problem Gambling Prevalence Research.” As with other addictions, there is an abundance of evidence suggesting that problem gambling is more likely to afflict society’s vulnerable and marginalized, having been linked to lower income, minority ethnic status, less formal education, homelessness, alcohol abuse, and higher rates of psychiatric disorders. 69 69 For a concise overview of this research, see Volberg, McNamara, and Carris, “Risk Factors for Problem Gambling,” 360–63; see also Lorains, Cowlishaw, and Thomas, “Prevalence of Comorbid Disorders”; Williams, Volberg, and Stevens, “Population Prevalence of Problem Gambling”; Sharman, “Gambling and Homelessness.” Even after controlling for the effect of these mental health risk factors, problem gamblers are more likely than the rest of the population to have attempted or thought about committing suicide. 70 70 Wardle et al., “Problem Gambling and Suicidal Thoughts.”
Even though problem gamblers represent a tiny fraction of Ontario’s population, studies estimate that the province collects 15–30 percent of its total gambling revenue from this group. 77 77 Williams and Volberg, “Gambling and Problem Gambling in Ontario”; Williams and Wood, “Demographic Sources”; Williams and Wood, “What Proportion of Gambling Revenue.” These figures, while comparable to findings in other regions, 78 78 See, e.g., Orford, Wardle, and Griffiths, “What Proportion of Gambling”; Government of Australia, “Inquiry Report,” 5.35. are contested by the gambling industry. 79 79 See, e.g., Bernhard and Philander, “Informing the Public Debate.” An in-depth analysis of the controversy surrounding problem gambler revenue is beyond the scope of this paper. But as gambling scholars Robert Williams and Robert Wood point out, it should come as no surprise that, as in other fields, from business to health care, relatively few high spenders account for an outsized portion of profits. 80 80 Williams and Wood, “What Proportion of Gambling Revenue.” See also Cook, Paying the Tab. There is evidence to suggest that “gambling is even more concentrated in a very small group of heavy users than most other harmful or risky consumer practices,” and that “the small minority of problem gamblers do not represent the population segments that can best bear [this] cost” (Sulkunen et al., Setting Limits, 169–71).
Addiction by Design: Machine Gambling in Ontario
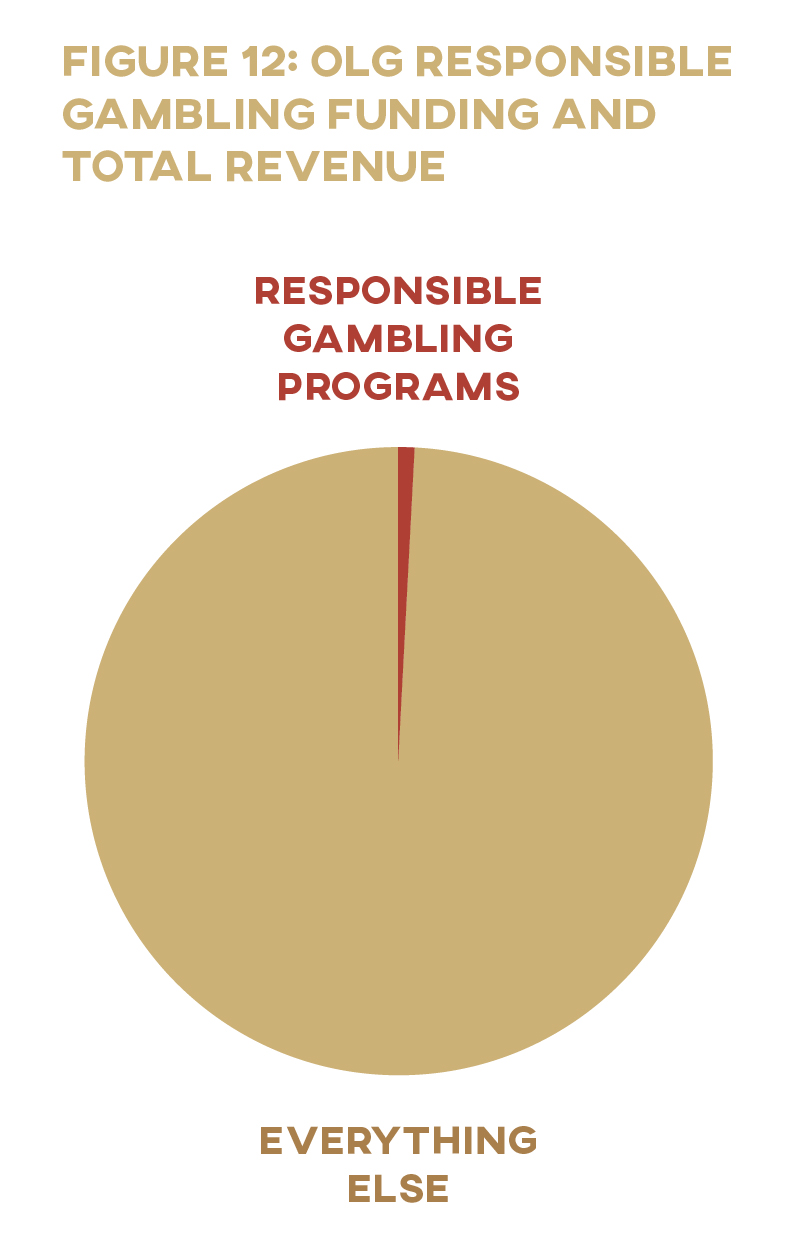
While problem players are disproportionately lucrative for the industry, OLG dedicates only 2.6 percent of its net profit to prevention and treatment of problem gambling in Ontario. 81 81 In 2017–18, OLG sent $45 million to the Ontario Ministry of Health and Long-Term Care—as per government policy directing 2% of annual forecasted gross slot-machine revenue to the ministry for the prevention, treatment, and research of problem gambling—and spent $19.1 million internally on its responsible gambling programs (OLG, “Annual Report 2017–18,” 4–5). The change in accounting practices that OLG adopted in April 2019 meant that the total sent to the ministry for problem-gambling programs was not available in the organization’s 2018–19 annual report. OLG did, however, reduce its spending on internal responsible-gambling programs to $17.3 million in that fiscal year (OLG, “Annual Report 2018–19,” 6). It is interesting—and somewhat ironic—to note that the problem-gambling funding that OLG sends to the Ministry of Health comes from slot machines. The amount of problem gambling funding received by the Ministry of Health each year is “based on government policy that directs 2% of annual OLG slot machine revenue (before service provider fee deductions and excluding slot machine revenue from the Resort Casinos).” 82 82 OLG, “Annual Report 2017–18,” 4. Yet slot machines and other electronic gambling machines (EGMs) have come under particular scrutiny for their addictive design and association with problem gambling. 83 83 In Canada, EGMs are generally known as slot machines when located at traditional gaming facilities (i.e., casinos and racetracks) and as video lottery terminals (VLTs) when found in pubs and bars. VLTs are illegal in Ontario and British Columbia. For research on the addictive design of EGMs, see Schüll, Addiction by Design, discussed in Crawford, “Autism as a Design Principle,” 89–112; MacLaren, “Video Lottery”; Gambling Research Exchange Ontario, “Slots and VLTs” and “About Slot Machines”; Rosengren, “How Casinos Enable Gambling Addicts.” EGMs have been described by some researchers as “the crack cocaine of gambling” (Dowling, Smith, and Thomas, “Electronic Gaming Machines”), though not all researchers fully endorse this designation. Dowling et al. conclude that despite the consistent association in the literature between EGMs and “the highest level of problem gambling,” the evidence available at time of writing was insufficient to definitively “establish the absolute ‘addictive’ potential of EGMs” (42). EGMs include a number of features acting to impair players’ rational control, such as losses disguised as wins—where audio and visual effects celebrate a player “winning” an amount less than he or she wagered, even though the player lost money—and near misses, where the display of symbols makes it appear that the player was close to winning even though the outcome of each play is completely random. These structural characteristics manipulate players’ emotional and cognitive perceptions of the game to keep them playing longer and spending more:
Electronic gambling machines (EGMs) are computers utilising sophisticated techniques, designed to maximise spending and “time on device” per user. EGM designs very successfully employ psychological [principles] to maximise users’ bet sizes and machine usage. These characteristics have the effect of increasing the addictive potential of EGMs. 84 84 Charles Livingstone, “How Electronic Gambling Machines Work,” 2; see also Harrigan et al., “Research Briefing Note”; Harrigan, “Gap Analysis”; Jensen et al., “Misinterpreting ‘Winning.’”
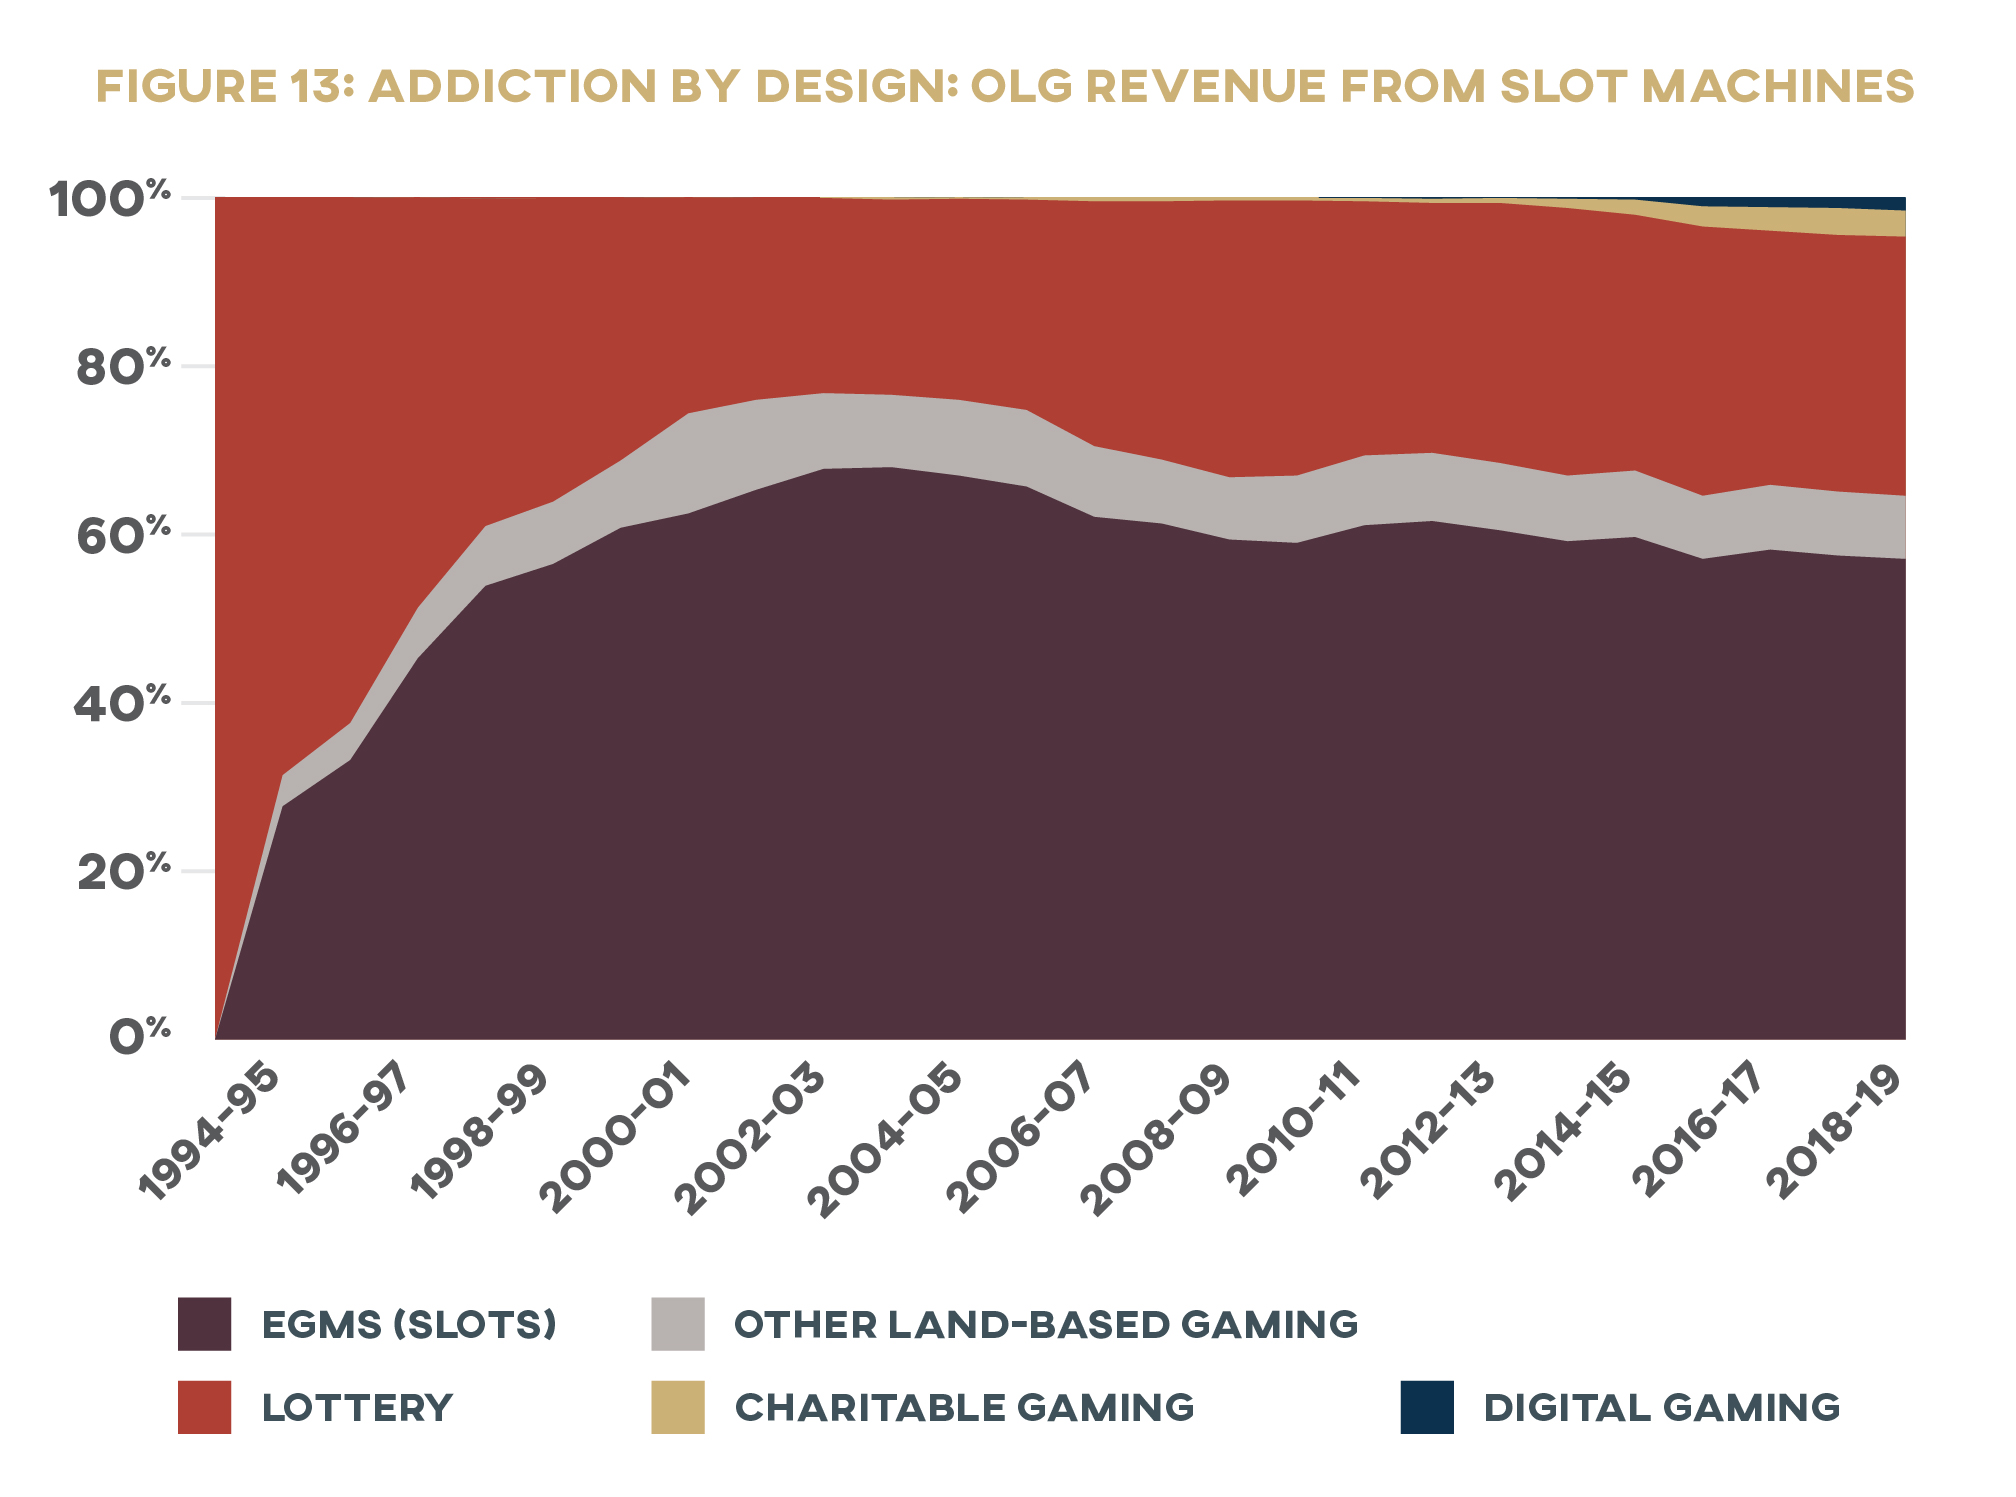
There are over 27,500 slot machines in Ontario, and they are extremely lucrative to the province. In every year that the OLG recorded how much money was generated by slots (2000–2001 through 2010–11), these machines generated at least 88 percent of land-based gaming revenue. Given that land-based gaming has been responsible for nearly 60 percent of Ontario’s gambling income for the past two decades, EGMs are responsible for around half of all gambling money going into provincial coffers. 85 85 See appendix for calculation details. If half of the province’s gambling tax is collected by machines designed to override players’ conscious control, can this tax really be called ‘voluntary’?
OLG proudly touts the merits of its responsible gambling program, assuring players it will “educate you about gambling so you can make informed choices about the games you love to play.” 86 86 OLG, “Responsible Gambling.” But given that modern forms of gambling are deliberately designed to undermine and overcome rational decision-making, how effective is giving players information about the odds or reminding them to play within their limit?
A study conducted in 2011 found that only 20 percent of Ontarians reported having played electronic gambling machines in the past year. 87 87 Williams and Volberg, “Gambling and Problem Gambling in Ontario,” 28. Statistics Canada data from the same period was comparable: Marshall reports in “Gambling 2011” that 19 percent of Ontario households reported playing “casinos, slot machines, and VLTs” (6). Yet OLG’s annual report for that year shows that fully 61 percent of its revenue came from slot machines. 88 88 OLG, “Annual Report 2010–2011,” 61. In other words, nearly half the Ontario government’s gambling profits are coming from only one fifth of the population. 89 89 See appendix for calculation details. These profits are poured directly into the Consolidated Revenue Fund to be doled out to various ministries at the government’s discretion. OLG money is treated exactly the same way as general tax revenue—even though this “voluntary tax” is not collected equitably, as the data show. So what can be done to lift the burden of gambling from the shoulders of the poor and marginalized?
If half of the province’s gambling tax is collected by machines designed to override players’ conscious control, can this tax really be called ‘voluntary’?
Gaming Out a Government Gambling Policy
Ontario’s government is addicted to gambling. OLG revenue is painted as a form of public funds collected for everyone’s benefit—collected, no less, on a voluntary basis while meeting a widespread demand for entertainment. If the people want to try their luck at the casino over the weekend, the story goes, why shouldn’t our schools and hospitals benefit from the profits? Surely these dollars are better in the hands of government than in the hands of organized crime.
Yet beneath this rosy spin lies a system that preys on Ontario’s most vulnerable citizens. Through the gambling industry, the state is digging deeper into the pockets of those who have the least, so that it can keep public programs and services for the rest of the province artificially cheap. How, then, can the government be weaned off this unhealthy and unjust dependency?
Cold Turkey
One option would simply be to outlaw gambling altogether, returning to the sweeping restrictions of the pre-1969 Criminal Code. This could both cut off the revenue feeding the government’s addiction at the source and eliminate the social problems associated with rapid gambling expansion in one fell swoop. A blanket ban, however, is both unfeasible and irresponsible. Setting OLG’s expansion aside, there may be legitimate reasons to have the state regulate gambling, such as curbing crime and keeping games fair. 90 90 See Cosgrave and Klassen, Casino State, 8. For a more detailed discussion of gambling-related crime and other unwanted behaviours linked to gambling, see Campbell, Hartnagel, and Smith, “Legalization of Gambling in Canada,” 38–51. This paper does not address that particular question.
We suggest, however, that the massive economic upheaval the COVID-19 pandemic has created, and its containment measures, represent a unique opportunity for the provincial government to cut its addiction to gambling money cold turkey. At time of writing, the total cost of the outbreak on Ontario’s finances is impossible to predict, but the $2.5 billion that Ontario stands to lose in gambling income is certain to pale in comparison. The province’s finances will need to be rebuilt after the COVID-19 crisis subsides, and this rebuilding should include structures preventing the government from depending on OLG profits to pay its bills. Social-distancing measures have already cut off the province’s flow of gambling money: OLG facilities have been shut down, and the amount of revenue going into public coffers from gambling is likely to be at historic lows. 91 91 OLG, “All Ontario Casinos to Temporarily Close”; OLG, “OLG Prize Centre to Temporarily Close.” COVID-19 provides the province with an unprecedented opportunity to start clean. The costs to the treasury will never be lower. We urge the province not to relapse at this critical time. Relying on OLG profits is an unjust way to pay for (necessary) COVID-19 spending—Ontario’s financial recovery should not be financed by those most vulnerable to economic disaster. Instead, it should focus on building the institutional arrangements that encourage savings and investment.
Getting Clean
The key to breaking the province’s cycle of dependency is getting OLG money out of the Consolidated Revenue Fund. Because of the regressive means by which gambling dollars are extracted, these funds must be kept separate from general tax revenues: no government should be using a system that targets the poor more than the rich to finance its policy agenda. Moving gambling revenue out of the consolidated fund, and into a specific fund—preferably aimed at relief of poverty—would be the equivalent of the government’s admitting it has a problem, admitting that it has harmed the public it is intended to protect, and forming the first steps to making direct amends. 92 92 Gamblers Anonymous, “Recovery Program.”
The temptation, of course, will be to free up tax revenue by using OLG profits to pay for existing programs. But using lottery funds instead of HST to pay the bills for Ontario Works, for instance, only means that the government will avoid real recovery. It is imperative that Ontario not try to escape the discomfort of withdrawal by simply moving money around, and keeping it in its possession in the long-term.
(In)voluntary Taxation
A common objection to this framework is that without the extra cash it gets from casinos and lotteries, the government will have to raise taxes. Why should the state take money from all its citizens when some of them are already supplying this money of their own free will? The problem with this “voluntary” or “free will” tax 93 93 See also Abbott et al., Conceptual Framework of Harmful Gambling, 14. argument is not just that it ignores the evidence that shows it to be inequitable and regressive, but that it fails to account for the ways in which the system is structured to overcome individual players’ wills.
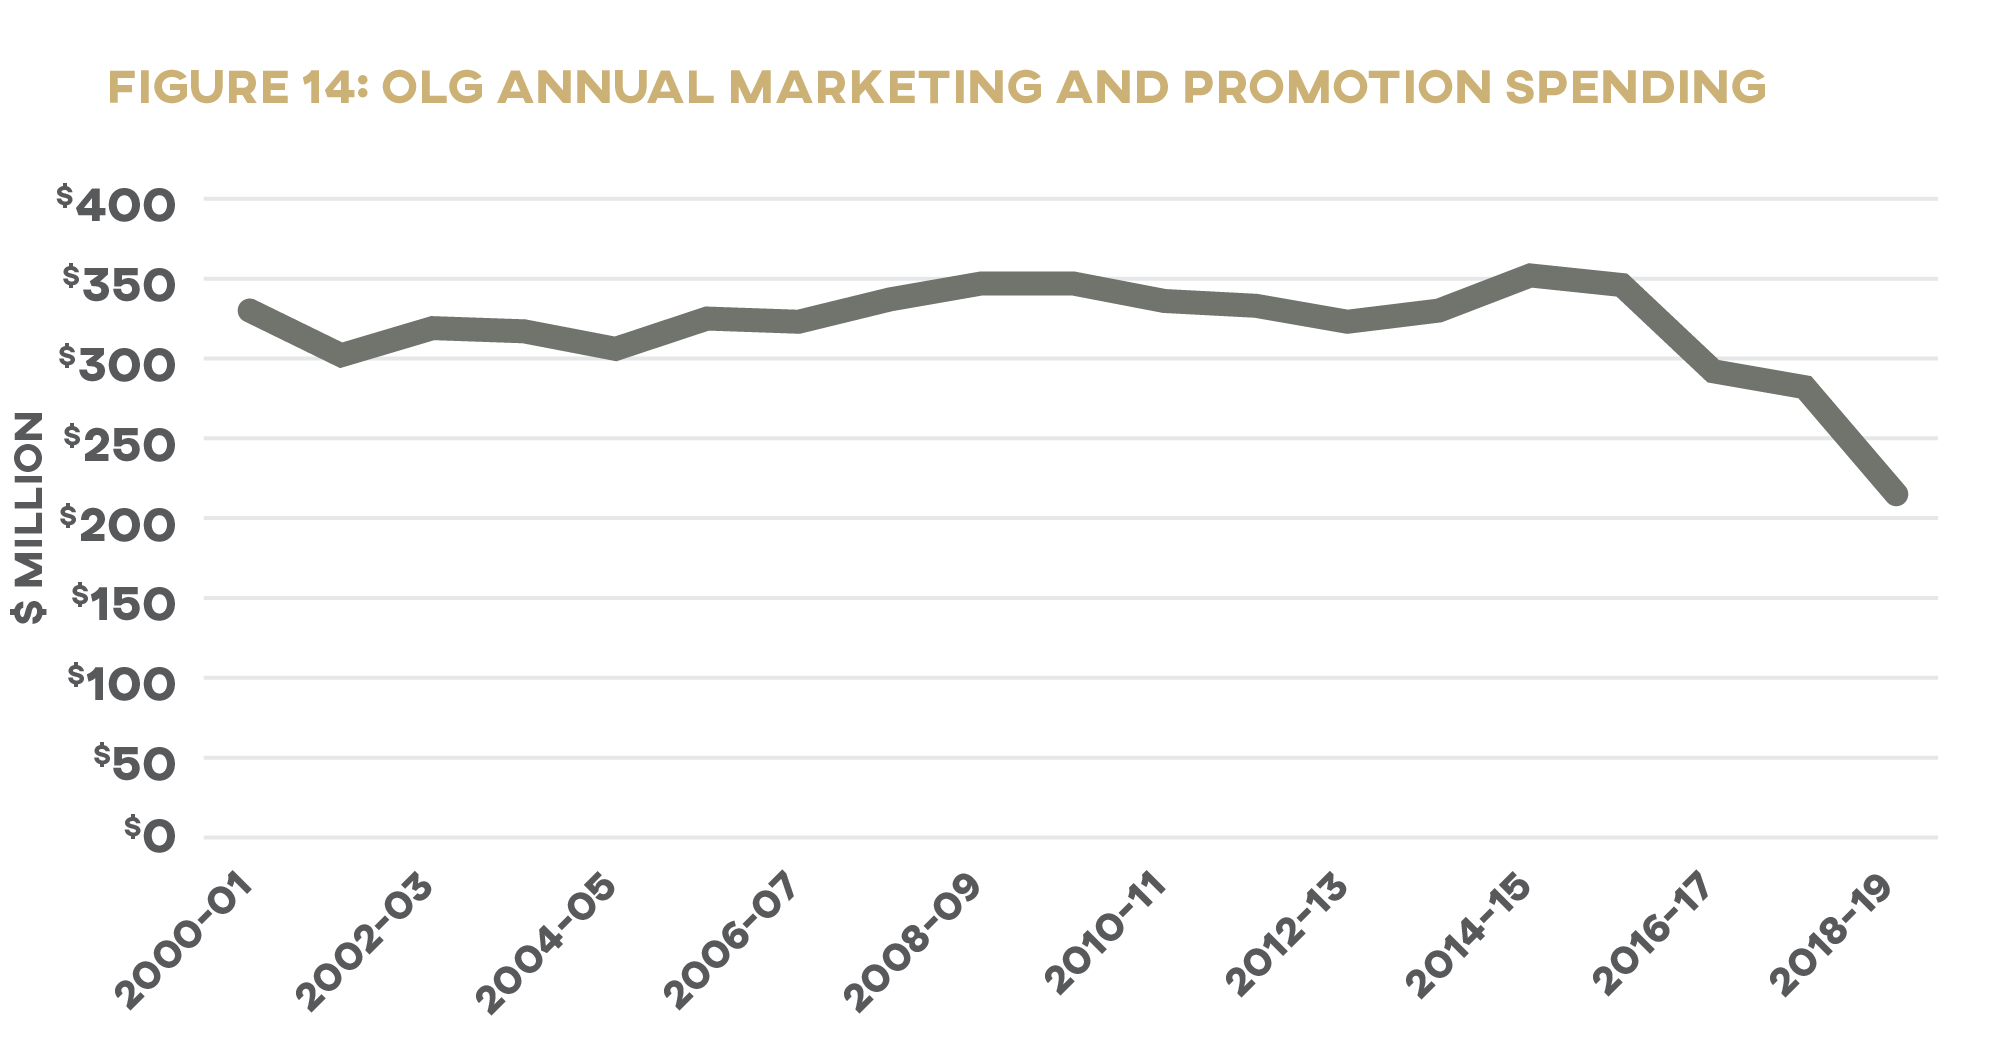
As discussed above, Ontario collects half of this tax using machines designed to overcome players’ voluntary decisions on how much to spend. The state’s dependence on this revenue source calls into question the “voluntary” nature of how citizens part with their money in lotteries, casinos, and other means of gambling. 94 94 See Cosgrave and Klassen, Casino State, 10. In its role as regulator, operator, and beneficiary of gambling, the province will tend, as history has shown us, to focus on its own financial ends, even at the cost of its other roles. OLG’s marketing spending, which has totaled the equivalent of $7 billion over its forty-five-year history and averaged nearly $322 million a year since 2000, is a case in point. 95 95 Figures taken from OLG annual reports and adjusted for inflation. It’s not necessarily that the people want to gamble more—we don’t necessarily know. But we know with certainty that the state wants them to. 96 96 Cosgrave and Klassen, Casino State, 136. See also Hopper, “Why Canadian Governments Are Spending Millions.” A recent review of the literature found a positive relationship between exposure to gambling advertising and gambling behaviour. Bouguettaya et al, “The relationship between gambling advertising.”
This aggressive promotion strategy is conspicuously inconsistent with the marketing restrictions for other government-controlled “vices.” Advertising regulations for alcohol and tobacco are strictly worded so as to prevent artificial stimulation of demand. A booze commercial is permitted only if it “promotes a general brand or type of liquor and not the consumption of liquor in general.” 97 97 AGCO, “Liquor Advertising.” Tobacco products and accessories cannot even be visible to consumers until after they’ve been purchased. 98 98 A few exemptions exist for specialty sellers. Ontario, “Rules for Selling”; Ontario, “Smoke-Free Ontario Act.” The government restrains the market for these products because it knows that unhealthy consumption—more of a risk when they’re more easily available—has social costs. As a moneydraining form of entertainment with a potential for devastating addiction, gambling falls into the same category. 99 99 See Williams, West, and Simpson, “Prevention of Problem Gambling,” 25–42; Williams and Wood, “What Proportion of Gambling Revenue.” And when one examines the means of gambling this becomes even more true. EGMs, as researcher James Doughney has pointed out, are comparable to cigarettes in the way they facilitate harm to their users:
The EGM and tobacco industries intend users to consume their products in precisely the ways that directly, and without further mediation, initiate the causal chain that results in known harms. . . . Both industries supply control-impairing products that, used as intended, will cause them to use the product in harmful quantities. Almost all smokers will smoke potentially lethal amounts. The EGM product, used precisely as intended, will cause users to lose control of time and money in sufficient numbers for the industry to flourish. 100 100 To be very clear, we are not arguing that gambling is as harmful an activity for individual and public health as smoking. That said, we are affirming Doughney’s argument that there are meaningful parallels between EGMs and cigarettes—i.e., that both are intrinsically “harmful or unsafe” and “powerfully control-impairing products. Regular use works to extinguish control by users, and it is this that sets in motion the chain of events and decisions that can cause harm” (312). The addictive and harm potential of EGMs is not identical to that of tobacco products, but the similarities are sufficient to illustrate the policy inconsistency. Doughney, “Ethical Blindness,” 315.
Cigarette packages are plastered with labels that urge consumers to stop smoking, often with graphic images. 101 101 See Government of Canada, “New Health Labelling.” Meanwhile, OLG provides 24/7 access to slots and urges Ontarians try them out with messages like “Fun wins every time!” 102 102 OLG, “Home Page.” But why should the state encourage the kind of fun and excitement that’s premised on making people poorer and risks impoverishing them altogether?

While we acknowledge the persistence of gambling as a fact, and a regulatory role for the state as a limited good, we do not consider its artificial expansion, nor the use of its proceeds as either a fact, or a good. 103 103 See also Institute for American Values, “For a New Thrift,” 25–26. Gambling ads encourage people to think they can win—“The next winner could be you!”— at games they are designed to lose. 104 104 OLG, “Home Page”; see also Bernal, “American People.” In doing so, the state is intentionally cultivating money-losing habits among its citizenry and neglecting more fundamental, positive, and ultimately growth-oriented economic habits.
Habit Forming
Once OLG funds have been disentangled from legitimate tax revenue, then, how could they be used to advance the state’s responsibility to administer justice for the most vulnerable? We put forward a few specific policy options below. Ontario could, for example, redistribute gambling money back to the poor directly. The “voluntary tax” would flow in the same net direction as other tax revenue—from those who have plenty to those who don’t have enough. A common objection to transfer policies such as this is the “beer and popcorn” argument: won’t giving gambling money back to the poor just encourage them to keep gambling? The assumption that low-income families use government cheques to sustain irresponsible spending habits is widespread, 105 105 See, e.g., Milewski, “Federal Liberals Deride.” but evidence suggests the opposite is true. A study on child benefit spending in Canada, for instance, showed that low-income families who received unconditional cash transfers spent more on household essentials—such as home meals, transportation, and child care—and less on alcohol, tobacco, and restaurant meals. It turns out that getting money back in chunks may actually be an incentive to spend it wisely. 106 106 Jones, Milligan, and Stabile, “Child Cash Benefits,” 16. Jones, Milligan, and Stabile note that their findings are consistent with similar studies, such as Kaushal, Gao, and Waldfogel, “Welfare Reform”; McGranahan and Schanzenbach, “Earned Income Tax Credit.”
A second strategy is incentivizing savings. Families who struggle to make ends meet rarely have much to put away for a rainy day. Without any kind of small savings reserve to act as a buffer, they are particularly vulnerable if an unexpected crisis strikes. 107 107 Rothwell and Goren, “Exploring the Relationship”; McKernan, Ratcliffe, and Vinopal, “Do Assets Help Families Cope.” This in turn could force them to turn to unsavoury options in a cash flow emergency: research has found that a household with less than $500 in the bank is over two and a half times more likely than one with $2,000 to have taken out a payday loan. 108 108 Dijkema and McKendry, “Banking on the Margins,” 20.
The need to build the wealth of financially insecure Canadians has never been more apparent given the widespread fragility exposed by the coronavirus-induced economic crisis. Sudden layoffs on an unprecedented scale have demonstrated the importance of assets like emergency savings to cover an unexpected loss of income. 109 109 Many Canadians are asset poor, making them particularly vulnerable to the loss of income accompanying an unexpected layoff. See J. Robson, “Assets in the New Government”; Compass Working Capital, “Why Asset Poverty Matters”; McGill Newsroom, “Half of Canadians Don’t Have Enough Savings.” Yet claims for unemployment benefits are spiking into the millions at a time when close to half of Canadians do not have enough assets to cover their living expenses for three months. 110 110 Rothwell and Robson, “Prevalence and Composition”; McGill Newsroom, “Half of Canadians Don’t Have Enough Savings”; Alini, “Coronavirus.”
Stacking the Deck: Institutions and Savings Habits
It’s important to emphasize here that we’re not suggesting that the poor’s lack of savings is due to a lack of discipline or self-control. As behavioural economists know well, we all have cognitive biases and lapses in willpower, which lead us to make irrational decisions. Which of us hasn’t eaten that extra donut when we knew we shouldn’t? Who among us has ever eaten one potato chip? Giving in to the same temptation hurts a low-income household more than a rich one, though, since the indulgent purchase takes up a greater share of the poor household’s income. 111 111 Banerjee and Mullainathan, “Shape of Temptation,” 3; Karlan, “Helping the Poor Save More.”
Even more significant is the role of financial and social institutions in shaping economic behaviour. Left to our own devices, most of us don’t save nearly as much as we know we should. But there are a host of structures that aim to support saving: the government promises to stretch our kids’ school savings a little further by contributing to our RESPs (Registered Education Savings Plans 112 112 Government of Canada, “Registered Education Savings Plans.” );banks offer personalized plans that encourage us to invest and build up wealth (ours and theirs); the Canadian Pension Plan’s automatic deductions nudge us to put away money for retirement; companies encourage savings by offering matching RRSP contributions as part of employee compensation. Evidence suggests that even the poorest households have a few dollars to spare, which could reasonably be used to start building an emergency savings fund. 113 113 Banerjee and Duflo, “Economic Lives of the Poor.” Yet even though almost all Canadians have access to banking services, the poor don’t benefit from tax-encouraged savings tools and products the way that the middle and upper classes—who have higher taxable incomes and thus more to gain from income-tax exemptions, deferrals, and deductions—do. 114 114 Robson, “Does Canada Have a Hidden ‘Wealthfare’ System?”; Beverly et al., “Determinants of Asset Building,” ES-2; see also Shillington, Are Low-Income Savers. Tax-Free Savings Accounts (TFSAs) were originally designed to provide a savings vehicle appropriate to low-income Canadians, especially low-income seniors. However, there has not been a significant transition from RRSPs to TFSAs among low-income savers in the ten years since TFSAs were introduced, likely because “financial institutions are not tailoring appropriate financial advice to low-income savers” (7). In fact, it is high-wealth savers—those already most targeted by financial institutions offering tailored advice on maximizing wealth—who are increasingly reaping the benefits of TFSAs. This leaves low-income families vulnerable to institutions that discourage savings habits: the gambling industry illustrates the latter category perfectly, urging players to spend their extra dollars instead of putting them away. 115 115 See Institute for American Values, “For a New Thrift,” 29–31.
This wealth-draining system is the foundation of the government’s benefitting from gambling. Ontario makes money from casinos and lotteries only because gamblers come out poorer in the long run. A few lucky winners of astronomical sums may come out ahead, but the deck is stacked in favour of the house, and against the commons. Every dollar of OLG’s net profit to the province is a dollar a player has lost: “For government to win, its citizens must lose.” 116 116 Institute for American Values, “American Declaration,” 4.
Making Sure the Right House Wins: A Broader View of Gambling and the State
It’s hard to see how the government’s encouraging people to gamble more in order to increase its cash flow is good for the citizens it is called to serve, or for its long-term prosperity. A discussion of the intrinsic moral nature of gambling is beyond the scope of this paper—we make no claim as to whether it’s wrong for individuals to gamble, and we do not believe that the authority to make such judgments belongs exclusively with the state. Our concern is instead with how state-run gambling fits in a justly ordered society. The ways in which gambling affects individuals should cause us to examine the broader injustice of a state that relies on a robust gambling industry to pay its bills: “To associate all the evils of gambling with personal choice is to overlook the complicity of a system that needs gamblers in order to flourish.” 117 117 MacNeil et al., “False Eden of Gambling.”
There are, effectively, two schools of thought that support Ontario’s supplementing of its income with gambling revenue, and we can broadly label them as “minimalist” and “activist.” The minimalist group includes those who believe the state should have as small a role as possible in society, getting out of the way so that citizens can be free to make their own choices. Proponents of an activist state, on the other hand, support a larger government, one that takes a more involved role in helping disadvantaged groups (chief among them the poor). Though each of these camps offers its own defense of OLG revenue as a public good, both are inconsistent with how gambling money actually flows in the province.
Gambling in the Minimalist State: “Free” Choice?
For minimalists, OLG revenue keeps taxes down through the voluntary decisions of individuals. Private citizens should be free to spend their money however they choose; the state has no business telling them not to buy lottery tickets or play slot machines. If some people want to give more money to the government, all the better for those who’d rather spend their paycheques elsewhere. And yet the province’s insatiable expansion of gambling only gives more money to the state, creating a bigger government—exactly the situation that minimalists want to avoid.
The increasingly sophisticated “built-in addictive structure” 118 118 Cosgrave and Klassen, Casino State, 8–9. of gambling equipment and facilities is another challenge to the minimalist approach, particularly its avid defense of free choice. As Matthew Crawford points out, “The defense of machine gambling by libertarians, as well as the industry’s own portrayal of it as free-spirited gaming, assumes an autonomous subject capable of acting in his own self-interest. On the other hand, the machines and every aspect of the casino environment are deliberately engineered to induce people to play ‘to extinction.’” 119 119 Crawford, World Beyond Your Head. The architects of the gambling experience know exactly which behavioural buttons to press to keep players glued to the game. 120 120 That is, until the player no longer has any money to continue playing. Schüll, Addiction by Design; Crawford, “Autism as a Design Principle”; Dowling, Smith, and Thomas, “Electronic Gaming Machines”; MacLaren, “Video Lottery”; Gambling Research Exchange Ontario, “Slots and VLTs”; Centre for Addiction and Mental Health, “About Slot Machines”; Rosengren, “How Casinos Enable Gambling Addicts.” The rapid expansion of online gambling raises similar concerns: in their 2007 review of the literature on internet gambling, Williams and Wood find “good evidence that online gamblers are significantly more likely to be problem gamblers” (24); they also note that the outsized proportion of gambling revenue contributed by problem gamblers “is likely to be even higher for online gambling” (25). Williams and Wood, “Internet Gambling”; see also Gambling Research Exchange Ontario, “Online Gambling.” How far should the free will argument go when the natural human response to these situations is impaired control? 121 121 See Dickerson, Measurement, cited in Cosgrave and Klassen, Casino State, 146.
Gambling in the Activist State: Who’s Paying?
On the face of it, state-run gambling appeals to those seeking an activist state. If Lotto 6/49 tickets bring in more money for the welfare system, the expansion of Ontario’s gambling sector should continue full speed ahead—the province’s schools, hospitals, and social programs need all the resources they can get. But as we’ve shown, using gambling money to fund these programs means that a disproportionate share of the cost is shouldered by the poor and marginalized. The activist’s preferred tax system is progressive, in which the government collects a higher percentage of income from wealthier citizens—who have more to spare—in order to ease the burden on low-income families who need a boost. Since provincial gambling revenue flows in the opposite direction, it’s hard to see how a government addicted to this kind of cash is helping its most vulnerable citizens.
Habits of the Gambling State
One of the responsibilities of government is to enable and encourage good habits, including economic ones, and to shape structures that promote the economic well-being of its citizens. Governments cannot simply ignore the underlying issues of economic justice at stake when it comes to its involvement with gambling. Ignoring these questions is certainly no problem for those who stand to benefit from the unbridled expansion of gambling, including the revenue-hungry OLG. For them, as Crawford points out, “our moral squeamishness about being ‘judgmental’ smells like opportunity.” 122 122 Crawford, “Autism as a Design Principle,” 107.
Ontario’s population is immersed in an environment where losing money on casino games and lottery tickets is encouraged as a normal, harmless form of fun. This environment fosters a distinct set of habits, attitudes, and dispositions that have social and economic consequences. When one person buys a lottery ticket or two, we have no problem laughing it off as a waste of money—we all know the odds. Yet we rarely think about what the embrace of gambling habits might be doing to our province as a whole.
Behind the seemingly innocent thrill of risk involved in putting money on the line lies a more insidious get-rich-quick impulse, the seductive appeal of getting something for almost nothing. Ontario, we suggest, should think more seriously about the daydream of easy escape at the heart of gambling marketing. “Dream to the Max,” urges Lotto Max. 123 123 See, e.g., OLG video advertisements at Justin Dallaire, “Lotto Max.” “It’s fun to think about round-the-globe travel, sunny skies, fulfilling wishes and dreams.” 124 124 OLG, “PlaySmart.” Or, the infamous Lotto 6/49 jingle: “Just imagine.” That OLG recognizes the power of such visions is an indication that it is aware of the power of imagination in shaping its audience’s habits and vision of the good life. 125 125 See Smith, Imagining the Kingdom. But are these the kind of economic desires a government would want to encourage in its citizens? Promoting bad risks and false hopes rather than prudent saving habits and discipline hardly seems responsible for a province with an average household debt of over $150,000 and public debt over $338 billion, draining over $12 billion worth of interest payments from the budget every year. 126 126 Shun, “Rising Ontario Household Debt”; Ontario Treasury Board Secretariat, Public Accounts of Ontario 2018–19. We need to keep in mind that the more money Ontario spends trying to sell the big win, the more it strengthens “the illusion of the quick fix, the easy way out of our human dilemmas, the plausibility of soft and painless solutions to profoundly complex problems.” 127 127 Dieleman et al., “Report 28,” 265. Does the government really want to encourage a province of fools? 128 128 Henry Fielding, 1732, quoted in Chambers, “Nod to Lotteries.”
Gambling is not the way to financial security, either for individuals or for the province. 129 129 Dadayan, “State Revenues from Gambling.” Encouraging Ontarians to gamble more just moves the province’s money around, circulating citizens’ dollars rather than directing them toward value-added production. 130 130 See, e.g., James Cosgrave’s comments in Baxter, “Why Expanding Casinos,” and in Frank, “Casinos”; see also Institute for American Values, “American Declaration.” And while some—including, of course, the OLG—insist that gambling creates jobs, others have countered that “most of the jobs created in gambling only substitute one for one (at best) for the jobs destroyed when expenditure switches from other activities.” Henriksson and Lipsey, “Should Provinces Expand Gambling?,” 263. Indeed, a comprehensive national report on gambling commissioned by the Australian government noted that if gambling were scaled back, “some tax revenue would be lost. However, spending diverted from gambling would still be taxed, so the actual loss in revenue would not be equivalent to the apparent loss in revenue” (Government of Australia, Inquiry Report, 6.40). Lotteries and casinos are also a highly inefficient way for the government to generate revenue: recall that Ontario gets only 41 cents of every dollar that leaves gamblers’ pockets. 131 131 OLG’s net win was $5.97 billion in 2018–19; Ontario received $2.47 billion of this total, with the rest being used to cover expenses. See above, “Where the Chips Lie,” and OLG, “Annual Report 2018–19.”
As important as it is to recognize that Ontario’s gambling addiction is financially irresponsible, it is far more important to point out the province’s social irresponsibility. These days, it’s common for discussions of government responsibility to focus almost exclusively on growing the economy. But this materialistic emphasis is a fundamental distortion of the proper role of the state in the lives of its citizens: “Contrary to notions current in North American society, the maximizing of national wealth and the raising of our living standards is not the principal responsibility of government. . . . It is the undeniable and irrevocable obligation of governments to rule with justice for all and with charity towards the weak and powerless.” 132 132 Dieleman et al., “Report 28,” 265. A government should promote healthy economic growth, yes, but this should always be subordinate to its defining responsibility to administer justice for the common good. 133 133 Leman et al., “Report 28,” 265; see also Pontifical Council for Justice and Peace, Compendium; Moscovich, Gambling with Our (Kids’) Futures.
Turning Bad Habits into Good: Policy Options
When the state does its part to advance a positive vision of economic life, it nurtures in its citizens virtues that benefit not just pocketbooks (both private and public) but society as a whole. 134 134 McCloskey, “Bourgeois Virtues?” Instead of investing in more casinos or new kinds of lotteries, the government might want to consider how it could get its citizens involved in activities that promote genuine economic growth for all. Contrary to what lottery ads would have Ontarians believe, people shouldn’t hope to get something for nothing. It’s time for government to fulfill its responsibility to turn bad habits into good. But how? Below we offer a series of policy recommendations.
1. Return OLG Profits to the Poor Through Cash Transfers.
The first option policy-makers could pursue is simple: give gambling money right back to low-income families. Instead of keeping OLG revenue for itself, the government could divvy up the annual profits and cut cheques to the province’s neediest households: let’s call it the Ontario Gaming Equality Benefit (OGEB). Such a system could be tied to income levels, based on the same sliding scale used for, say, the Canada Workers Benefit. 135 135 Prior to 2019, the CWB was known at the Working Income Tax Benefit (Government of Canada, “Canada Workers Benefit”). The province makes these kinds of unconditional transfers already—take Ontario Works or ODSP, for instance—which means that OGEB could be used to enhance existing programs. As with other transfers, OGEB could be designed to help families support their kids, giving a boost those who have to cover child-related expenses. This kind of policy would be straightforward, relatively inexpensive to administer, and certain to be more needed than ever in the aftermath of the COVID-19 economic crisis. But while OGEB is a simple way for Ontario to quit its bad gambling habit, it doesn’t set up any good habits to take its place. And it might also encourage governments to reallocate existing spending in its general expenditures.
2. Use OLG Profits to Incentivize Saving in Dedicated Low-Income Savings Accounts.
Alternatively, OLG profits could be used to incentivize savings by contributing to savings accounts for low-income families. This approach might follow the RESP model: the government tops up the savings account by a certain percentage of the account holder’s contributions. A more ambitious model could mirror the Individual Development Accounts (IDAs) offered throughout the United States, which are savings accounts designed to help low-income households develop assets. In addition to having their contributions matched by a mix of public and private funding, IDA holders typically take financial literacy classes; matched withdrawals can be used only for investments such as post-secondary education, home ownership, or small business start-up expenses. 136 136 Boshara, “Individual Development Accounts”; Comptroller of the Currency, “Individual Development Accounts”; Rothwell and Sultana, “Cash-Flow and Savings Practices.” See also Sherraden, Assets and the Poor; Sherraden, McBride, and Beverly, Striving to Save. Ontario could follow the IDA model closely, using OLG proceeds to help the poor build long-term assets (i.e., buying a home or starting a business), or adapt it as needed to help build short-term rainy day funds.
Administering these kind of state-supported savings accounts—monitoring contributions and withdrawals, providing financial literacy programs, enforcing restrictions, and so on—would be expensive. 137 137 See Boshara, “Individual Development Accounts.” Evidence-based, innovative policy development would be required to make sure that account holders could access their savings only for legitimate emergencies or investments: if restrictions on when account funds can be withdrawn are too lax, the savings account risks turning into another chequing account, particularly given the constrained incomes of the poor. But these challenges do not make policy development unfeasible. Since both models have been in use for several years, policy-makers could draw from an abundance of research and resources if they set up either kind of low-income saving system in Ontario.
3. Prize-Linked Savings Incentives
If Ontarians want the excitement of chance and the thrill of winning, why not channel those desires toward money-saving rather than money-losing activities? We offer two models of prize-incentivized saving that have met with notable success in other jurisdictions.
3a. Allow Financial Institutions to Offer Prize-Linked Savings Products.
Prize-linked savings (PLS) is a great example of how the province could help make saving fun. In savings accounts that follow the PLS model, account holders forgo some or all of the interest they would normally earn on their savings in exchange for the chance to win a prize. More deposits earn savers more entries in the draw, increasing their chances of winning and so rewarding greater saving. One such program, called Save to Win, has seen great success across the United States since its launch by Michigan credit unions in 2009. With only a small deposit of $25, members can open a twelve-month share certificate and earn entries into drawings for prizes, which usually range from $25 to $5,000. Account holders have saved nearly $200 million through this program over the past ten years. 138 138 Save to Win, “History of Save to Win”; Michigan Credit Union League, “Save to Win.” Meanwhile, Walmart customers moved more than $2 billion through the PLS program linked to the retailer’s prepaid cards in the program’s first two years of operation. 139 139 Eckert, “Two Years Later.”
Not only have PLS products been popular when introduced, research also suggests that they are particularly appealing to low-income savers at risk of financial shocks 140 140 Filiz-Ozbay et al., “Do Lottery Payments”; Atalay et al., “Savings and Prize-Linked Savings Accounts,” 101; Kearney et al., “Making Savers Winners,” 5, 12; Tufano, “Saving Whilst Gambling,” 322; Commonwealth, “Prize-Linked Savings.” and to those less likely to use traditional banking institutions. 141 141 Walker, “How to Trick People into Saving”; Commonwealth, “Walmart MoneyCard Prize Savings”; Kearney et al., “Making Savers Winners,” 18; Cole, Iverson, and Tufano, “Can Gambling Increase Savings?,” 2; Commonwealth, “State of Prize-Linked Savings.” Importantly, studies have found evidence that PLS does not act as a substitute for other forms of saving, but attracts new savings and even new savers—earning interest isn’t much of a draw for those who don’t have much to put away. 142 142 Cole, Iverson, and Tufano, “Can Gambling Increase Savings?” 37; Atalay et al., “Savings and Prize-Linked Savings Accounts,” 100; Filiz-Ozbay et al., “Do Lottery Payments,” 17; Pew Charitable Trusts, “Can Contests Help”; Commonwealth, “Prize-Linked Savings.” A PLS account is cheaper and easier to administer than an IDA, making PLS products attractive to the institutions that offer them as well. 143 143 Kearney et al., “Making Savers Winners,” 2–6. Given the regulatory barriers to non-government institutions implementing games of chance, however, getting PLS products into the Canadian market could be a challenging process. 144 144 And given the evidence that saving in PLS accounts can act as a substitute for lottery expenditure, we anticipate opposition from the gambling industry. See Cole, Iverson, and Tufano, “Can Gambling Increase Savings?,” 2; Filiz-Ozbay et al., “Do Lottery Payments,” 17–18; Kearney et al., “Making Savers Winners,” 12–14. Even if these barriers were removed, making PLS accounts accessible to as many low-income Ontarians as possible would still require widespread buy-in from financial institutions. 145 145 Pew Charitable Trusts, “Can Contests Help”; see also Commonwealth, “State of Prize-Linked Savings.”
3b. Establish a Lottery Bond Program.
Another example that Ontario could follow is Britain’s NS&I (National Savings and Investment), which encourages savings by offering the chance to hit the jackpot. Customers can buy prize-linked Premium Bonds from NS&I for £1 each. Instead of earning interest on these bonds directly, buyers have a shot at winning between £25 and £1 million each month. The minimum investment is only £25—manageable even for those with very limited incomes—and every bond number gets a separate entry in the draw, an incentive to save more. 146 146 National Savings and Investments, “Premium Bonds.” And even though inflation may erode the real value of bond holders’ money over time, this slight shrinkage is still much better than giving up the money altogether through a standard lottery ticket. Premium Bonds are immensely popular in the UK: 21 million Britons had nearly £80 million ($137 million cad) invested in these bonds at the start of 2019. 147 147 Barker, “Premium Bonds.”
Using prizes to promote bond sales could be an innovative way for the government to raise much-needed cash as it works to recover from the financial damage of COVID-19. Ontario could use OLG profits to cover the costs associated with getting the lottery bond program off the ground. Requiring all lottery retailers to offer lottery bonds alongside standard lotto tickets would help raise awareness of the new product—promoting a good habit should hardly be given less effort than promoting a bad one. While this option would not uproot the reliance on luck that the lottery habituates in its players, it would at least co-opt this impulse for a more positive end.
4. Increase Funding for Problem Gambling Services from OLG’s Marketing Budget
In the most recent fiscal year for which information is available about problem gambling funding, OLG spent $282 million on marketing and promotion expenses, but only $64 million on problem gambling programs. 148 148 See above discussion of problem gambling. OLG, “Annual Report 2017–18,” 4–5, 43. This means that OLG is spending four and a half times as much on marketing as it is on gambling addictions. The relationship between gambling advertising and behaviour is not yet well researched, but at least two recent studies have suggested that “advertising prompts more frequent and riskier gambling.” 149 149 Newall et al., “Gambling Marketing,” 54. We propose that OLG use its advertising line to at least double its problem gambling budget, which would still leave over half its marketing funds untouched. This policy would strengthen problem gambling research, prevention, and treatment initiatives in Ontario and scale back Ontario’s artificial stimulation of the gambling market.
Appendix: Data and Calculations
Unless otherwise stated, all OLG financial information was taken from the corporation’s annual reports and financial statements. OLG annual reports from fiscal 2014–15 to present are available on the corporation’s website, 150 150 OLG, “Annual and Financial Reports.” and reports from 2002–3 are available through the Legislative Assembly of Ontario’s website. 151 151 Legislative Assembly of Ontario, “Index of /ser/187757.” For all previous years, the financial statements of OLG and its predecessors (OLC, the Ontario Lottery Corporation, and OCC, the Ontario Casino Corporation) were included in the Public Accounts of Ontario, which were also the source of total provincial revenue data. Digital versions of Ontario’s Public Accounts are available at the Government of Ontario website and at the Internet Archive. 152 152 Internet Archive, “Public Accounts of Ontario”; Ontario, “Public Accounts of Ontario: Past Editions.” OLG figures for 2001–2 were accessed at Ontario, Public Accounts of Ontario 2001–2002. Digital versions of OLC annual reports for years 1976–87 have also been made available by the McGill University Library at the McGill Digital Archive: Canadian Corporate Reports Project. See McGill Libraries, “Canadian Corporate Reports.” The authors have made every effort to ensure consistency across OLG revenue and expenditure categories over time. However, data may not always be directly comparable between years due to changes in OLG’s financial reporting practices (including, but not limited to, classification of different business lines and revenue recognition policies). Figures have been adjusted for inflation where necessary.
Demographic Calculations
The primary source of demographic information was Statistics Canada; data taken from other surveys and secondary research are noted in the footnotes. All income data were taken from Statistics Canada’s Canada Income Survey (CIS). 153 153 Statistics Canada, “Table 11-10-0193-01.” Since CIS figures are reported in 2018 constant dollars, all data from other sources needed to be adjusted for inflation where necessary to be accurately comparable. CIS provides average income data for each income decile; the two income concepts of interest for our calculations were adjusted total income and adjusted after-tax income. 154 154 Total income refers to “income from all sources including government transfers and before deduction of federal and provincial income taxes,” while after-tax income refers to “total income less income tax.” Statistics Canada adjusts these figures according to household size: “In order to take into account the economies of scale present in larger households, the different types of income are adjusted by dividing the household income by the square root of the household size” (Statistics Canada, “Table 11-10-0193-01”). In order to make these data comparable to gambling expenditure data from the Survey of Household Spending (SHS), 155 155 Statistics Canada, “Table 11-10-0223-01.” income deciles were converted to quintiles. To calculate what proportion of total income, on average, each quintile pays in income taxes, after-tax income was subtracted from total income and the difference divided by total income (see table 1).
Average data of annual household gambling expenditure are published in Statistics Canada’s SHS under an expenditure category called “games of chance.” 156 156 This category is defined as “Expenditures for all types of games of chance. The expenditures are not net of the winnings from these games.” (Statistics Canada, User Guide). Expenditure data can be viewed by province and income quintile, the categories relevant for this paper. While Statistics Canada is a reputable source with rigorous data standards, gambling expenditure data nevertheless have several significant limitations and as such should be treated with caution. Due to changes in data-collection methodology, data were available only for 2010–17 inclusive, and many figures were suppressed as “too unreliable to be published.” 157 157 When the CV (coefficient of variation) of a cell on a Statistics Canada data table is 35 or higher, the cell lists “F” instead of a numerical value. As such, SHS figures used in the paper represent the average of all available data from 2010 to 2017. For example, average expenditure on games of chance for households in Ontario’s lowest quintile was unavailable for 2012, 2014, 2016, and 2017, so the average of 2010, 2011, 2013, and 2015 was used.
As discussed above in the body of the paper, total spending on games of chance reported by Statistics Canada is dramatically less than total recorded OLG revenue (see table 2). The difference between reported and actual spending was calculated by comparing SHS data to OLG revenue (before prizes and expenses, since expenditure on games of chance in the SHS is not net of winnings). For each year, average annual household expenditure on games of chance for all quintiles (i.e., for all households) was multiplied by the number of households in Ontario to calculate the total amount of gambling spending reported in the SHS. 158 158 Statistics Canada, “Table 36-10-0101-01.” This total was then divided by OLG’s total reported revenue for that year to find reported spending as a percentage of actual spending. This percentage was then used to estimate actual spending for each income quintile, based on the assumption that households in each income quintile underestimate the amount they spend on games of chance by, on average, approximately the same margin. Though SHS data does not provide information on how the gap between estimated and actual spending is distributed across income quintiles, we believe it is reasonable to assume that actual spending does rise with disposable income levels. 159 159 While the authors are unaware of any research regarding patterns of under- or overestimation of gambling expenditure as a function of income quintile, there is evidence to suggest that problem gambling does not have a significant impact on expenditure reporting errors. One study “found gambling expenditure exaggeration and minimization to be equally common for all four types of gamblers. . . . If there is an over or underestimate of expenditures relative to revenues, it probably does not affect the proportion derived from problem gamblers because of equivalent exaggeration/minimization in each group” (Williams and Wood, “Demographic Sources,” 42–43). While the authors are unaware of any research examining the effect on income on underreporting gambling expenditures, there is some evidence from studies on underreporting other patterns of risky or harmful behaviour (e.g. drug use) that those with lower incomes are more likely to deny or underreport the extent of their participation in such behaviours. 160 160 See Fendrich and Vaughn, “Diminished Lifetime Substance Use”; Fendrich and Kim, “Multiwave Analysis”; Fendrich and Johnson, “Race/Ethnicity Differences.” More importantly, the magnitude of the pattern does not negate the problem with the pattern itself—that is, the provincial government’s collecting proportionately more revenue from low-income households compared to higher-income households. Estimated actual data should nevertheless be treated with caution.
Since Statistics Canada collects expenditure data from Canadians only, it is more accurate to exclude from OLG’s total any revenue the corporation reported collecting from American patrons at its border casinos (see table 3). 161 161 Methodology adapted from Williams and Volberg, “Gambling and Problem Gambling in Ontario.” This non-Ontario revenue was calculated based on “rated U.S. play”—the estimated percentage of revenue that comes from American patrons at both OLG’s Niagara and Caesars Windsor casinos—as recorded in OLG annual reports. For each of the relevant resort casinos, rated US play was multiplied by the total revenue generated by the casino. OLG’s estimated total revenue from American patrons (i.e., the sum of products calculated for Niagara and Caesars Windsor) was divided by total OLG revenue, providing an estimate of the percentage of OLG revenue from American patrons. Since OLG stopped publishing revenue generated by each resort casino after 2015–16, the average percentage of OLG revenue from American patrons for all years with available data (1.79%, from 2009–10 through 2015–16 inclusive 162 162 Though 2009–10 data were not compared to SHS figures, these data were included to improve accuracy of calculation estimates based on averages. )was used for 2016–17 and 2017–18. For the years in which rated US play for Niagara was not available (2011–12 to 2015–16 inclusive), the average of available years (4.08%) was used. Our calculations assume all other revenue came from Ontario residents. 163 163 We acknowledge that some portion of this OLG revenue was likely derived from out-of-province residents, but given that similar gaming options are available in other Canadian provinces, it is reasonable to assume that such revenue does not represent a significant share of OLG revenue. For a discussion of this issue and calculations supporting a similar conclusion in the context of Alberta, see Williams, Belanger, and Arthur, “Gambling in Alberta,” 93–94.
EGM (Slot Machine) Revenue Calculations
The proportion of OLG revenue generated by slot machines was calculated for fiscal 1994-95 (i.e., the first year of the Ontario Casino Corporation) to present (see table 4). Segmented information in OLG annual reports included the total revenue generated by slot machines for fiscal 2000–2001 through 2010-11 inclusive. For each of these years, slot machine revenue was divided by total land-based gaming revenue; for years in which slot machine revenue data were not published in OLG’s annual reports, the average of all available years (88.35%) was used to estimate the proportion of land-based gaming revenue generated by slots. Land-based gaming’s net profit to Ontario was calculated by adding land-based gaming net income (after prizes and expenses) to win contribution (recorded as an expense, but paid directly to the province: OLG resort casinos and the Great Blue Heron Casino are required to remit 20 percent of gaming revenue to the provincial government). These totals were divided by OLG’s total net profit to Ontario. The proportion of net profit to Ontario from land-based gaming was multiplied by the proportion of land-based gaming generated by slot machines to estimate the proportion of OLG’s net profit to Ontario—that is, Ontario’s total income from gambling— derived from slot machines.
Data Tables
Data used for the calculations in this paper (i.e., averages of all available data for years 2010–17 inclusive) are presented below in tables 1 through 4. Unless otherwise stated, all financial figures are presented in 2018 constant dollars. Figures in italics are authors’ estimates based on other calculations. 164 164 While every effort has been made to ensure that these figures are reasonably accurate, we acknowledge that some of the assumptions informing the calculation of these figures are supported by somewhat limited evidence. As such, these figures should be used with caution.