

Table of Contents
Table of Contents
Key Points
- In 2024, Canada posted a total fertility rate of 1.25 children per woman, a historic low. Low fertility affects a society’s sense of well-being and happiness, in addition to affecting the sustainability of the social safety net, economic productivity, and labour force capacity.
- This paper discusses the results of a 2025 survey on fertility preferences, expectations, and outcomes of 3,000 Canadian women and men aged 18 to 44. Canadian women have an ideal family size of 1.97 children. For men, the ideal is 2.13 children.
- Canadians who achieve their fertility desires report being much happier than other Canadians. “Overshooting” the desired number of children has a larger negative impact on life satisfaction compared to “undershooting.” “Undershooting” desired fertility is far more common than “overshooting,” however.
- Compared to Canadians in general, Canadians of East Asian ancestry have a lower desired family size, on average (1.80 children). Canadians of African (2.76 children) or Middle Eastern (2.63 children) ancestry have a higher desired family size.
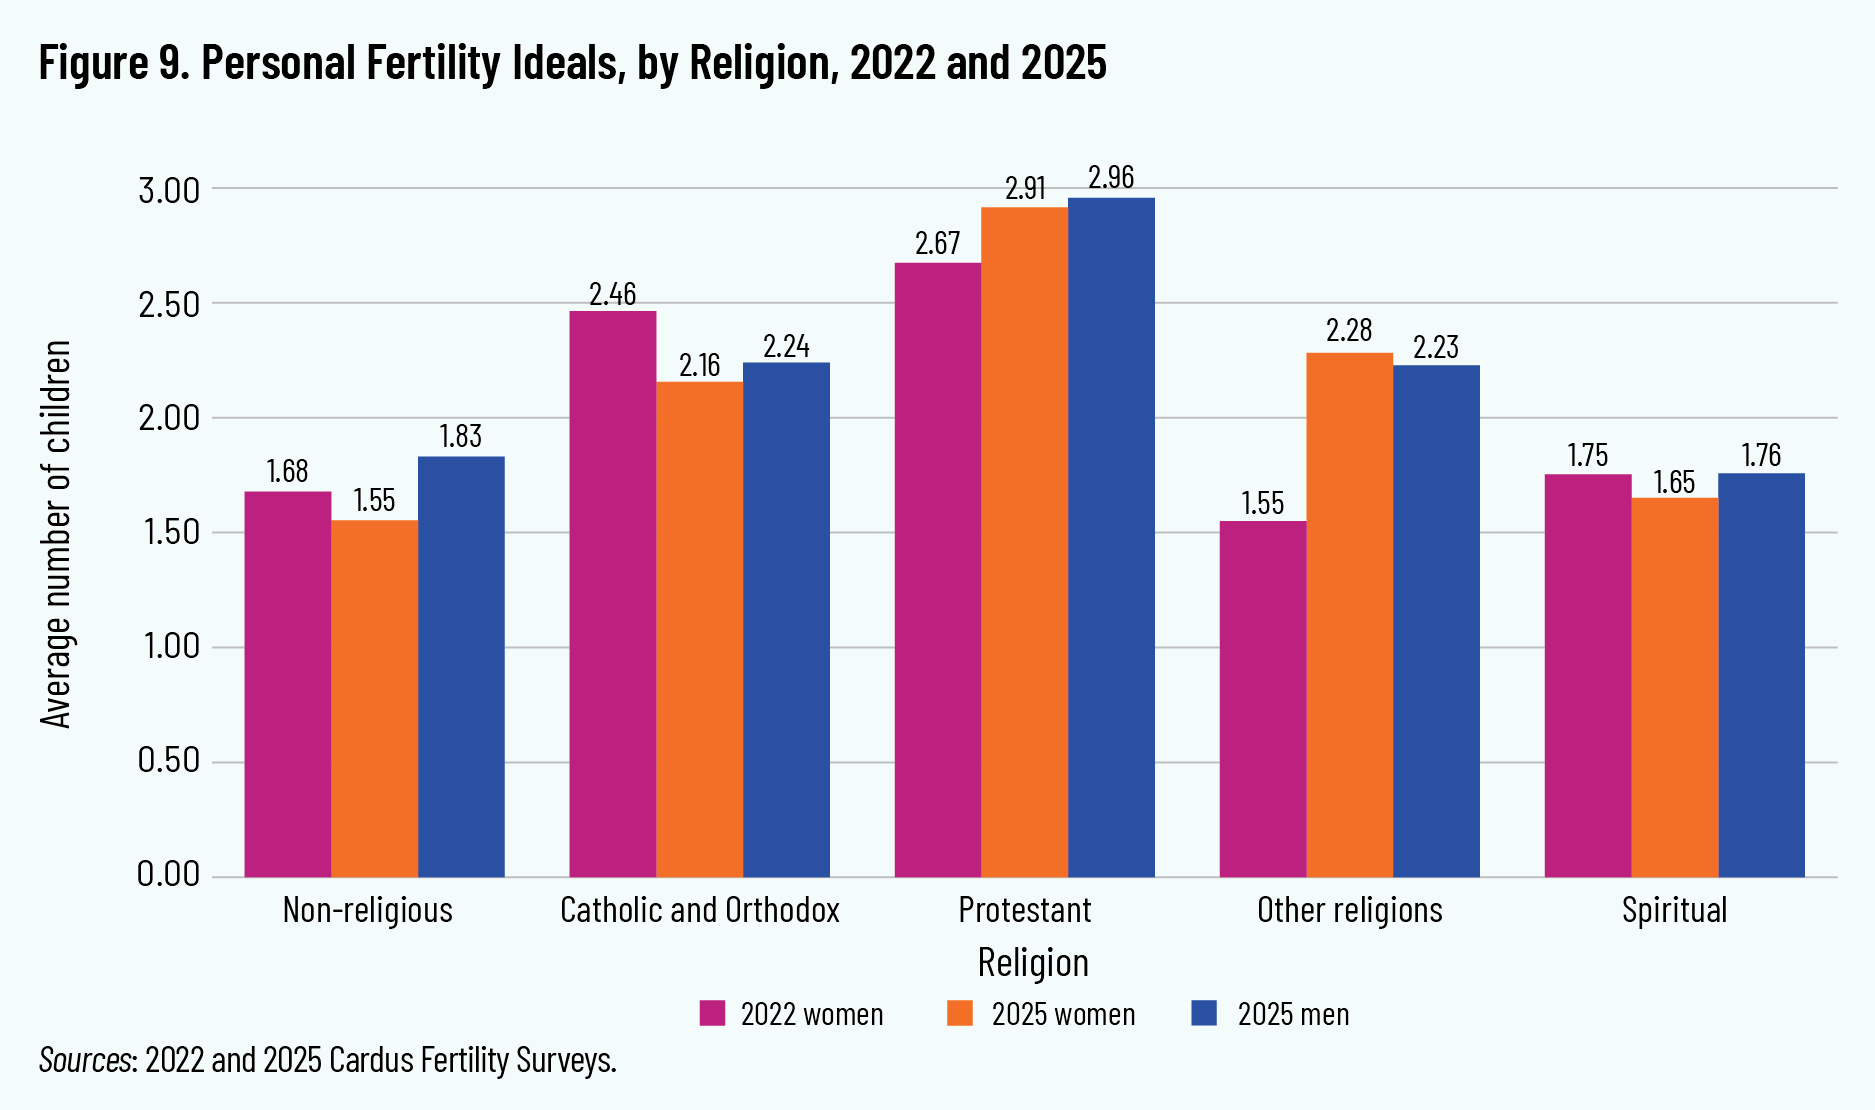
- Nonreligious women desire 1.55 children on average, and non-religious men desire 1.83. By contrast, Protestant women and men desire about three children, and Catholic, Orthodox, and Canadians of other faiths have ideals just over two children.
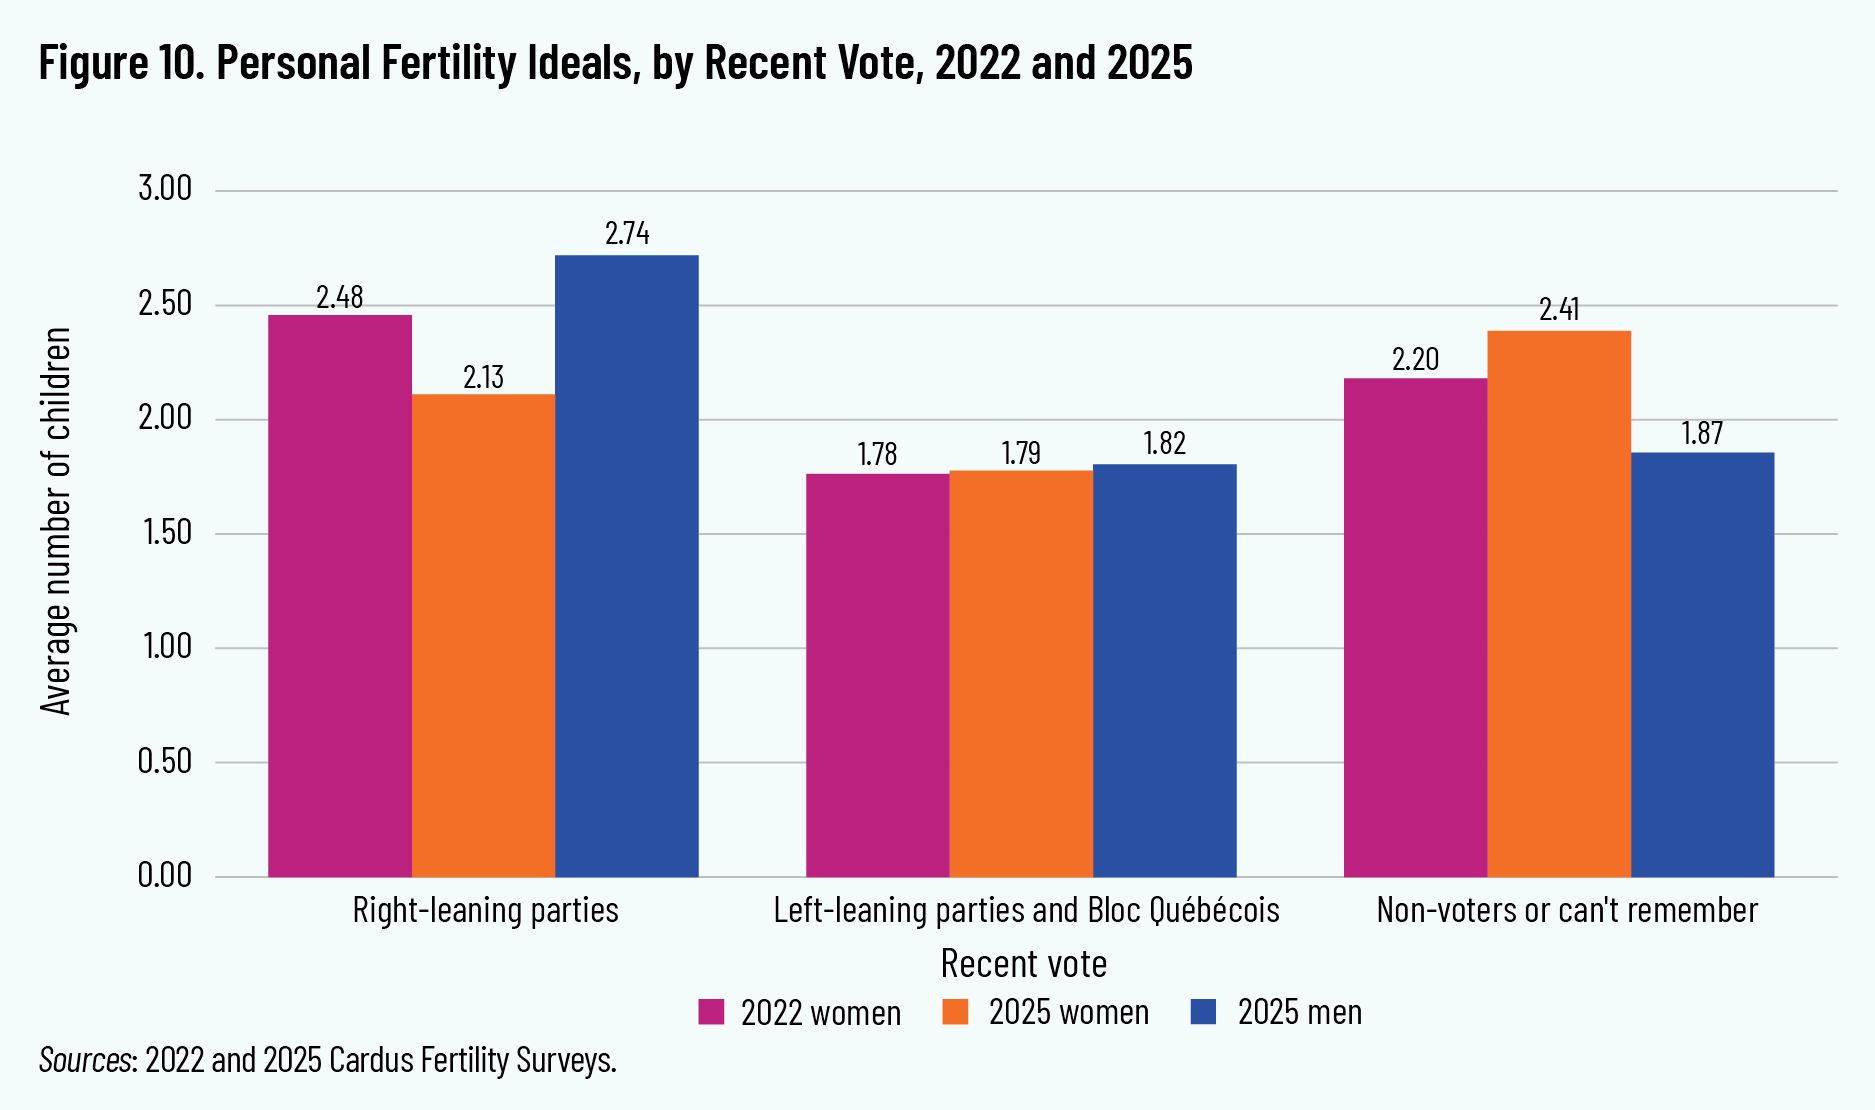
- Women with a graduate degree desire more children than women whose highest level of education is a high school diploma or undergraduate degree. Canadians who voted for right-leaning parties have higher fertility ideals than those who voted for left-leaning parties or the Bloc Québécois, and Canadians with household incomes under $50,000 have lower fertility ideals than those with higher household incomes.
- Among factors contributing to Canadians’ fertility decisions, life-timing issues and finances loom large. Notably, concerns about the cost of childcare or access were higher in 2025 than in our previous survey in 2022.
- Women and men report different obstacles to their family-formation goals. Women are more worried about the degree of support for parenting, childcare supports, and other care obligations. Men are more worried about finances, employment conditions, or the state of the economy.
Introduction
In 2024, Canada posted a total fertility rate of 1.25 children per woman, a historic low. This was down 0.02 from the previous year—also a historic low at the time. 1 1 Statistics Canada, "Fertility Indicators, Provinces and Territories.” Complete citations are provided for all sources at the end of this report. Canada is now considered among the ‘lowest-low’ fertility countries of the world. Policymakers should be concerned about the risk that low fertility poses to the sustainability of the social safety net, economic productivity and equality, and labour force capacity. But we should also be concerned about how living in a low-fertility society influences Canadians’ well-being and even their sense of happiness. When individuals struggle to achieve the family life they desire, life is worse for everyone.
In our previous paper, “She’s (Not) Having a Baby,” we presented the results of our 2022 survey exploring family and fertility preferences, expectations, and outcomes among Canadian women. 2 2 Stone, “She’s (Not) Having a Baby.” We found that nearly half of women at the end of their reproductive years had fewer children than they wanted. We asked women in the survey who desired to have more children, but indicated they were unlikely to have children in the near-term, about the most influential factors in delaying their intended fertility. We found that the perceived burden of parenting, including the risk of compromising self-development, were larger factors than the cost of housing or childcare.
This paper reports on a new 2025 wave of our 2022 survey which is expanded to include Canadian men. We asked a fresh panel of respondents about their perceived general ideal family size for a typical family and about their personal ideal family size. We also asked about how many children they intend to have. We examine ideals and intentions by region, ethno-cultural background, and religious affiliation. We explore the connection between ideals, intentions, and achieved fertility, and the impact of this on a sense of general and family life satisfaction.
Previous longitudinal data suggest that fertility preferences are strong predictors of subsequent fertility. 3 3 Bumpass and Westoff, “The Prediction of Completed Fertility”; Coombs, “Reproductive Goals and Achieved Fertility”; Cleland et al., “Fertility Preferences.” Listening to and valuing the voices of women and men regarding their vison for family life provides important insight in understanding our historic low fertility in Canada, and informing how policymakers can respond.
Methodology
This study is based on a survey commissioned by Cardus and conducted by the Angus Reid Group in July 2025. We surveyed 3,000 women and men in Canada aged 18 to 44 about fertility ideals and intentions. Our sample had six stratified elements: 375 foreign-born women, 375 foreign-born men, 750 Anglophone native-born women, 750 Anglophone native-born men, 375 Francophone native-born women, and 375 Francophone native-born men. The sample was stratified in this way to ensure good coverage of Canada’s diverse society. Respondents were re-weighted to ensure that they were representative of the 2021 Canadian Census results by age, sex, origin, language, religion, and childbearing history. Incidence rates and completion times for native-born Anglophone and Francophone respondents were similar and within normal ranges; incidence rates for foreign-born respondents were low, indicating some difficulty recruiting these respondents. This survey extended work begun in our 2022 survey, which was also re-weighted to match the 2021 Canadian Census results, to ensure maximum comparability between our 2022 and 2025 surveys. When we previously published reports based on the 2022 survey, 2021 Census microdata were not yet available; as a result, we calculated weights from less detailed tabular data from the Census. As microdata are now available, we have re-weighted our 2022 survey results for all comparison tables shown in this report. Both the 2022 and 2025 surveys are weighted on the same variables, to match the 2021 Census. As input data for weighting the 2022 survey have been improved, results presented here for the 2022 wave will differ somewhat from the figures originally reported for the 2022 survey.
Key Findings
Six major findings on the fertility desires and intentions among Canadian women and men are identified in the survey:
- Canadian fertility desires have changed little since the previous survey in 2022. Women had an ideal family size of 2.01 children in 2022 and 1.97 in 2025—a statistically insignificant change. Women’s intended family sizes were also quite stable, at 1.56 in 2022 and 1.54 in 2025. As our 2022 cycle did not survey men, we observe that an IPSOS Global Advisor Survey in 2022 suggested that men had fertility ideals of 2.11 children. Our 2025 survey found an average ideal family size of 2.13 children for men, but actual intended fertility at 1.70 children. Men desire slightly larger families than women in Canada, as demonstrated across the recent surveys.
- Canadians who achieve their fertility desires tend to be far happier than other Canadians, both in terms of their happiness specifically with their family life, and their overall life satisfaction. “Overshooting” the desired number of children has a larger negative impact on life satisfaction compared to “undershooting” fertility desires. However, “undershooting” desired fertility is far more common. As a result, there is similar or more lost life satisfaction in Canada due to having fewer children than having more children than desired.
- Across most ethnic or linguistic groups, Canadians generally desire to have around two children. Our survey found exceptions among Canadians of East Asian ancestry, who have appreciably lower desired family sizes, around 1.80 children, and Canadians of African or Middle Eastern ancestry, who tend to desire more children than average, at 2.76 children and 2.63 children respectively.
- There are large differences in family desires across Canada’s religious groups. Nonreligious Canadian women tend to desire 1.55 children while their male peers desire 1.83 children. Protestant Christian women desire 2.91 children, while their male counterparts desire 2.96 children. Adherents to other religious traditions report desiring 2.28 children for women and 2.23 children for men.
- In general, the factors contributing to Canadians’ fertility decisions have changed little since our 2022 survey. Life-timing issues and finances loom large. But some specific factors did see significant changes. Canadians reported more concern about childcare cost or access in 2025 than they did in 2022, which is surprising considering the federal government expanded public support for childcare. Canadians who voted for left-of-centre parties in the 2025 federal election were more likely to cite domestic politics as a factor in delaying fertility in 2025 as compared to 2022 despite a federal left-of-centre party winning re-election. This result may in part reflect the influence of political and policy uncertainty in North America at the time of the survey.
- Women and men report appreciably different obstacles to their family formation goals. Women reported more worries about the degree of support for parenting, childcare supports, and other care obligations, while men are much more likely to report worries about finances, employment conditions, or the state of the economy. When policymakers focus on “affordability” to the exclusion of robust, supportive communities built around parents, women’s particular concerns tend to be given short shrift.
Key Fertility Indicators for Canada
Statistics Canada reported a historic low total fertility rate of 1.25 children per woman in 2024. 4 4 Statistics Canada, "Fertility Indicators, Provinces and Territories." We estimate the 2025 total fertility rate will fall to 1.23 children per woman. This is down half a child per woman from 2008, when the fertility rate was 1.75 children per woman.
Our survey distinguishes between personal ideal or desired family size, intended fertility, and achieved fertility. In modern Western society, it is rare for women (and men) to intend to have children they do not desire. It is much more common to desire more children than intended, as intentions can be limited by perceptions of the challenges to have children due to various factors. Intended fertility is a compromise between desired fertility and reality. Directionally, intention is almost always lower than desired fertility.
In addition to asking respondents about their personal ideal family size and their intended fertility, we asked respondents about the general ideal number of children for a typical family, a question which captures not what respondents want for themselves, but rather what they see as socially normative: some respondents personally want more or fewer children than they see as being socially normal.
Figure 1 demonstrates how Canadian women’s actual achieved family sizes have changed over time compared to their ideal or intended family sizes. The figure uses Canadian birth rates by age to determine lifetime completed fertility for women aged 25 in the stated year. Lifetime completed fertility for 1992 to 2023 is estimated. The figures for 2024 and 2025 are derived from best estimates from provisional data for 2025, and assume future birth rates follow recent trends. As the figure shows, only a few surveys provide data on men’s fertility ideals and intentions.
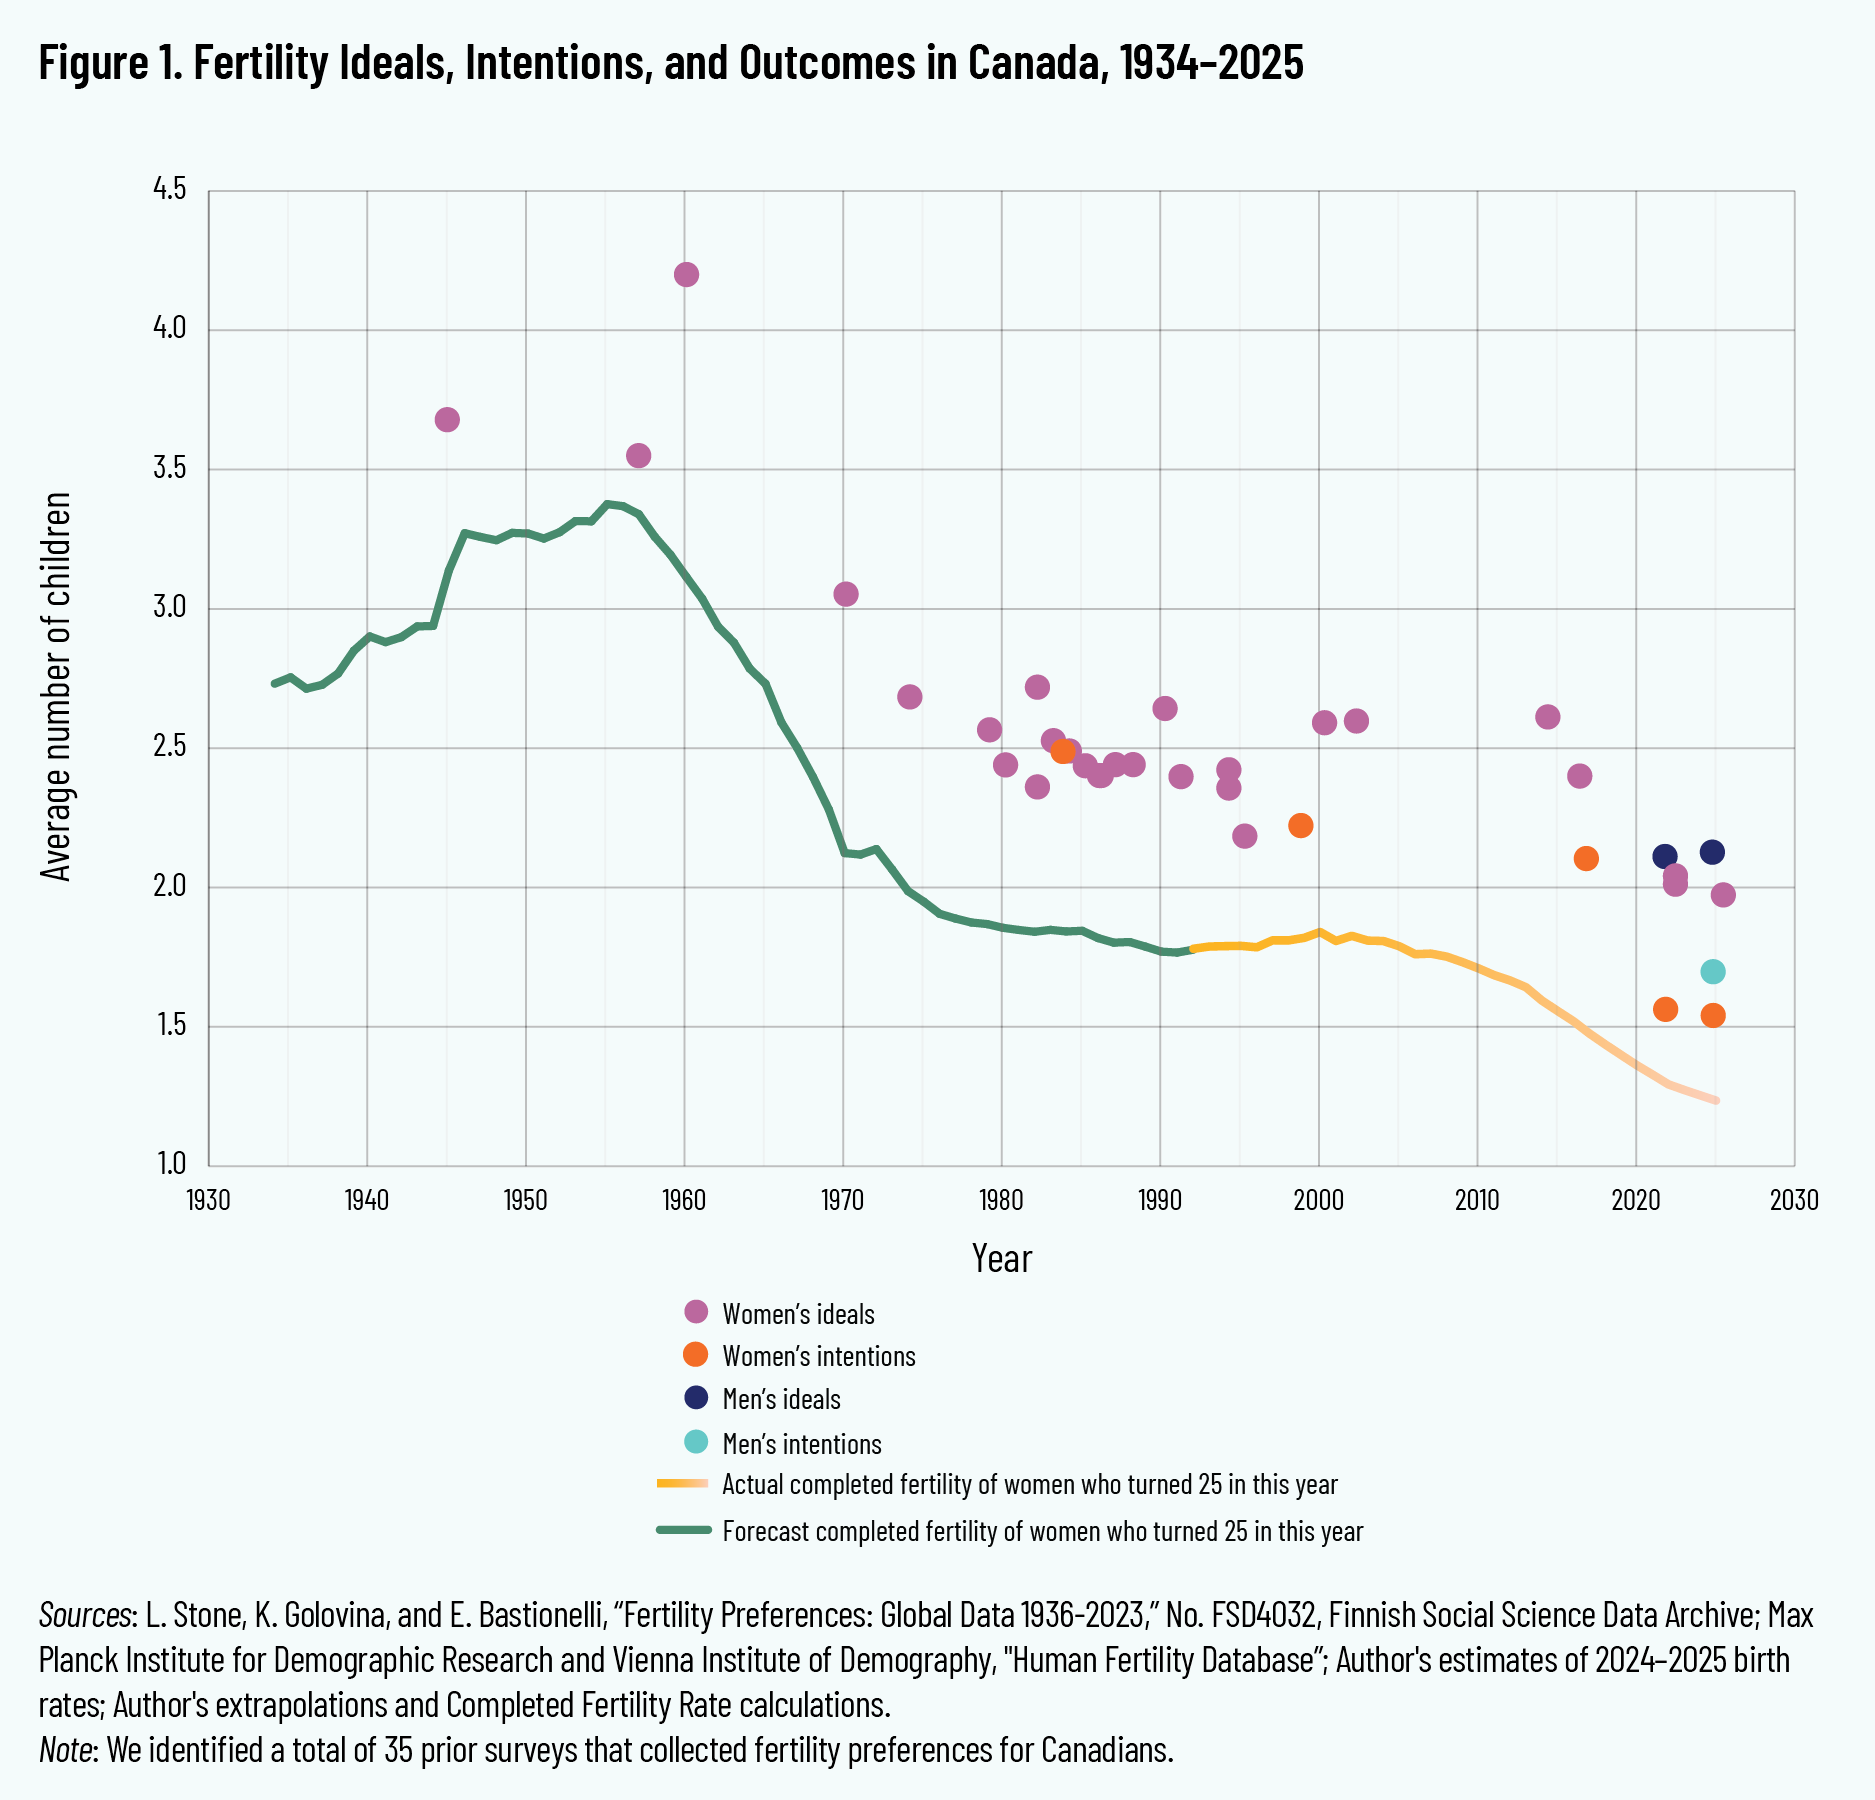
Prior to the 1960s, Canadian women had about three children on average. This was slightly below their stated personal desire of 3.55 to 4.20 children during this period. Both personal ideals and achieved fertility significantly declined in the 1960s and 1970s, before stabilizing between the 1980s and 2000s, with personal ideal family size around 2.50 children per woman and achieved fertility averaging around 1.80. In the latter 2000s through to the 2020s, estimated fertility fell sharply. We estimate that women who are age 25 in 2025 will have just 1.23 children on average over their lifetime.
Yet, our 2025 survey reveals that Canadian women desire 1.97 children, down slightly from 2.01 in our 2022 survey—a statistically insignificant change. Canadian women’s intended fertility was 1.54 children in 2025, compared to 1.56 in 2022.
The 2025 version includes Canadian men, who have slightly higher ideals and intended fertility compared to women. Men reported an ideal family size of 2.13 children, but an intended fertility of 1.70 children.
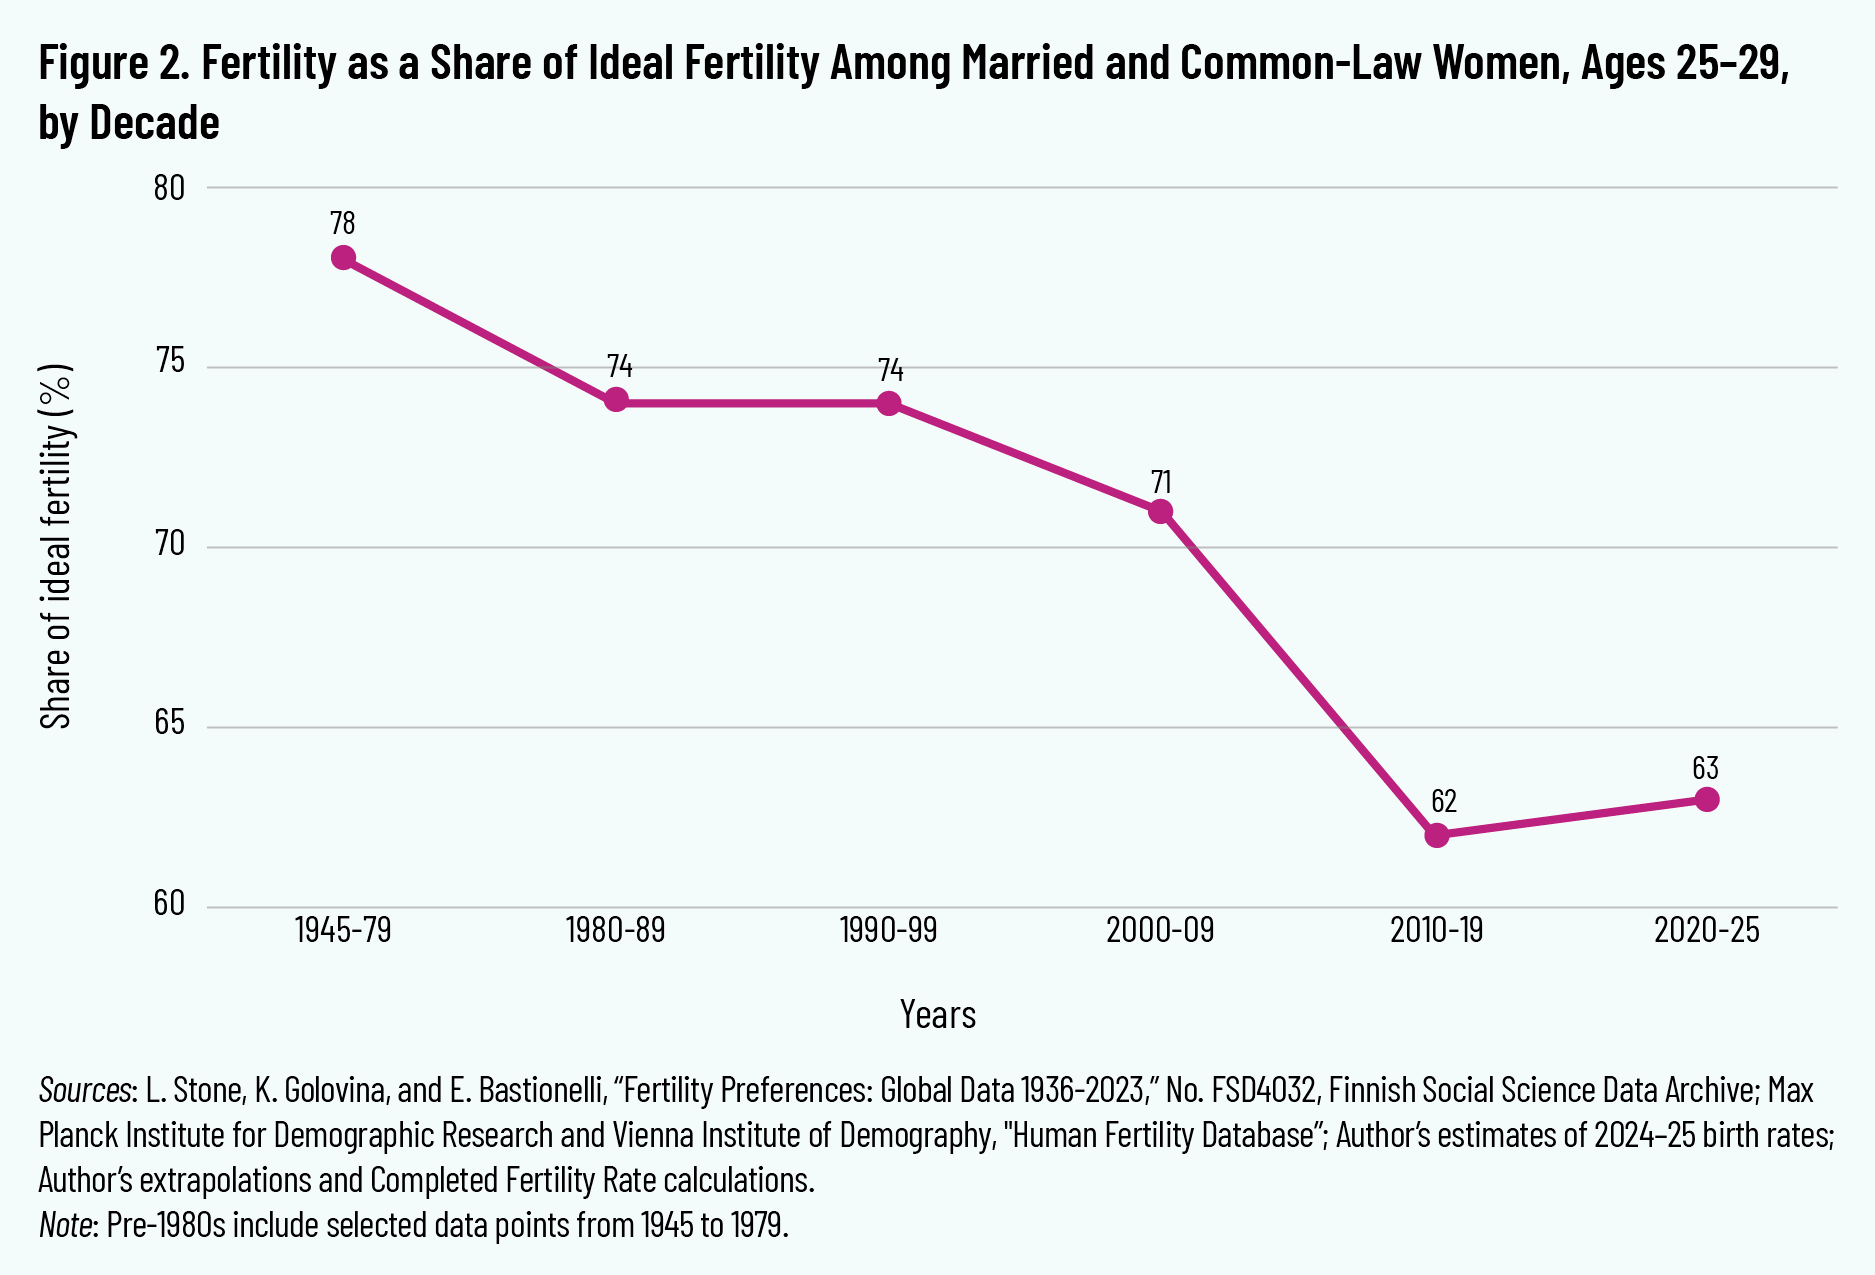
There has been a major decline in personal fertility ideals between the mid-2010s, when ideal family sizes were around 2.50 children per family, and today, but the gap between what Canadian women report desiring and what they will likely have continues to grow. Before the 1980s, Canadian women, on average, reached 78 percent of their ideal family size. In the 1980s and 1990s, they achieved 74 percent of their ideal, and 71 percent of their ideal in the 2000s. By the 2010s, women achieved 62 percent of their ideal fertility, and an estimated 63 percent of their ideal fertility in the 2020s. The relative stability from 2010 onward is due entirely to plummeting aspirations instead of rising completed fertility.
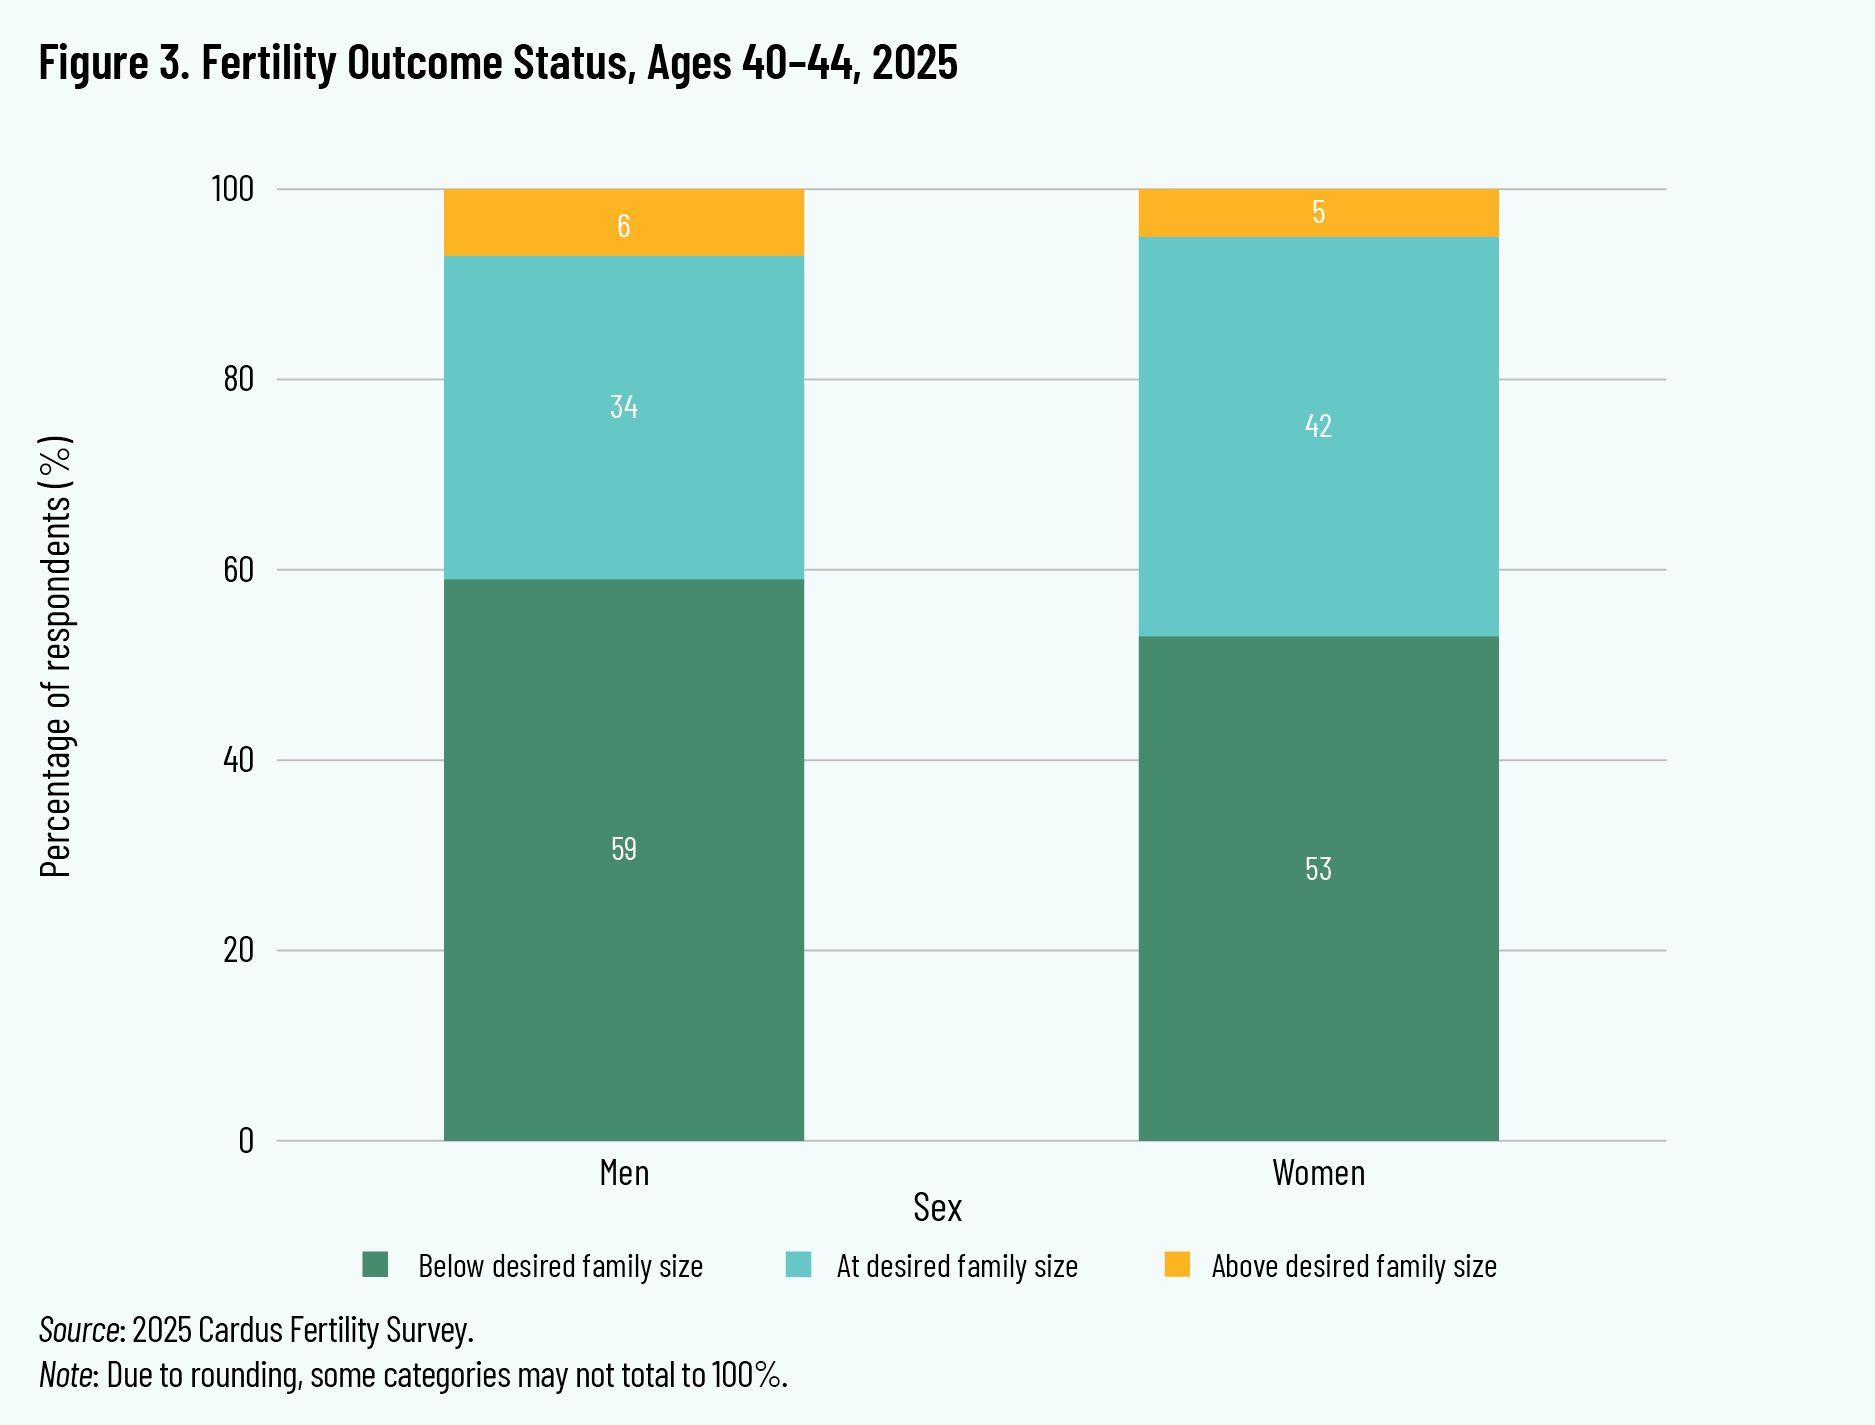
The scale of the gap between ideal and achieved fertility is clearer when observing women and men near the end of their typically considered reproductive years. As shown in figure 3, over half of Canadian women and men aged 40 to 44 report having fewer children than they wanted to have. Only about 5 percent of Canadians aged 40 to 44 have more children than they wanted to have. While fertility regrets certainly occur, it is vastly more common for Canadians to end their reproductive years with fewer children than desired.
Fertility Indicators by Geographic Region
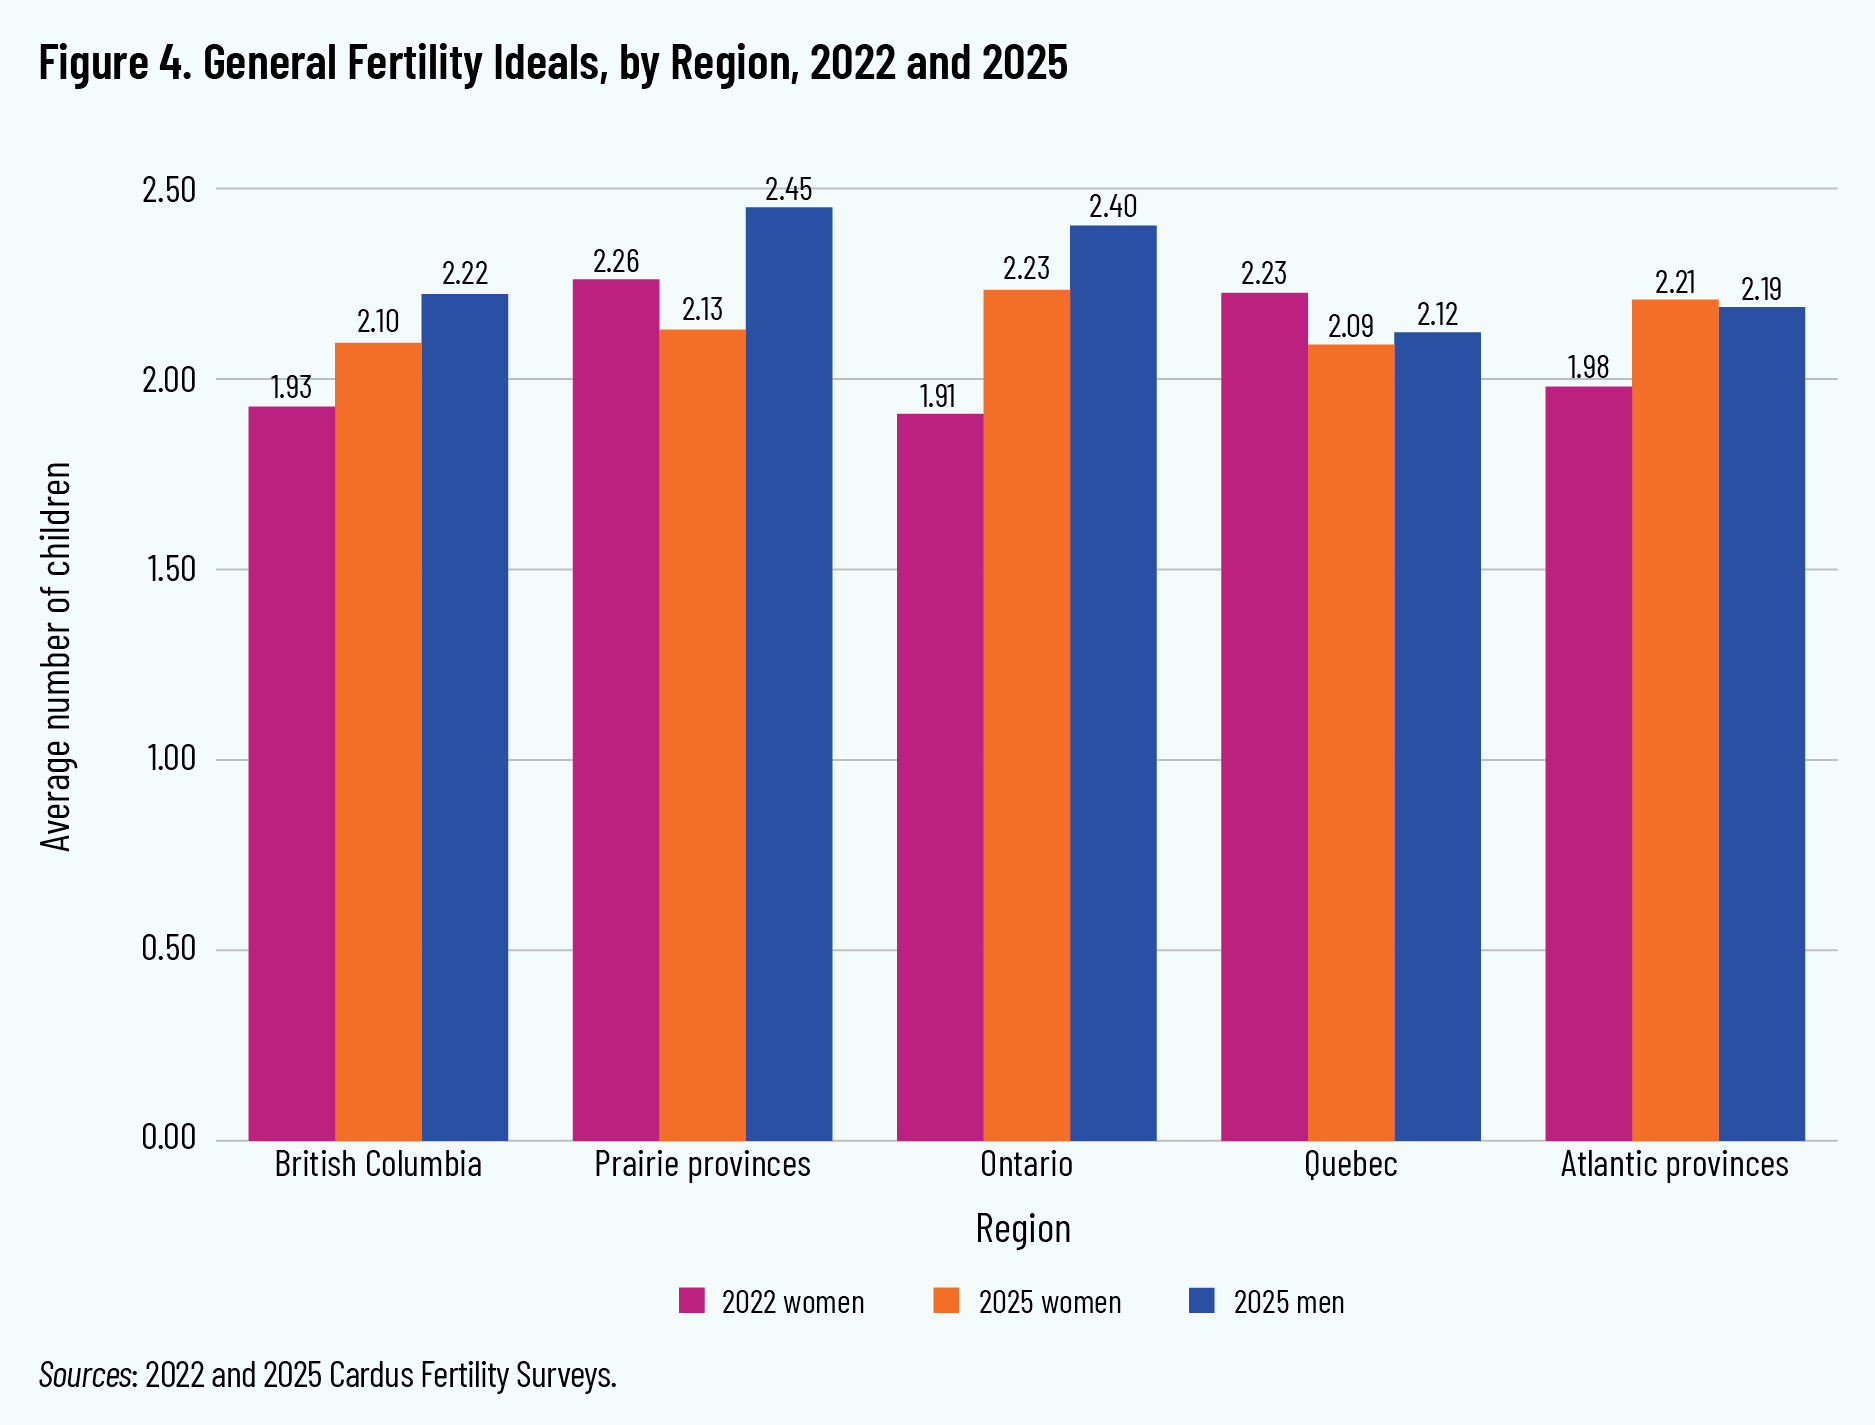
As would be expected for a large, diverse country such as Canada, there is notable variation in fertility ideals across regions. Figure 4 shows the average number of children that Canadians believe are generally ideal “for a family to have,” regardless of their own personal ideals, by geographic region.
In 2025, Canadian women and men across all regions said that the ideal number of children for a typical family is two or more children. This represented an increase among women compared to 2022 in Ontario, British Columbia, and Atlantic Canada, and a decrease in Quebec and the Prairie provinces. The region with the highest general ideal among women was Ontario, whereas the region with the highest general ideal for men was the Prairie provinces. Conversely, the region with the lowest general ideal among both women and men was Quebec.
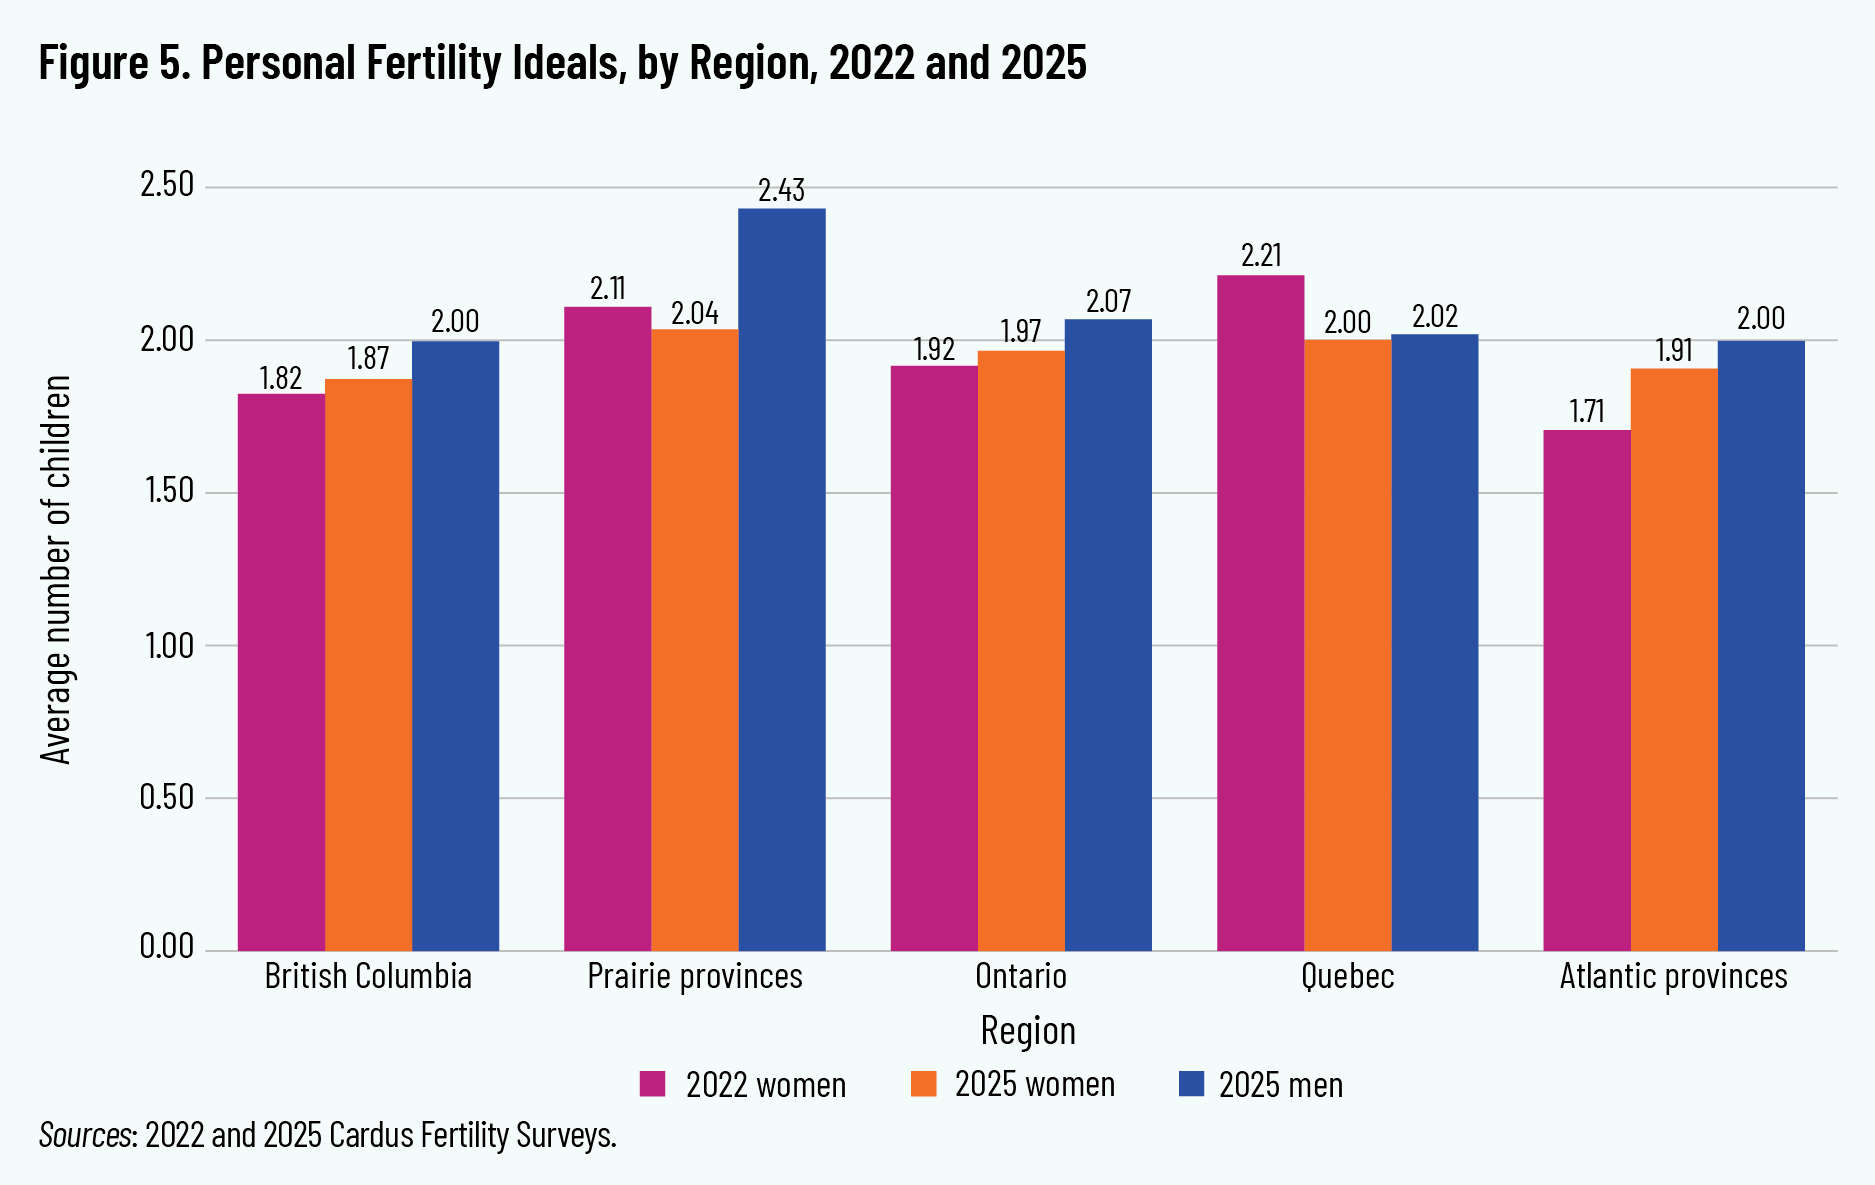
We then asked respondents about the number of children that would be ideal for them personally, as shown in figure 5. Atlantic Canada had the lowest average personal fertility ideal among women in 2022 and the second lowest in 2025, just exceeding that of British Columbia in 2025. The increase in measured personal ideals for Atlantic Canada outpaced the growth in personal ideals in British Columbia, but this is likely owing to normal survey volatility and the relatively small number of respondents from those provinces. A small increase in personal ideal fertility among women is observed in Ontario. The Prairie provinces had the highest personal ideals for both women and men in 2025. Women in the Prairie provinces were the only women to report personal ideals over two children per woman, yet women and men in the Prairie provinces also had the largest gap in personal ideal fertility.
Meanwhile, the high personal fertility preferences we found in Quebec in 2022 declined appreciably in 2025. In general, we found that men had appreciably higher personal fertility ideals compared to women in every region but Quebec.
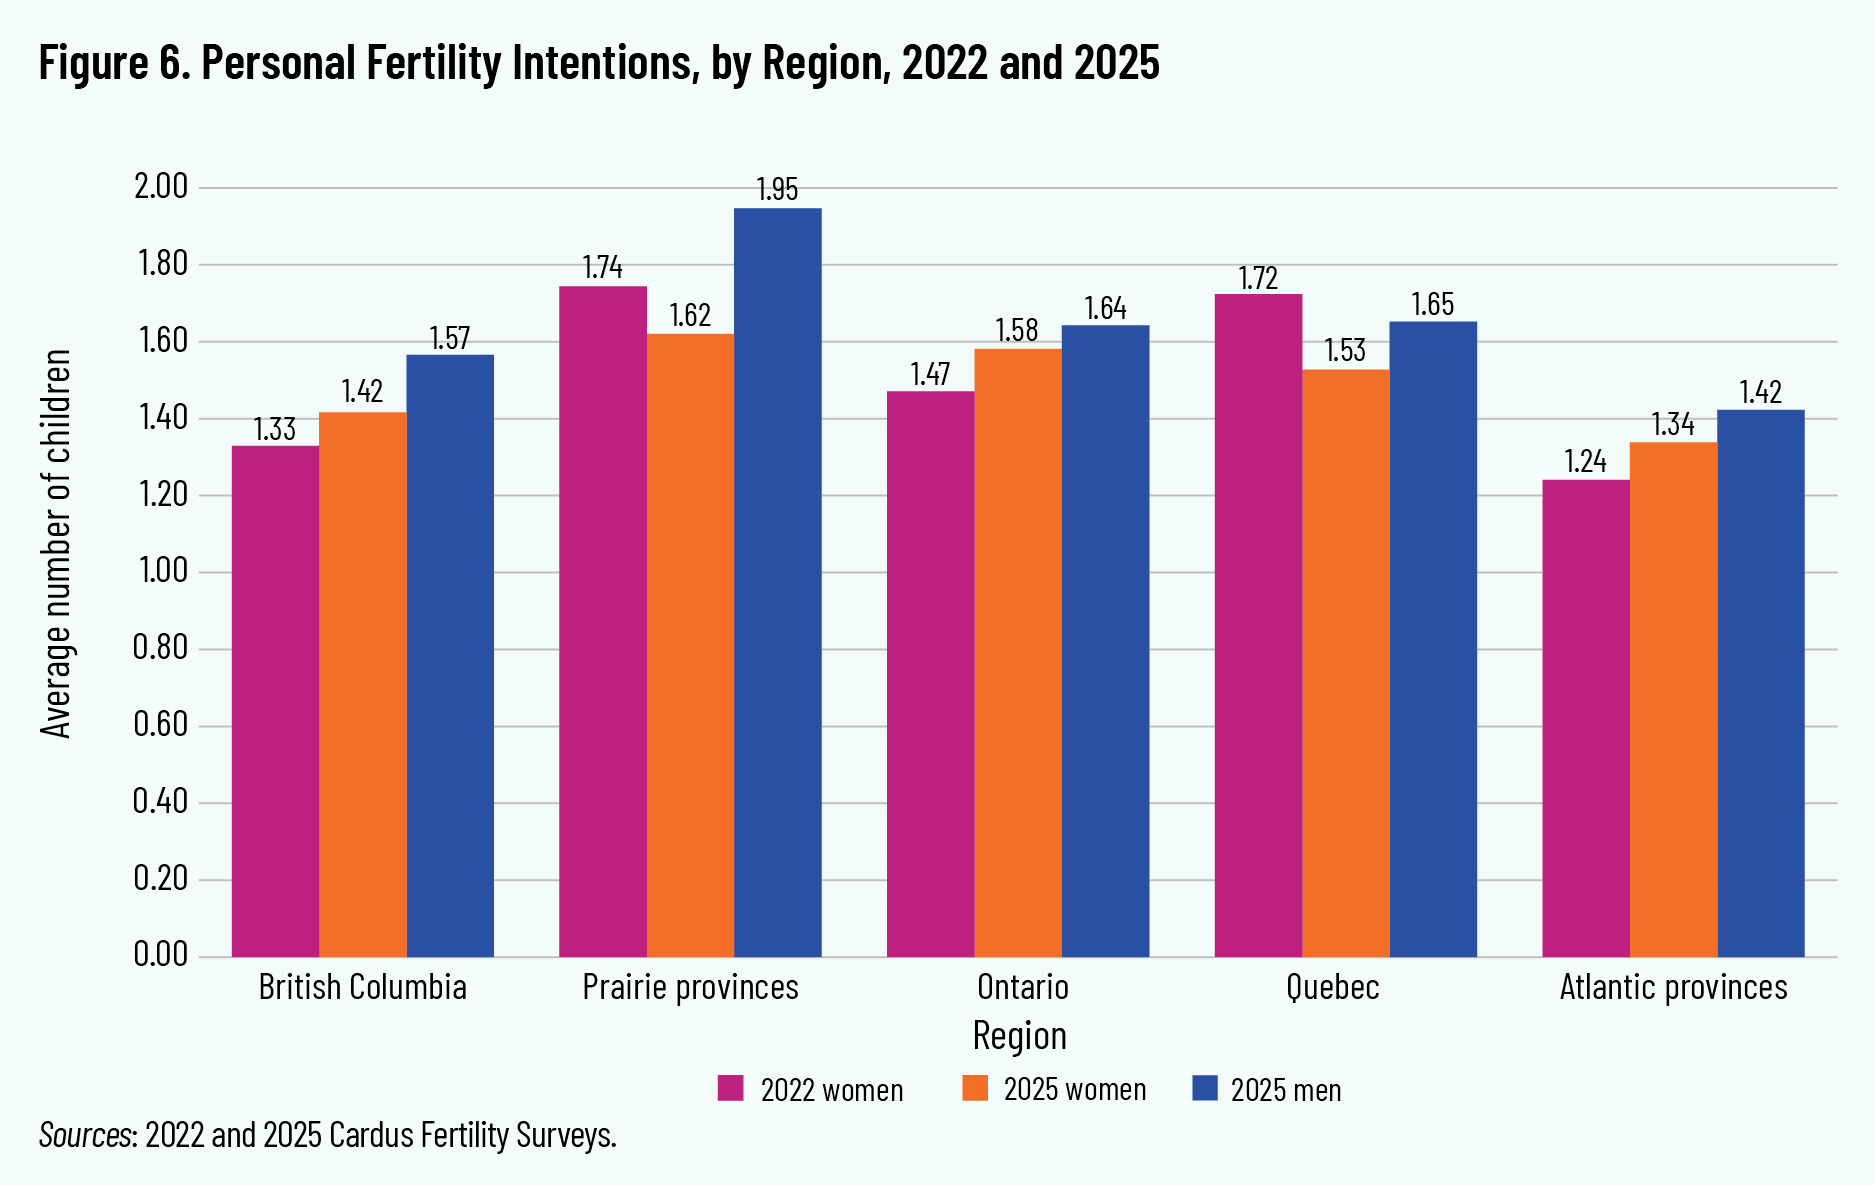
Finally, turning to the average number of children that respondents said they intended to have, patterns were again similar, though at a lower absolute level. As shown in figure 6, the average intended number of children was highest in the Prairie provinces and lowest in British Columbia and Atlantic Canada. Compared to 2022, women’s intended number of children declined in Quebec and the Prairie provinces, but increased in British Columbia, Ontario, and Atlantic Canada. Men had higher fertility intentions compared to women in all regions, with most regions reporting appreciable male-female gaps.
Fertility Indicators by Ethno-Linguistic Group
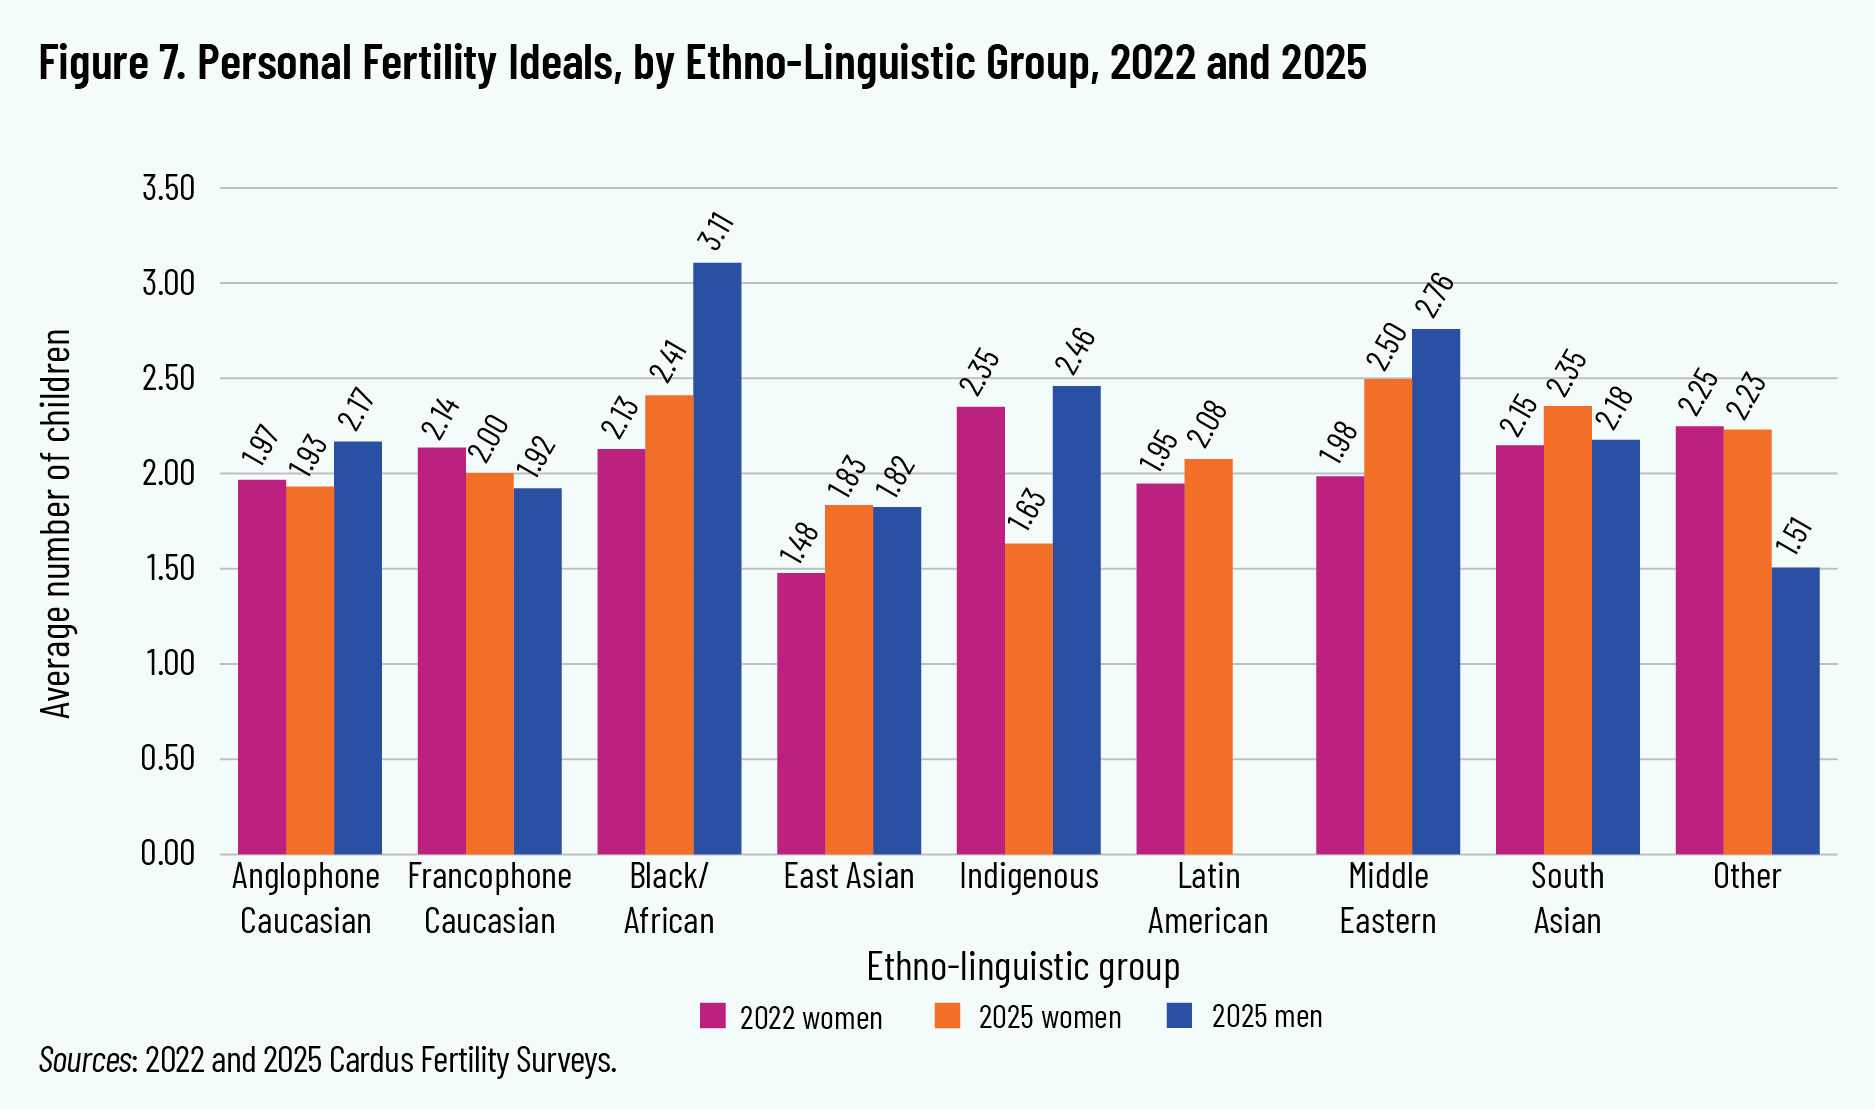
Fertility preferences differ across diverse ethnic, linguistic, and cultural groups in Canada. For this study, we grouped respondents based on ethnicity and language into nine categories: two language groups of Caucasians (Anglophone, Francophone), and then seven major groupings of non-Caucasian women and men. Figure 7 shows the personal fertility ideals for each group. Estimates for men of Latin American ancestry are not shown, due to small sample sizes yielding very imprecise estimates.
Patterns for women in 2025 are similar to those observed in 2022, with a few exceptions. Women of East Asian ancestry continue to have relatively low personal ideal family size, at 1.83 children per woman, one of the lowest numbers in the sample. Meanwhile, Canadians of African, Middle Eastern, or South Asian ancestry have relatively high personal fertility ideals, all appreciably over two in 2025. The average ideal family size in 2025 for Caucasian Canadians is 2.05 children, and is slightly higher than the average Francophone ideal family size at 1.96 children.
A few notable variations are evident. There was a sharp decline in personal ideal fertility for self-identified Indigenous women. This could be due to normal sampling error (sample sizes for these women are small in both years), or could reflect a downward turn in Indigenous women’s fertility outlooks consistent with recent research showing declining fertility among Indigenous women. 5 5 Teng et al., “Trends in Indigenous Fertility.” Meanwhile, it seems clear that men desire larger family sizes than women among Indigenous and African-ancestry Canadians. This is true to a lesser extent for Middle Eastern-ancestry Canadians. Overall, the rising number of African, Middle Eastern, or South Asian immigrants likely nudges Canadian fertility ideals upwards, while the growing East Asian population may nudge Canadian fertility ideals downwards.
Fertility Indicators by Educational Background
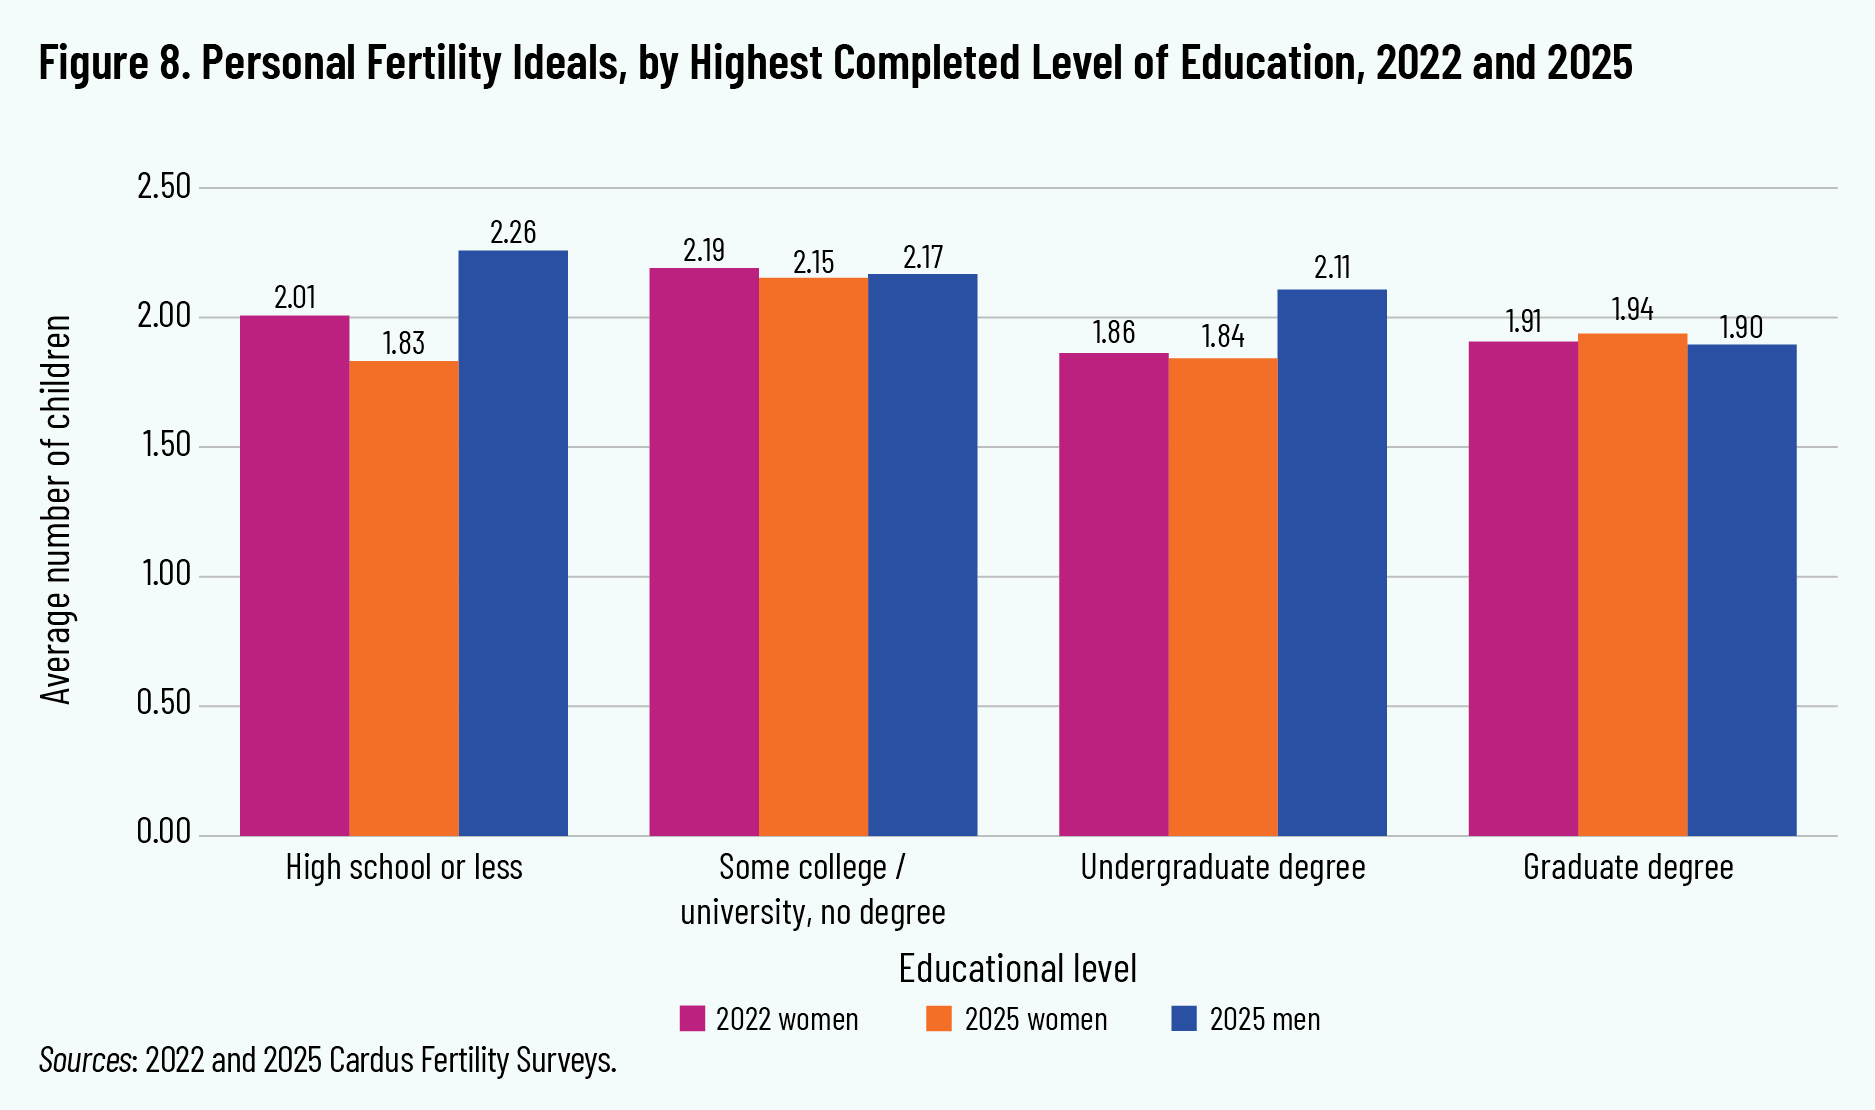
As shown in figure 8, personal fertility ideals appear to Interestingly, women with a graduate degree desired more children than women whose highest level of education was a high school diploma or undergraduate degree. Personal fertility ideals appear to decline with educational attainment among men, whereas for women there is no clear pattern. Canadians with graduate degrees as their highest completed education are the only group for which men have lower ideals than women in 2025.
Fertility Indicators by Religion and Political Affiliation
Canadians have significant differences in fertility ideals when observing results by religious affiliation, as we noted in “Religion and Fertility in Canada,” which was based on the 2022 survey. 6 6 Stone, “Religion and Fertility in Canada.” Our 2025 survey reaffirms that finding.
As figure 9 shows, the 2025 data reveal that Canadian Protestant women and men share broad agreement on a three-child ideal, while Catholic, Orthodox, and Canadians of other faiths have fertility ideals just over two children. Respondents identifying as “spiritual” have personal ideals nearer 1.65 children for women and 1.76 children for men. There is an appreciable gender gap among non-religious Canadians, with men desiring more children than women. The growth in Canada’s non-religious population may contribute to a decline in ideal family size.
And finally, building on our prior work from the 2022 survey, we find that there remain considerable differences in fertility ideals by political affiliation, although they are attenuated somewhat since 2022. As seen in figure 10, Canadians who voted for right-leaning parties had higher fertility ideals than those who voted for left-leaning parties and the Bloc.
Fertility Indicators by Income
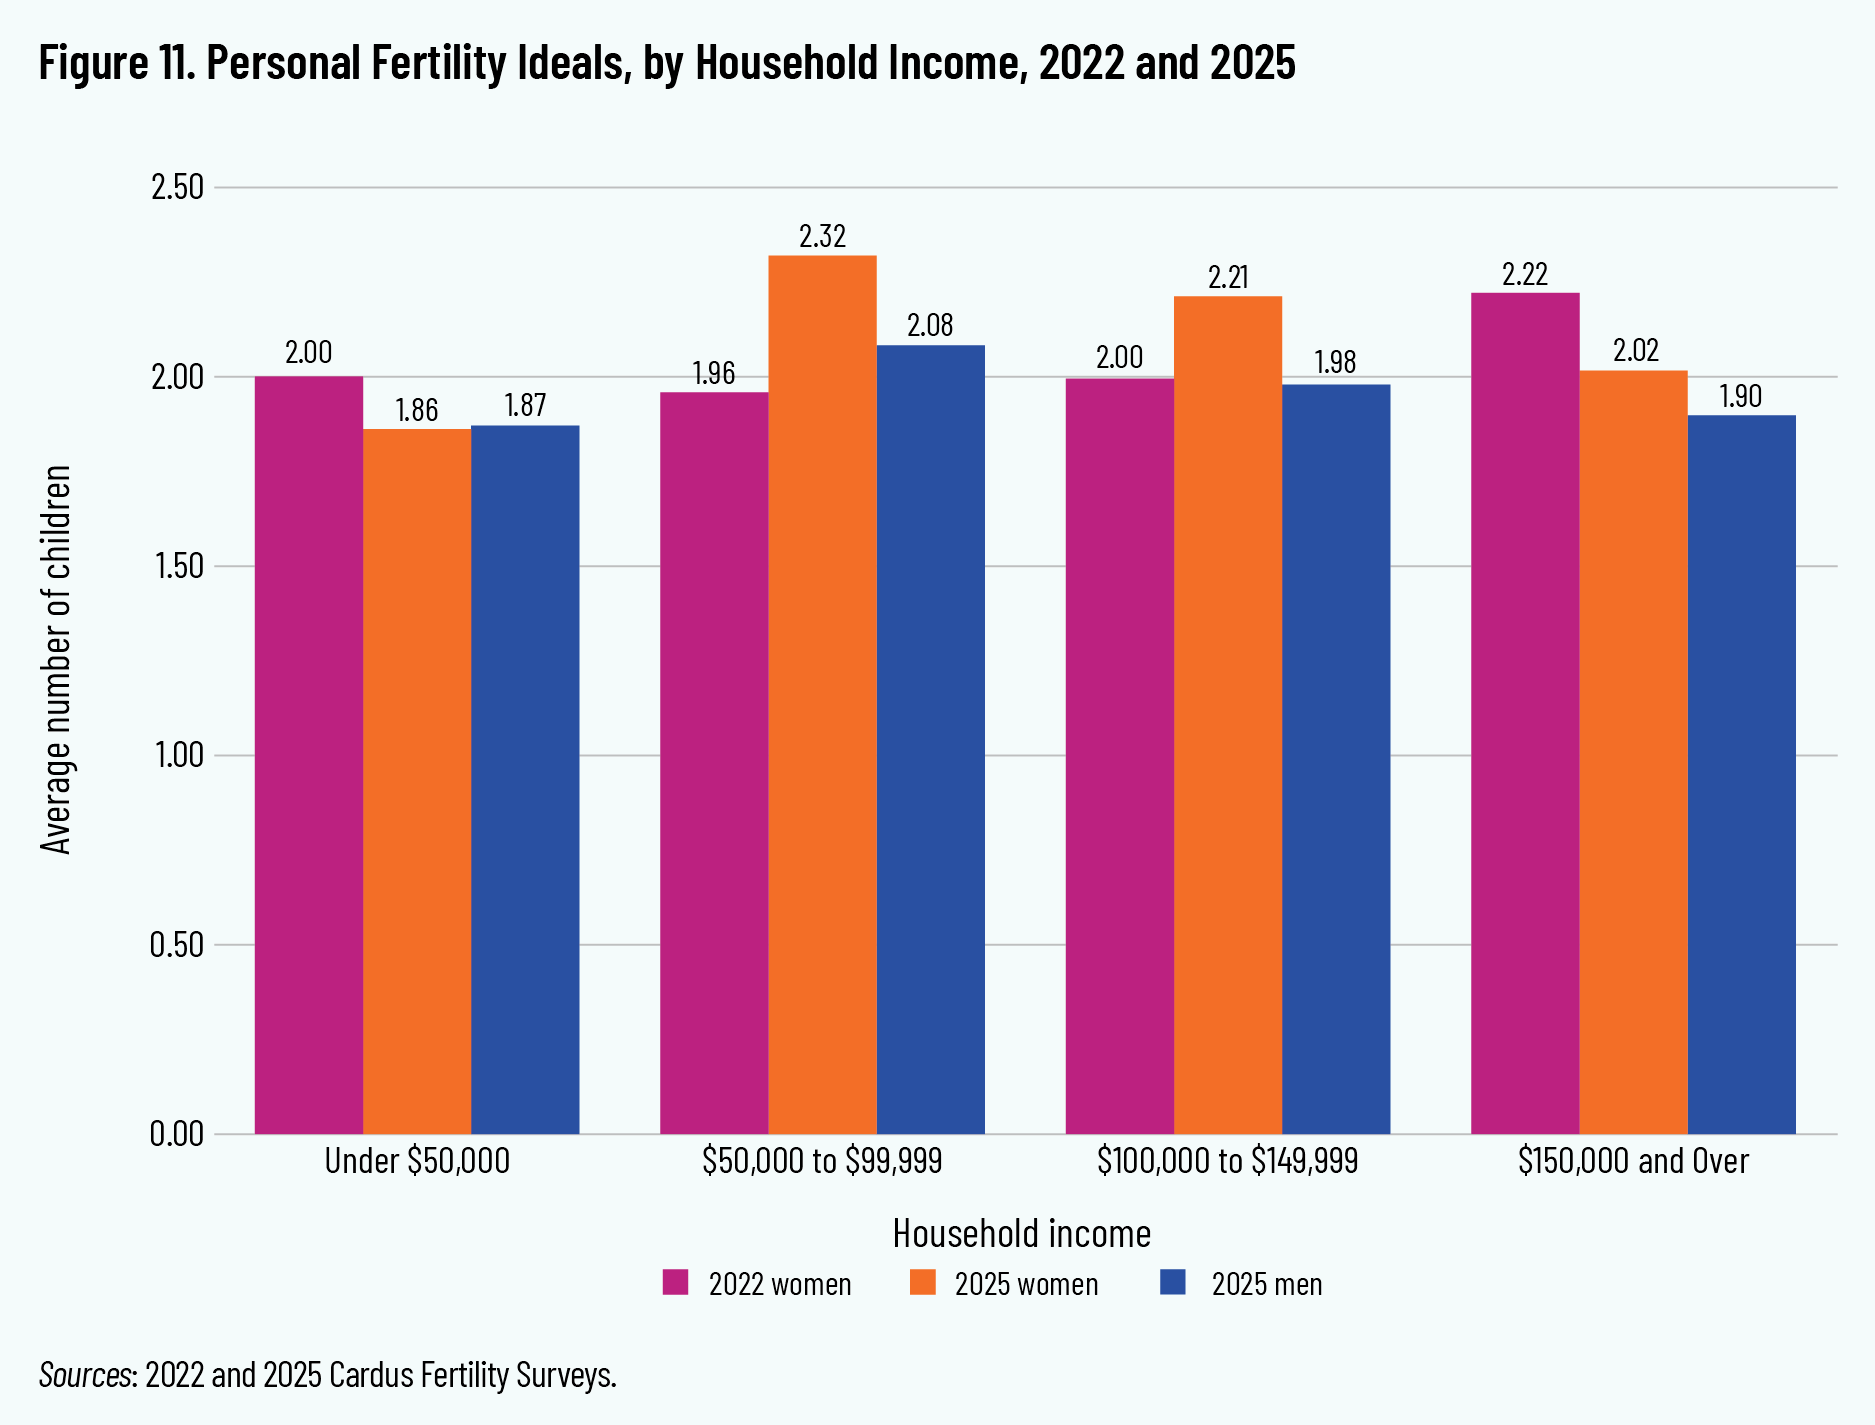
Figure 11 shows how desired family size varied across income levels. In 2022, we found that desired family size was highest for the highest-earning women. But in 2025, this appeared to no longer be the case.
While women and men with household incomes under $50,000 did have the smallest desired family size, at 1.86 and 1.87 children respectively, high-earning men were not much higher. Ideal family size was highest for Canadians with $50,000 to $99,999 in household income, and then for those with $100,000 to $149,999. It is not entirely clear what caused this appreciable shift in desired family size by income between 2022 and 2025, though it does remain the case that low-income Canadians have appreciably lower fertility ideals than others.
Fertility and Family Life Satisfaction and General Life Satisfaction
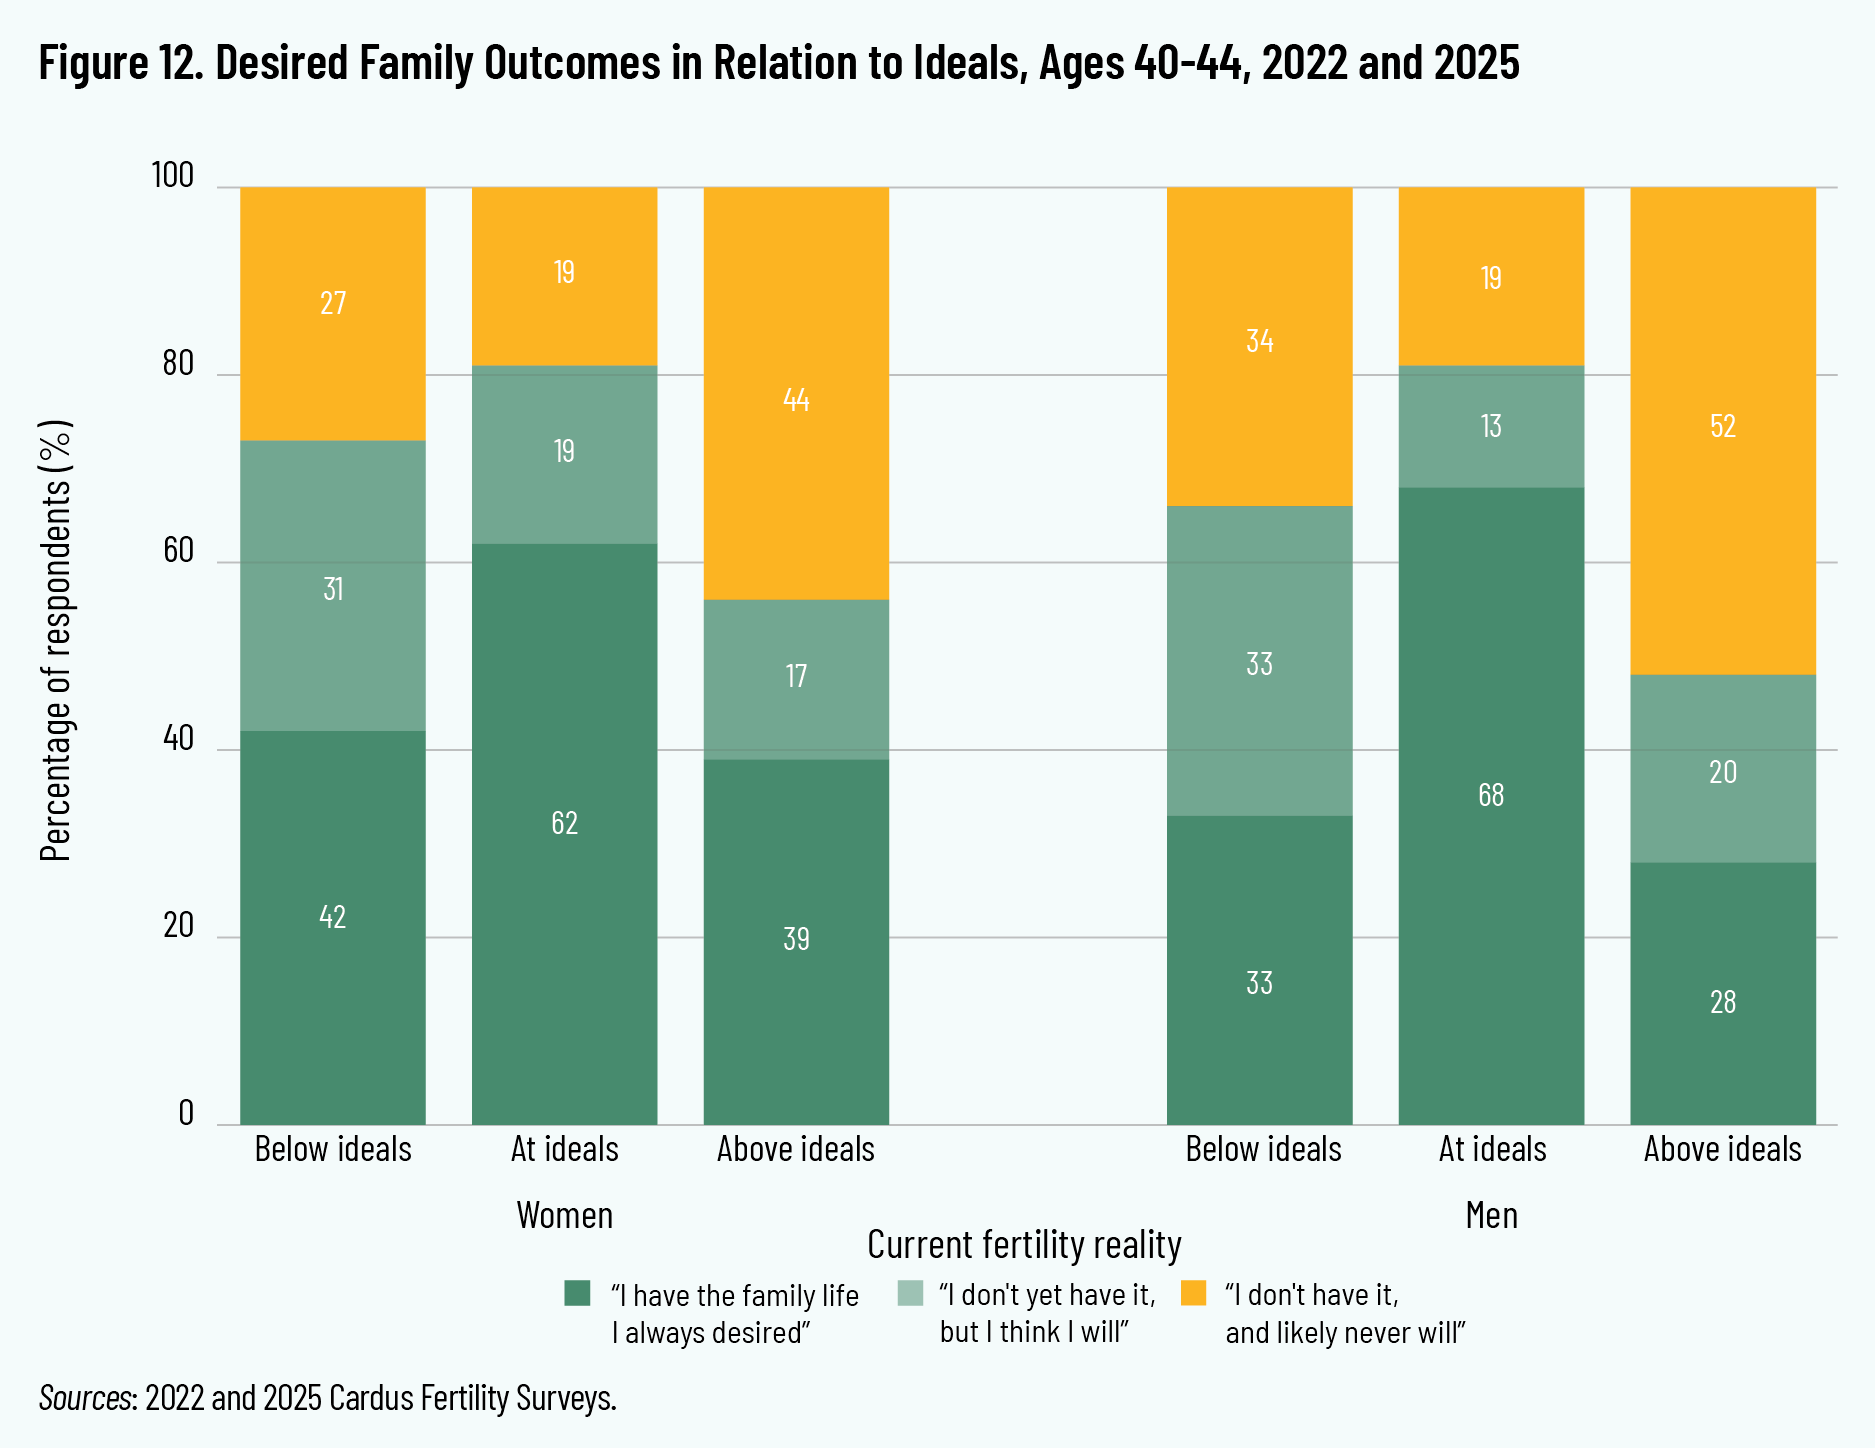
Figure 12 shows the level of family life satisfaction of women and men aged 40 to 44 by fulfillment of fertility intentions.
The results are clear. When asked, “Overall, would you say that you have achieved the family life you hoped to have in life?”, about 60 percent of women and 70 percent of men who are at their fertility ideals said “Yes, I have the family life I always wanted to have.” On the other hand, a minority of women and men who reported having either fewer or more than the desired number of children reported having the family life they always desired. Likewise, the share of women and men who met their ideals but say they will never have the family life they desired is 19 percent. Among men who are below their ideals, 34 percent report they are unlikely to have the family life they desire, and 27 percent of women below their ideals report they are unlikely to have the family life they desire. Women and men who report having more children than they desired were the most likely to report that they were unlikely to have the family life they desired. These data suggest that ideal family size is an important aspect of Canadians’ sense of what constitutes “having the family life they always desired.”
Survey respondents were asked about general life satisfaction, separate from family-specific outcomes. As in the 2022 study, we worded the question on life satisfaction based on a well-tested survey instrument. 7 7 Cheung and Lucas, “Assessing the Validity of Single-Item Life Satisfaction Measures”; Fergusson et al., “Life Satisfaction and Mental Health Problems”; M. Luhmann et al., “The Prospective Effect of Life Satisfaction on Life Events”; Chei et al., “Happy Older People Live Longer.” Canadians in their 40s who achieved their ideal family size averaged 6.2 out of 10 on a life satisfaction scale, while those who were under their ideal averaged 5.8. Respondents who overshot their ideal averaged 5.0 out of 10 on the life satisfaction scale. Nonetheless, because overshooting ideal family size is rare, we estimate that Canadian men in the aggregate lost five times as much life satisfaction from undershooting their ideal as lost from overshooting their ideal. We estimate that women lost 2.3 times more life satisfaction due to undershooting their ideal compared to overshooting it.
The evidence having one’s desired family life is similar. The number of Canadians who don’t have the family life they desire and are below their ideals is about four times those who don’t have the family life they desire and are above their ideals. While these estimates should be applied with caution, as causality could run in various directions, the evidence suggests that undershooting fertility ideals should be an important social concern, much as unwanted pregnancy is often considered a significant social problem.
As we argued in our previous report, it remains the case that intended fertility is key to understanding fertility outcomes. 8 8 Stone, “She’s (Not) Having a Baby.” Failure to achieve those desires is strongly associated with lower life satisfaction. As far as we can estimate from the cross-sectional data, by far the larger source of society-wide lost life satisfaction comes from underachieving fertility ideals rather than from exceeding them.
Factors Influencing Family Plans
The 2022 and 2025 surveys inquired about specific factors that may have influenced respondents’ family decision-making. Respondents were offered a structured list of thirty-four possible items, and could also volunteer their own responses. All respondents faced an initial question about broad factors influencing family plans, with options related to finances, work-life balance, stage of life, and general social worries. Any option that a respondent selected provided a more detailed set of options. For example, respondents who indicated financial concerns were then asked about specific concerns such as housing costs or childcare costs. Respondents who indicated time-availability issues were shown more detailed options such as maternity-leave availability and childcare access. All respondents were permitted to write in responses for concerns not represented in the provided options. Write-in responses were coded into the appropriate categories. Most respondents who did not select any issue or concern were older and had already completed or nearly completed their childbearing. As a result, we focus our analysis on the concerns of respondents under age 35 who had an ideal family size larger than their current family size.
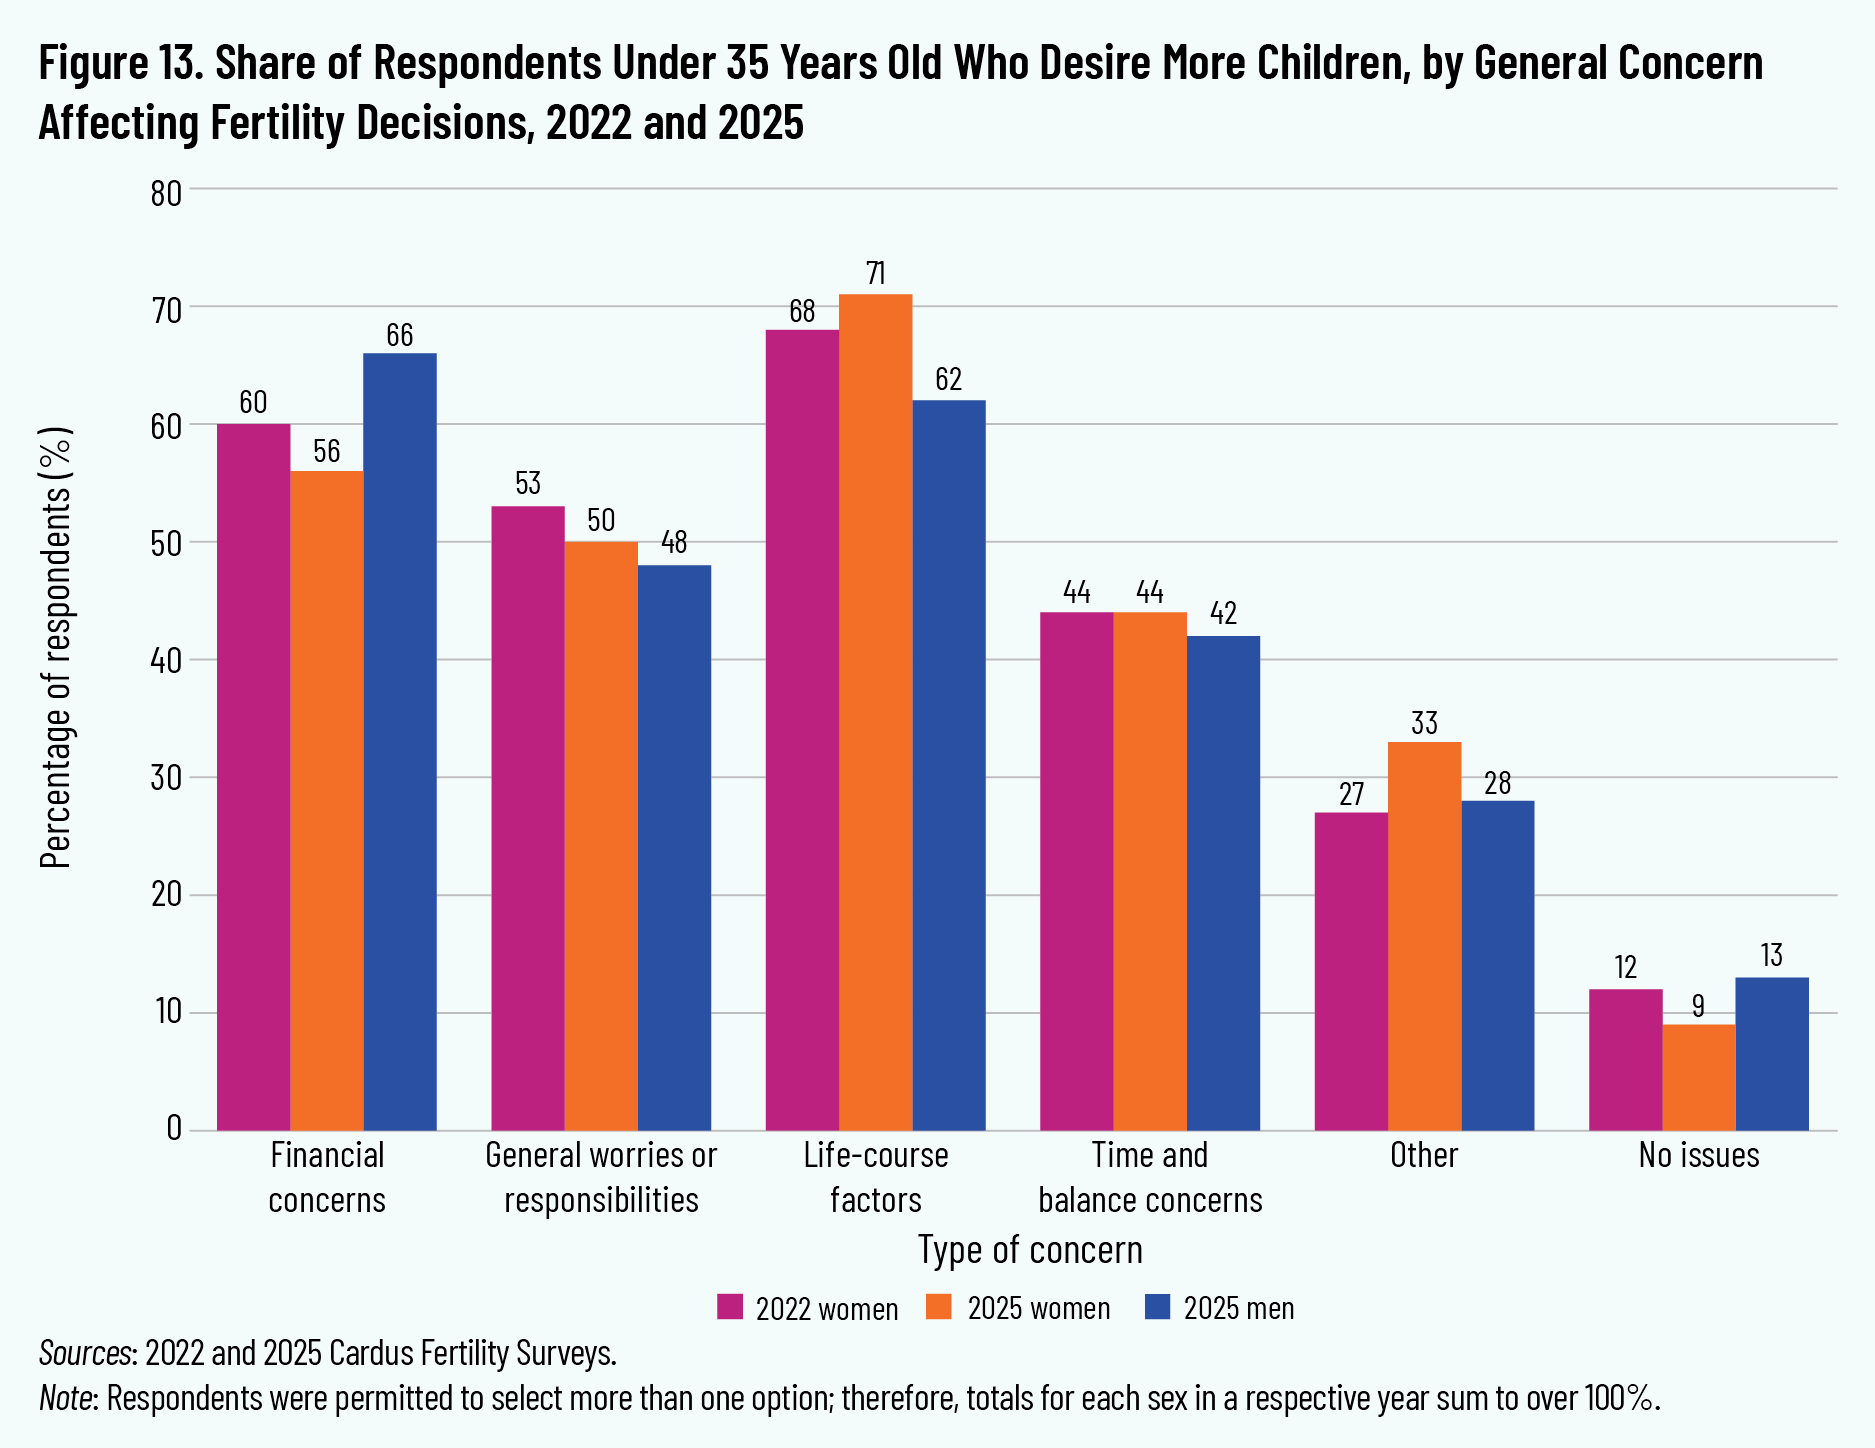
As figure 13 shows, there was broad stability between survey years when considering the overarching factors that Canadians reported.
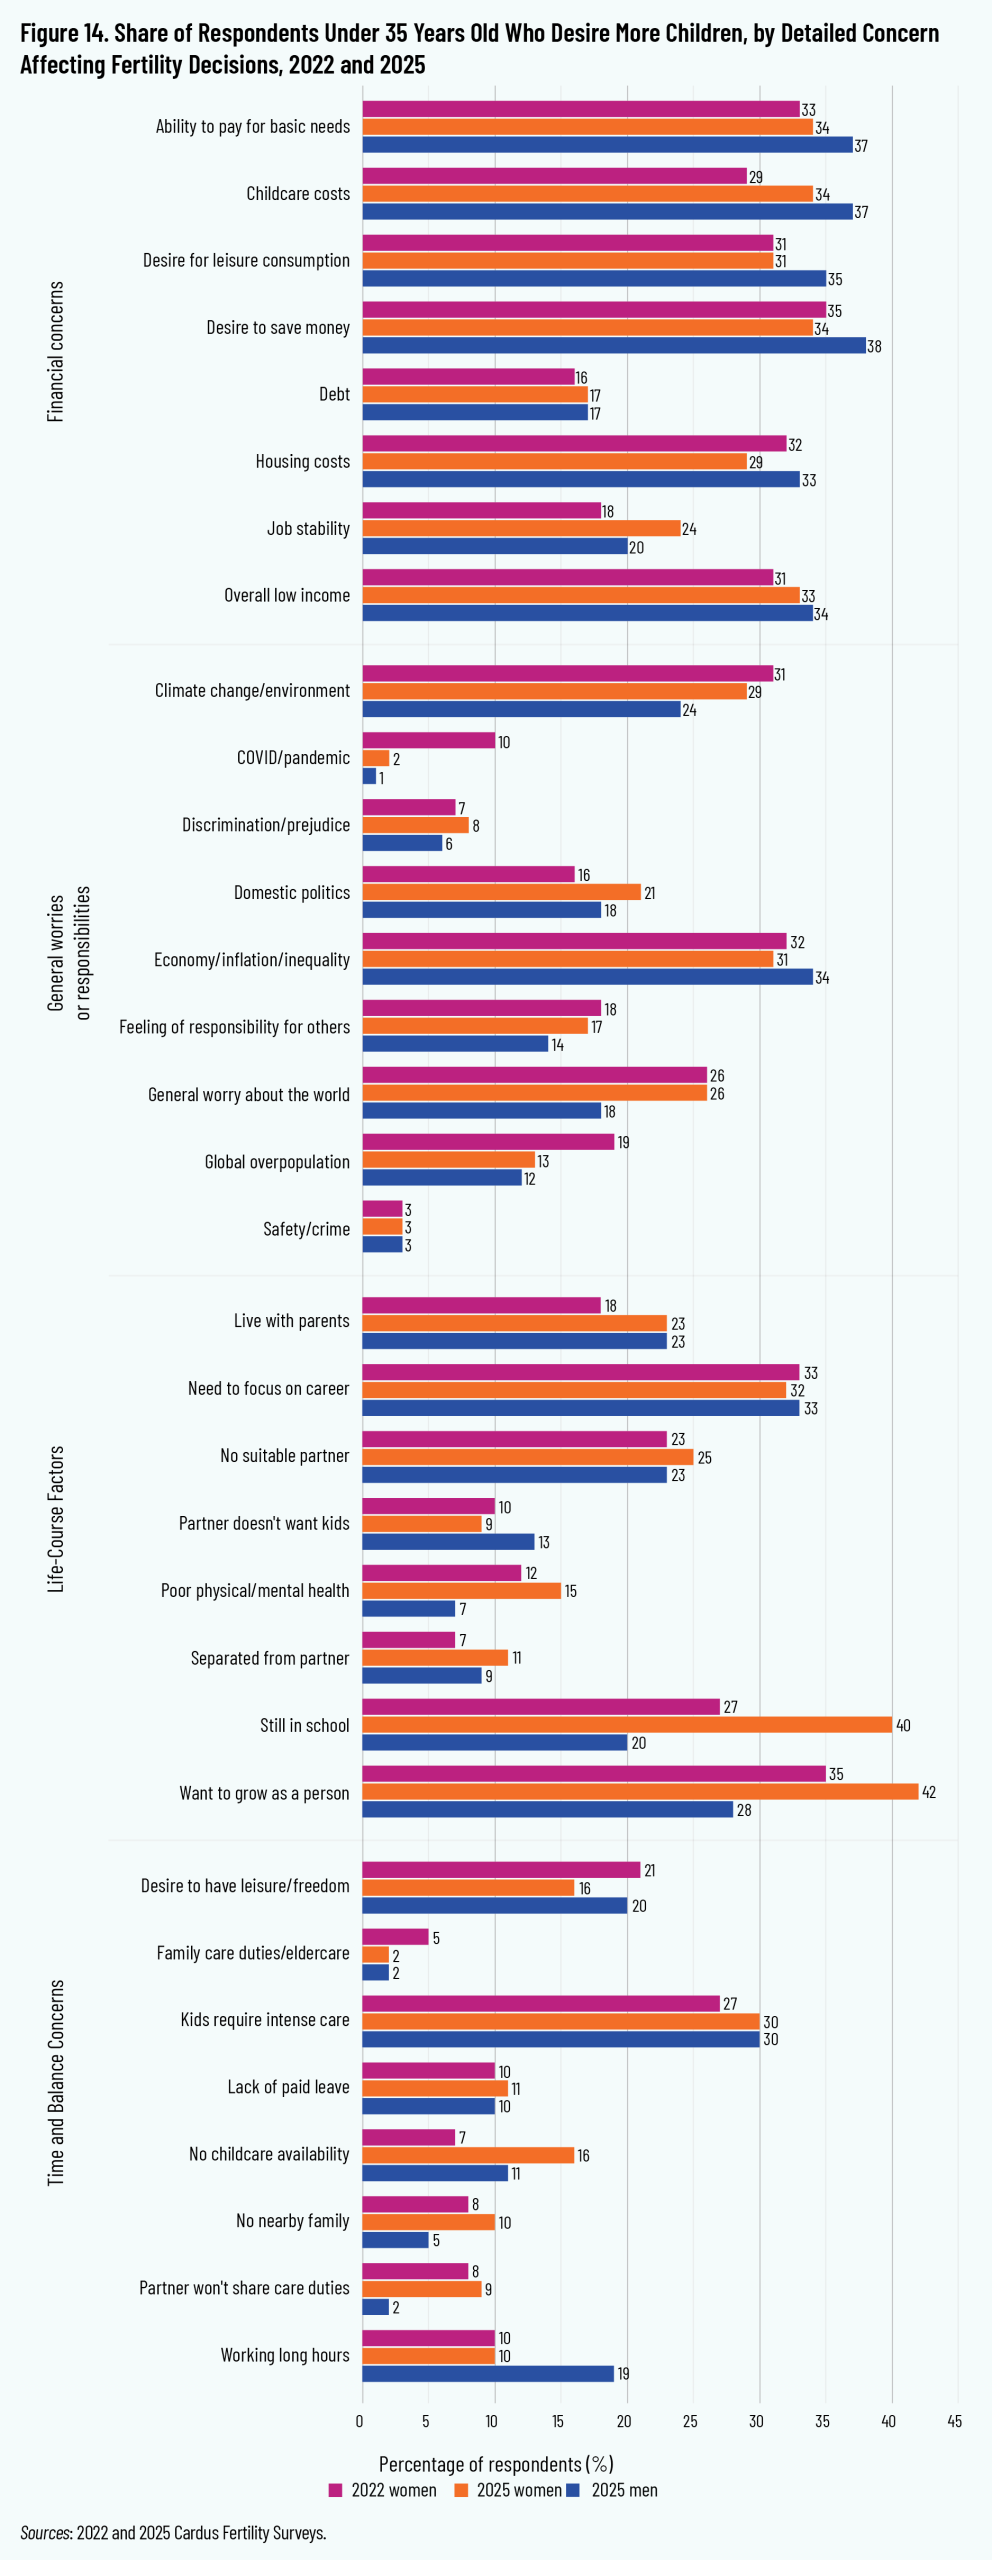
For women, life course concerns, such as lack of a partner, living with a parent, or being in school, predominated in both survey years, and rose somewhat between 2022 and 2025. Other concerns remained mostly stable, though financial concerns declined. More than half of Canadian women under age 35 who would ideally like a bigger family report some kind of financial obstacle to achieving that goal. Notably, men are less likely to report every category of concern besides financial concerns, where men have far more concerns than women do. As figure 14 shows, this finding is not spurious: men are uniquely likely to see financial concerns as the chief obstacle to having more children.
Looking at more detailed response categories, there are several cases where women’s concerns changed significantly between our 2022 and 2025 survey waves. We also found some important differences among women and men in the 2025 survey.
Among women under age 35 who in an ideal world would like to have more children, the biggest increases in financial concerns were in the share reporting that high childcare costs influenced their choices and in the share reporting that low job stability was a factor. When it comes to differences between women and men, the biggest differences were observed around concerns about housing costs, savings, and consumption for leisure, though in general men had somewhat more financial worries than women.
On time and balance concerns, there was a large increase in the number of women who reported a lack of childcare availability, as well as the share who said that children require intense care. Between 2022 and 2025, it appears that women’s perceptions of the burdens of caring for children rose. We observed increases in perceived childcare costs and access, and the share who reported concerns about the intensity of care children require. Despite the introduction and expansion of $10-a-day childcare, perceptions of the cost of and access to childcare have not improved and in fact have worsened considerably as a factor in fertility decisions. Meanwhile, the share who reported a desire to protect leisure time declined.
In terms of differences between women and men in the 2025 survey, men were less likely to report concerns about childcare access and less likely to report a partner who wouldn’t help at home, and more likely to report long working hours and desire for personal leisure and freedom. Whereas women are disproportionately worried about how the kids will be cared for, men seem confident that their partners will be involved in care, and instead are disproportionately worried about other demands on time, such as work and leisure.
Among the general concerns with society we surveyed, the only appreciable increase was in worries about domestic politics. In 2022, 16 percent of women cited domestic politics as a concern influencing their fertility decisions; in 2025, this concern increased to 21 percent among women. This may be due to the shadow that U.S. domestic politics cast across Canadian politics at the time of the survey. Many other general concerns declined: COVID certainly fell sharply as a concern, as did worries about global overpopulation. In general, men had lower prevalence for most worries, especially nonspecific generalized worries about the world, though men were a bit more worried about the economy than women were.
Finally, there were considerable shifts in some life course factors. The share of women under age 35 who wanted to have more children and who also said they were still in school rose appreciably between 2022 and 2025, as did the share who said they live with their parents, the share without a suitable partner or separated from a partner, and the share who said they simply want to grow and develop more as a person. For men, school enrolment was much less commonly reported as an issue, and the share who said they wanted to grow more as a person was also lower compared to women. The pursuit of self-development as a barrier to fertility appears to be a disproportionately female-coded concern, perhaps related to popular media narratives which assert that women “lose their identity” when they have children. Interestingly, men were also more likely than women to say that their partner doesn’t want to have kids. This is consistent with the results above, showing that men have higher fertility ideals and intentions than women. Women may have more influence in fertility decisions than male partners.
Overall, young Canadian men interested in having kids are more likely to report many kinds of financial, economic, or work-related barriers, while young Canadian women interested in having kids are more likely to be worried about childcare and other care obligations. Women worry who will do the work; men worry how it will be paid for. On the whole, the sexes have fairly similar odds of reporting concerns about debt and the need to focus on career, as well as the perception that children require intense care.
Conclusion
In this new survey of Canadian fertility preferences and family life, we find that Canadian preferences have been fairly stable over the last three years, and that Canadian women and men have fairly similar family desires. While Canadian men have slightly higher fertility ideals compared to Canadian women, and within couples Canadian women are likelier to be the partner preferring to hold off on having children, the gaps in desired family size are only significant among Indigenous Canadians and Canadians of African descent. In these cases, men have appreciably higher fertility ideals. We also found notably higher ideals among men in the Prairie provinces compared to women in that region. Educational attainment is correlated with fertility ideals, as men with graduate education have lower fertility ideals than men with other levels of educational attainment, and compared to women with graduate education.
When asking about near-term fertility decision-making, we found that the factors for delaying fertility among women were largely unchanged from 2022. Finances and life-timing issues remain important considerations for Canadians. There were, however, a few notable changes. Surprisingly, Canadians demonstrated appreciably more concern, compared to 2022, about the cost and accessibility of childcare delaying their fertility—this despite the implementation of Canada’s multi-billion-dollar, subsidized childcare program. Evidently, this program has not achieved its desired effects.
Family life satisfaction and general life satisfaction are clearly correlated with achieving desired fertility. Overshooting fertility ideals had a larger impact on reduced general and family life satisfaction compared to those who undershot fertility ideals. As overshooting fertility ideals is far less common than undershooting ideals, the total loss of family-life and general life satisfaction due to undershooting ideals is of greater impact.
The data suggest that for many Canadian women and men, achieving the family life they desire remains a challenge. Certainly, affordability issues are a factor to reckon with, and policies that address housing and economic growth may help, but these relationships are not always straightforward, as the growth of childcare worries despite more childcare subsidies makes clear. As we noted in our 2022 survey, other factors are more difficult to address through public policy. What we can say is that, while rates of marriage and family formation have declined in Canada, this is not because of some great divergence in family desires between women and men, as both sexes share similar fertility desires.
One important sex difference may have large social consequences. On the one hand, it is natural to find that men would have more financially focused concerns about fertility decisions, while women would have greater concerns for how care duties will be arranged, since fathers tend to have more working hours than mothers, while mothers tend to have more care responsibilities. Public policy generally focuses on affordability. Policymakers have been less focused on restoring strong community support around new parents. Public policy and civil society have an important role in helping parents build confidence in their abilities, and in reshaping how we approach parenting.
References
Bumpass, L., and C. F. Westoff. “The Prediction of Completed Fertility.” Demography 6, no. 4 (1969): 445–54. https://doi.org/10.2307/2060089.
Chei, C.L. et al., “Happy Older People Live Longer.” Age and Ageing 47, no. 6 (2018): 860–66, https://doi.org/10.1093/ageing/afy128.
Cheung F. and R.E. Lucas, “Assessing the Validity of Single-Item Life Satisfaction Measures: Results from Three Large Samples.” Quality of Life Research 23, no. 10 (2014): 2809–18, https://link.springer.com/article/10.1007/s11136-014-0726-4 .
Cleland, J., K. Machiyama, and J. B. Casterline. “Fertility Preferences and Subsequent Childbearing in Africa and Asia: A Synthesis of Evidence from Longitudinal Studies in 28 Populations.” Population Studies 74, no. 1 (2020): 1–21. https://doi.org/10.1080/00324728.2019.1672880.
Coombs, L. C. “Reproductive Goals and Achieved Fertility: A Fifteen-Year Perspective.” Demography 16, no. 4 (1979): 523–34. https://doi.org/10.2307/2060932.
Fergusson. D.M. et al., “Life Satisfaction and Mental Health Problems (18 to 35 years).” Psychological Medicine 45, no. 11 (2015): 2427–36, https://doi.org/10.1017/s0033291715000422.
Luhmann, M. et al., “The Prospective Effect of Life Satisfaction on Life Events.” Social Psychological and Personality Science 4, no. 1 (2013): 39–45, https://doi.org/10.1177/1948550612440105.
Max Planck Institute for Demographic Research and Vienna Institute of Demography. “Human Fertility Database.” https://www.humanfertility.org/Country/Country?cntr=CAN.
Statistics Canada. “Fertility Indicators, Provinces and Territories: Interactive Dashboard.” February 24, 2022. https://www150.statcan.gc.ca/n1/pub/71-607-x/71-607-x2022003-eng.htm.
Stone, L., K. Golovina, and E. Bastionelli. “Fertility Preferences: Global Data 1936-2023.” No. FSD4032. Finnish Social Science Data Archive. https://services.fsd.tuni.fi/catalogue/FSD4032?study_language=en&lang=en.
Stone, L. “Religion and Fertility in Canada.” Cardus, 2023. https://www.cardus.ca/research/family/reports/religion-and-fertility-in-canada/.
Stone, L. “She’s (Not) Having a Baby: Why Half of Canadian Women Are Falling Short of Their Fertility Desires.” Cardus, 2023. https://www.cardus.ca/research/family/reports/she-s-not-having-a-baby/.
Teng, Y., R. Margolis, and H. Ramos. “Trends in Indigenous Fertility in Canada, 2001–2021.” Demographic Research 53 (July 2025): 175–86. https://doi.org/10.4054/DemRes.2025.53.6.