Table of Contents
Table of Contents
Executive Summary
This report explores how learning continued in Ontario’s independent schools during the continuous and disruptive school closures of the 2020–21 school year. It also investigates the financial, promotional, and business impact of these disruptions.
Context
Ontario experienced two waves of high COVID-19 infection rates during this time period—one beginning in September/October 2020 and cresting in early January, and another beginning in early March 2021 and cresting in early April—resulting in a combined three to four months of remote learning (depending on the school and region) in the 2020–21 school year. (This does not include the previous school year’s months of remote learning, from March to September 2020.) Multiple school closures through the year, differing from region to region (and, in some cases, notice about impending closures given at the end of the school day, to be implemented the following day) meant that schools needed to navigate transitions exceptionally well, to have a solid plan in place covering multiple contingency plans, and to do so while providing solid curricular support, creative assessment, and meaningful social connection for students.
Approach
In May 2021, we surveyed school leaders from seventy independent schools affiliated with one Christian school association in Ontario (an 83 percent participation rate). Of responding schools, almost three-quarters are elementary schools (71 percent), and just over three-quarters (77 percent) have fewer than three hundred students.
Resilience of Sector
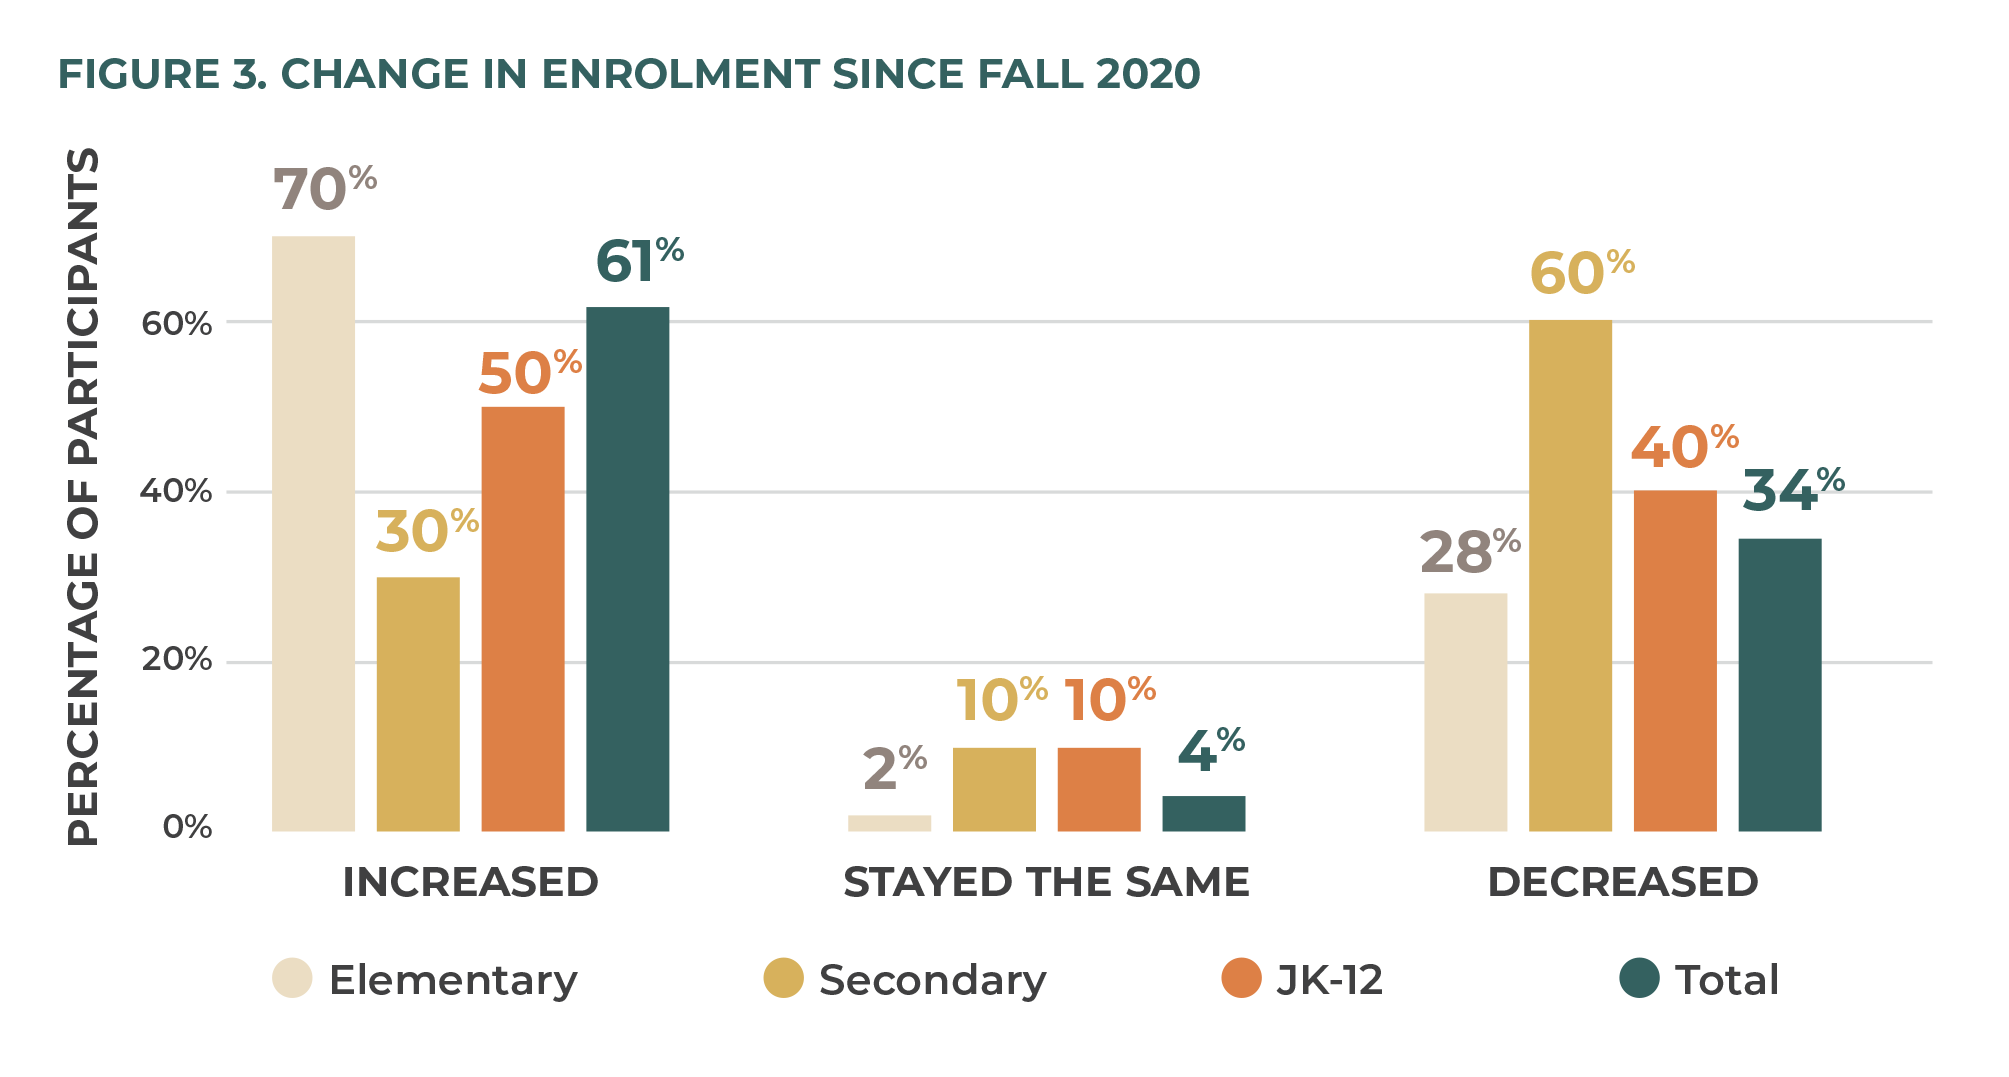
The survey finds that overall Christian independent-school enrolments increased in the sector over the previous year, led by elementary schools (70 percent experienced growth since fall 2020). However, twice as many secondary schools (60 percent) experienced enrolment decline as growth (30 percent), while JK–12 (junior kindergarten to grade 12) schools had slightly more enrolment growth (50 percent) than decline (40 percent).
Learning Continuity
When not in lockdown, the schools almost entirely provided face-to-face learning, except for families who particularly wanted remote learning (44 percent of schools provided this option). The schools went over and above public health orders in ensuring student and staff safety, through health and safety measures, scheduling modifications, space-usage adjustments, and curtailing numerous non-academic activities.
During lockdowns, the secondary schools continued to offer all courses remotely, while elementary schools focused on literacy and numeracy, Bible, and social studies and science. It is notable that many schools reported providing regular physical packages of learning materials for their students—especially for younger students. Generally speaking, as students got older, they were engaged in more hours of synchronous learning per day, except in secondary school, where the majority of schools (52 percent) reported between just one to three synchronous instructional hours per day.
Another critical area of insight relates to student support services (formerly, special education). Only one percent of surveyed schools discontinued these services, while 70 increased or continued with the same level of support. (By contrast, local district school boards struggled to find staff to fill these positions, leaving students in the public system with limited options for continuing their education during lockdown periods.)
Business Continuity
Independent schools in Ontario are unusual in that they do not receive government funding for the education they provide, unlike the 75 percent of independent schools in Canada outside Ontario and the large majority of non-government schools around the world. 1 1 See forthcoming Cardus costing study by D. Hunt, A. Momoh, and D. Van Pelt. Instead, tuition and fundraising constitute the entirety of revenues. COVID made both difficult. Fully 60 percent of schools reported offering tuition assistance to families, and 64 percent either decreased fundraising sales and events or stopped them altogether. But interestingly, 76 percent saw monetary donations either increase or continue as normal.
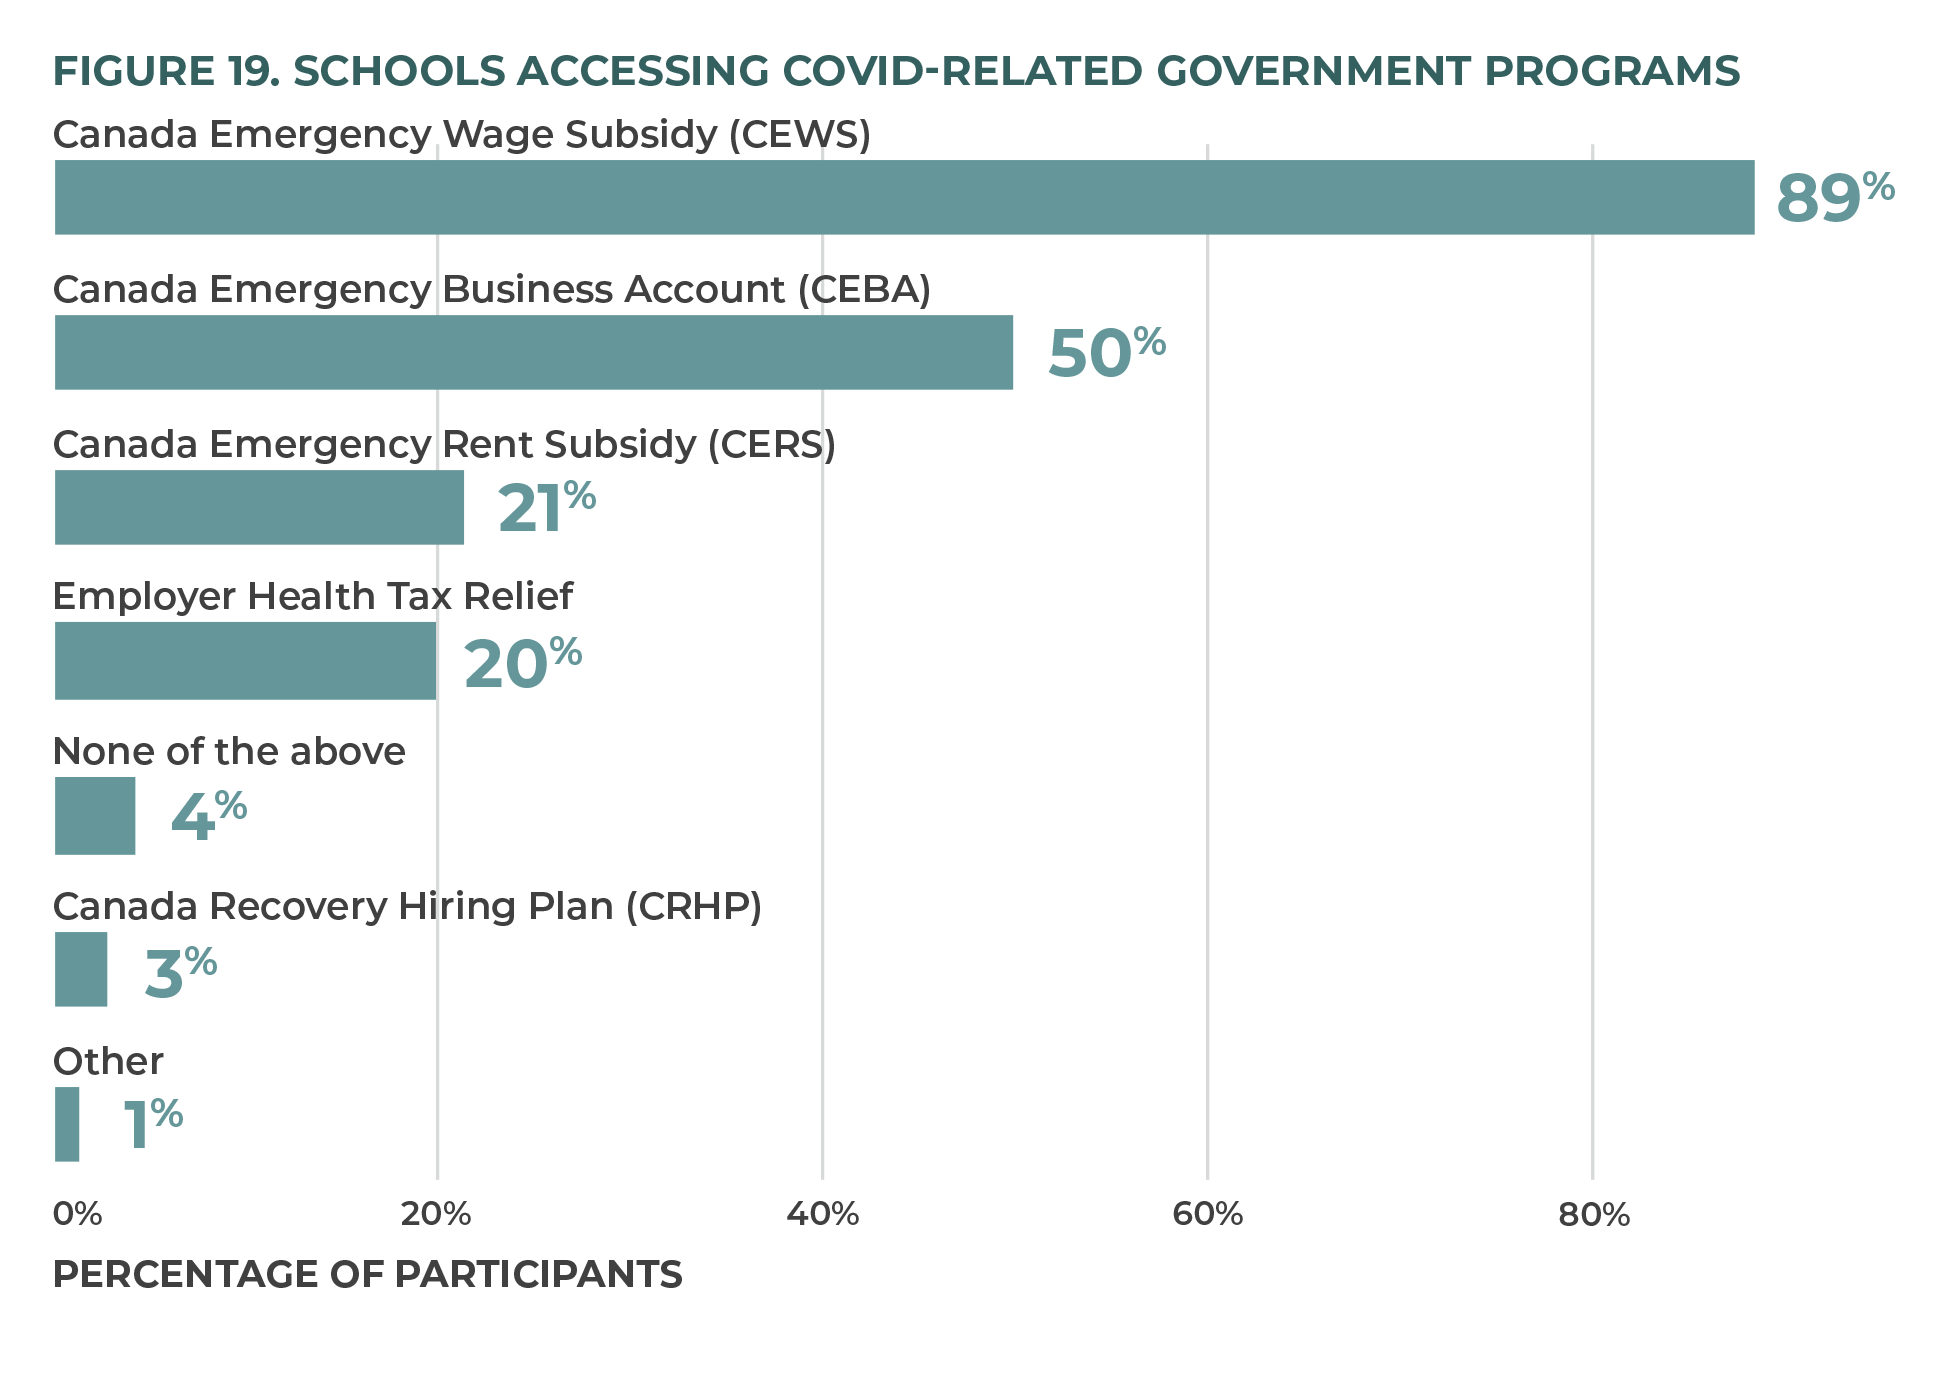
When asked about government assistance programs, 89 percent reported that they took part in the Canada Emergency Wage Subsidy and 50 percent used the Canada Emergency Business Account.
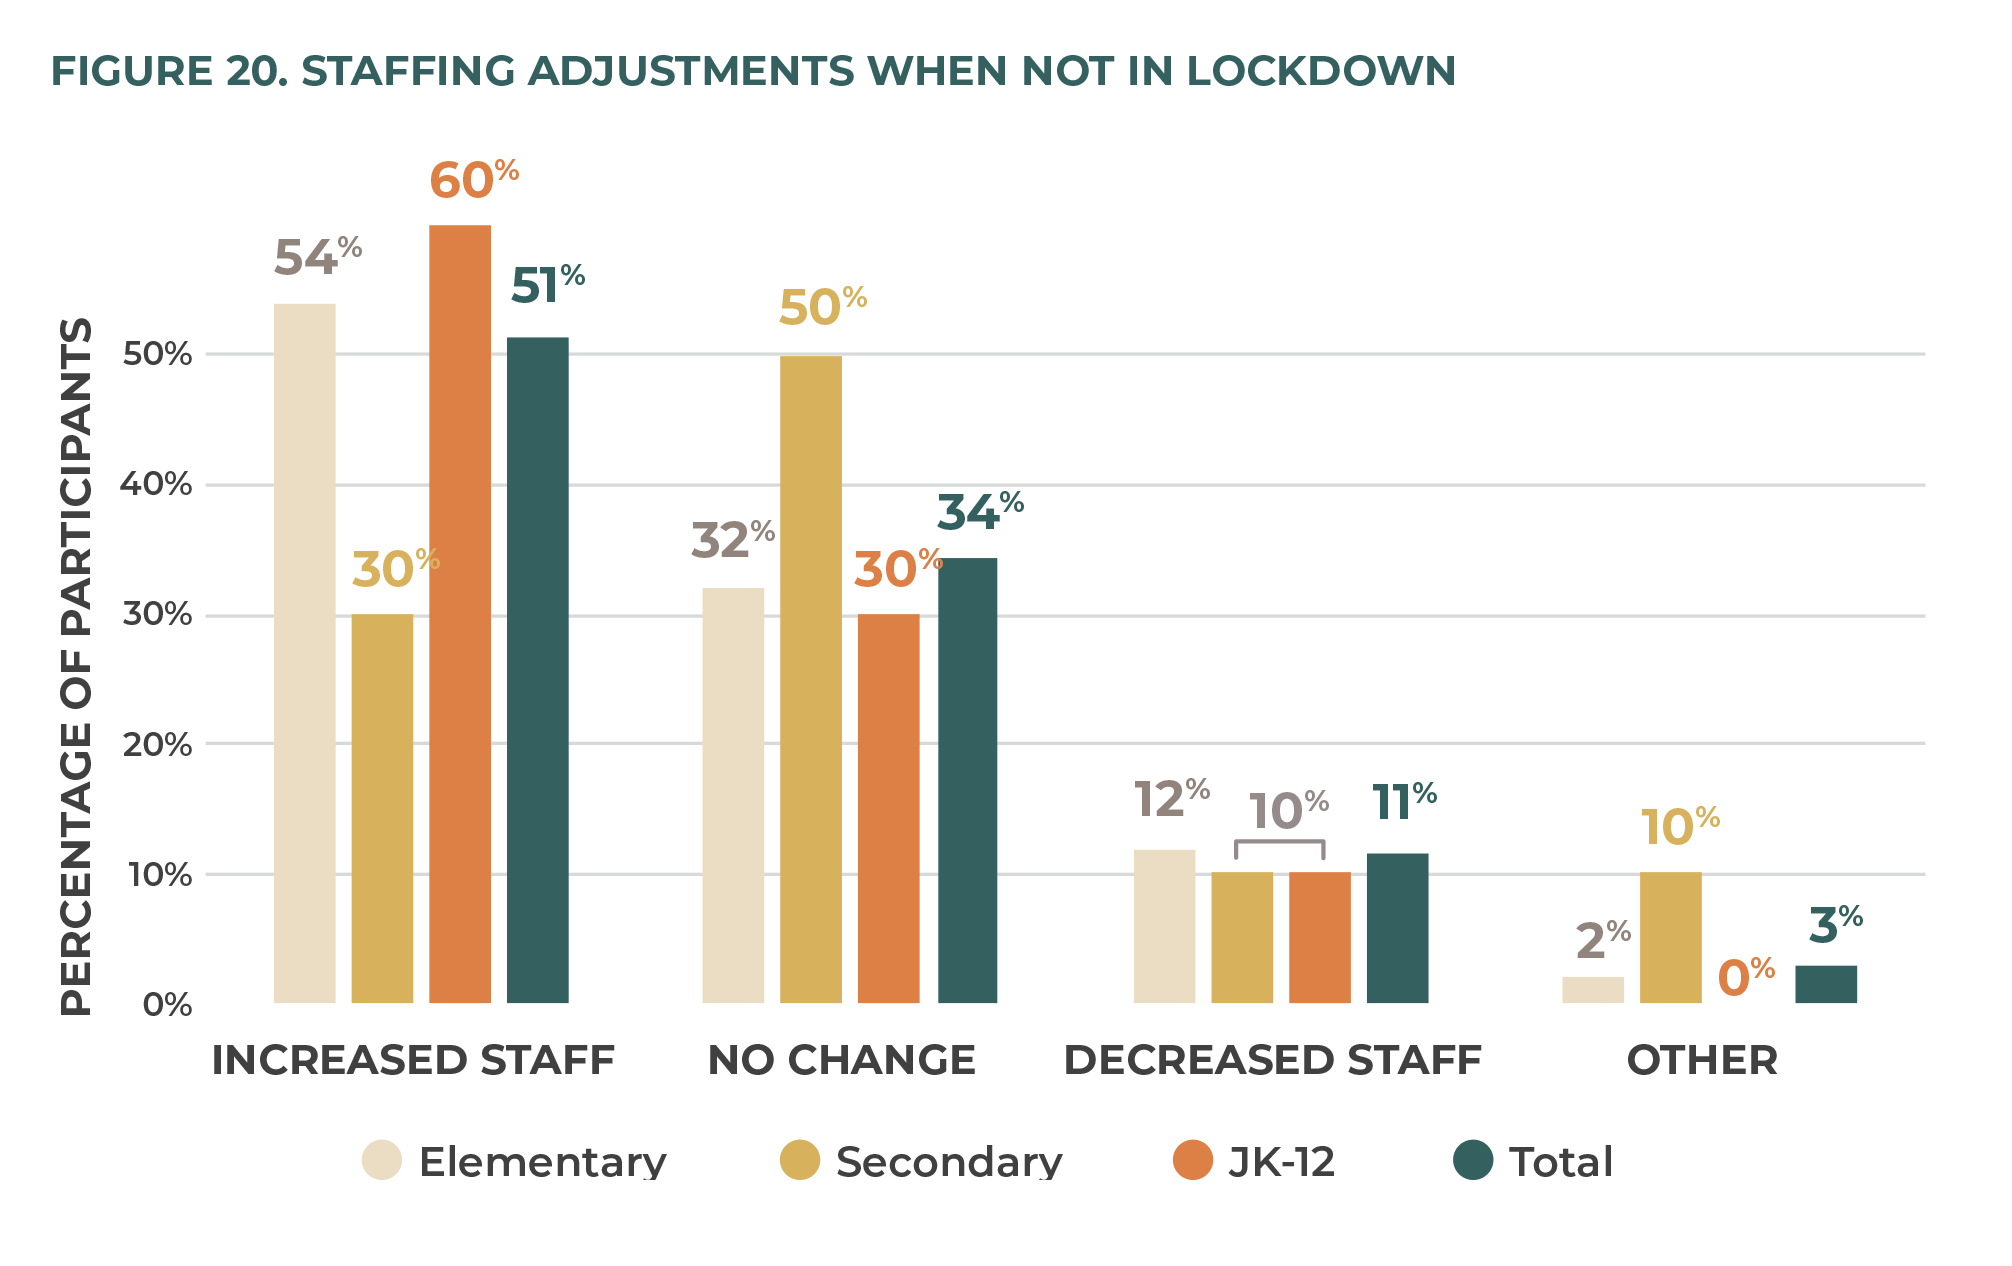
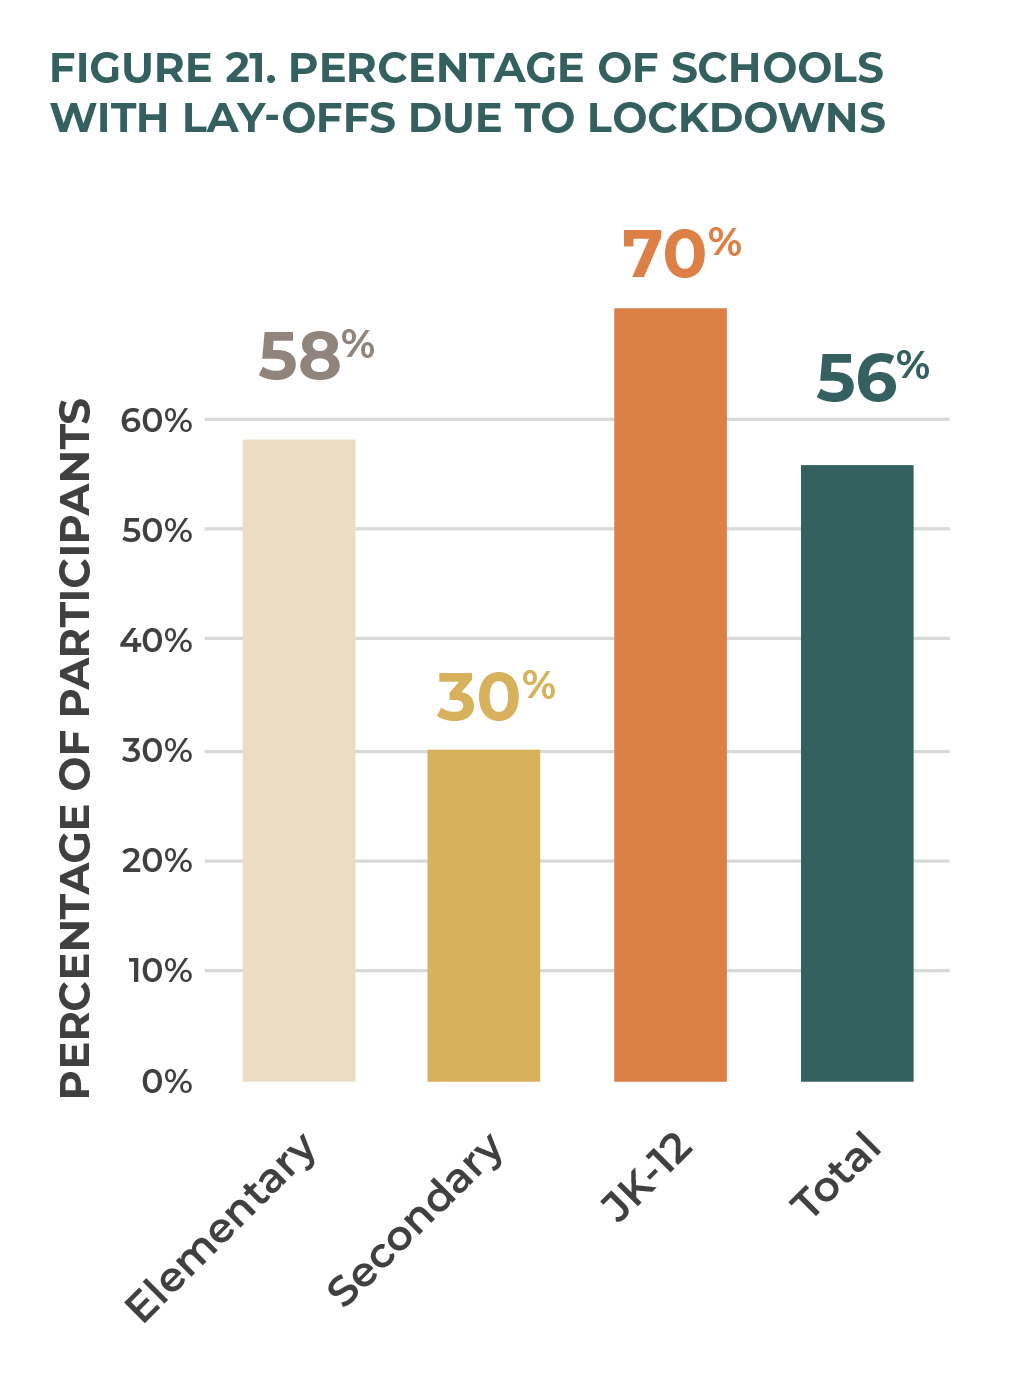
Staffing needs varied considerably, depending on whether the schools were in government-mandated lockdowns. When not in lockdown, at least 80 percent of schools in all categories—elementary, secondary, and JK to 12—either increased staff or maintained staffing levels. But 56 percent had to make layoffs due to lockdowns.
Top Concerns
When asked about their top concerns, school leaders overwhelmingly pointed toward the effects that the school closures and remote learning had on their various stakeholders. Some of the highest levels of concern were related to student mental health and academic performance, and the stress levels, workload, and mental health of teachers and school leaders.
Implications
As with the emergency school closures in the spring of 2020, these independent schools showed an ability to transition quickly and nimbly between in-person and remote learning. They also showed an ability to adapt to the unique needs of their individual learning communities. School leaders were able to respond to local circumstances, student needs, and age ability of students, to form a type of education that worked for their school.
Whether the question is education delivery, community connection, or school operations, the story of Ontario’s Christian independent schools reveals resilience, agility, malleability, care, and resourcefulness. Overall, the findings point to a COVID success story. The generosity and adaptability of Christian independent schools and their communities are in part due to the autonomous nature of independent schooling in Ontario and may hold promise for future school design and delivery in other settings (including government-operated schools). However, the Ontario government’s failure to equitably support the health and safety of all students in the province is also highlighted in this report and cannot be dismissed in future reviews of government policy and action during the COVID-19 pandemic.
Introduction
Debate about governmental responses to the COVID-19 pandemic will continue for many years. In particular, the practices of closing specific sectors, limiting mobility, and implementing stay-at-home orders will be the subject of much scrutiny. The social, emotional, and economic implications will continue to be studied for years to come. This report builds on studies that have already been undertaken, through a quantitative and self-reporting study of a small group of Christian schools in Ontario concerning the 2020–21 school year. Data from this study can be fruitfully compared with data from an earlier study, completed during the initial months of the COVID-19 pandemic in spring 2020. 2 2 P. Marcus, D. Van Pelt, and T. Boven, “Pandemic Pivot: Christian Independent Schooling During the Initial 2020 Lockdown,” Cardus, 2021, https://www.cardus.ca/research/education/reports/pandemic-pivot/.
In March 2020, schools in Ontario were faced with the notion of school closures for the first time in living memory. 3 3 Office of the Premier, “Statement from Premier Ford, Minister Elliott, and Minister Lecce on the 2019 Novel Coronavirus (COVID-19),” Government of Ontario, March 12, 2020, https://news.ontario.ca/opo/en/2020/03/title.html. The province was in the preliminary stages of grappling with a pandemic for which non-pharmaceutical interventions, which were largely unheard-of before, would become commonplace. On March 12, Ontario schools were ordered closed and remained closed through to the start of the 2020–21 school year. On June 19, 2020, the Ontario government released its first version of its “Guide to Reopening Ontario’s Schools.” 4 4 “Guide to Reopening Ontario’s Schools,” Ontario Ministry of Education, July 30, 2020, updated March 2, 2021, https://www.ontario.ca/page/guide-reopening-ontarios-schools. This document, which has been revised a number of times since its initial release, provided guidance for Ontario schools to reopen for the 2020–21 school year, outlining the recommended and required health and safety precautions that schools in Ontario would need to take in order to operate. The precautions included daily screening, physical distancing, student cohorting, use of personal protective equipment, and were put in place to ensure that schools could continue to operate.
Ontario experienced two waves of high COVID-19 infection during this time period: one beginning in September/October 2020 and cresting in early January 2021, and another beginning in early March 2021 and cresting in early April. During the first of these waves, schools stayed open in Ontario until their scheduled two-week Christmas break after December 17, 2020. On December 21, the Ontario Ministry of Education announced that schools would stay closed following the Christmas break and would not return to in-person learning until at least January 11, 2021. 5 5 Office of the Premier, “Ontario Announces Provincewide Shutdown to Stop Spread of COVID-19 and Save Lives,” Government of Ontario, December 21, 2020, https://news.ontario.ca/en/release/59790/ontario-announcesprovincewide-shutdown-to-stop-spread-of-COVID-19-and-save-lives. On January 11, some Ontario school buildings were allowed to reopen, as Ontario took a regional reopening approach based on certain key public-health indicators. All schools in all regions returned to in-person learning on February 16. 6 6 “Schools Return to In-Person Learning,” Ontario Ministry of Education, February 11, 2021, updated March 4, 2021, http://www.edu.gov.on.ca/eng/parents/returning-to-in-person-learning.html.
On February 11, 2021, the government announced that the scheduled March break would be delayed until mid-April. 7 7 “Ontario Delays March Break in an Effort to Reduce Community Transmission of COVID-19,” Ontario Ministry of Education, February 11, 2021, https://news.ontario.ca/en/statement/60325/ontario-delays-march-break-in-aneffort-to-reduce-community-transmission-of-COVID-19. While students in Ontario were out of school for the delayed spring break, it was announced that schools would not be returning to in-person classes following the break. 8 8 Office of the Premier, “Ontario Moves Schools to Remote Learning Following Spring Break,” Government of Ontario, April 12, 2021, https://news.ontario.ca/en/release/61106/ontario-moves-schools-to-remote-learningfollowing-spring-break. Although schools continued to anticipate a return to in-person learning, the government announced on June 2 that schools would continue with remote learning to the end of the school year. 9 9 Office of the Premier, “Remote Learning to Continue across Ontario for the Remainder of School Year,” Government of Ontario, June 2, 2021, https://news.ontario.ca/en/release/1000251/remote-learning-to-continue-across-ontariofor-the-remainder-of-school-year.
This report explores how learning continued in these independent schools during the school closures of the 2020–21 school year. It also investigates the financial, promotional, and business impact of these disruptions.
Christian independent schools in Ontario, like those in the Atlantic provinces, receive no government funding for operations or capital. This sets them apart from their counterparts in Quebec and to the west. On average, 96.6 percent of revenue is derived from tuition and fundraising. 10 10 Based on the 2018–19 “Cash Basis Tuition Listing” from Edvance Financial Services “Cost Per Pupil” calculations. According to previous research, families that choose Christian independent schools do not fit the elitist stereotype that many people may assume. Instead, they are largely middle-class families whose incomes and occupations are similar to those of other families who send their children to publicly funded schools. 11 11 D. Van Pelt, D. Hunt, and J. Wolfert, “Who Chooses Ontario Independent Schools and Why?,” Cardus, September 9, 2019, https://www.cardus.ca/research/education/reports/who-chooses-ontario-independent-schoolsand-why/; A. MacLeod, S. Parvani, and J. Emes, “Comparing the Family Income of Students in Alberta’s Independent and Public Schools,” Fraser Institute, October 2017, https://www.fraserinstitute.org/sites/default/files/comparingthe-family-income-of-students-in-albertas-independent-and-public-schools.pdf; J. Clemens, S. Parvani, and J. Emes, “Comparing the Family Income of Students in British Columbia’s Independent and Public Schools,” Fraser Institute, March 2017, https://www.fraserinstitute.org/sites/default/files/comparing-family-income-of-students-in-BCs-independent-and-public-schools.pdf. These families report choosing an independent school because “it is safe,” “instills confidence in students,” and “teaches students to think critically and independently.” In addition, families of religious independent schools report choosing them because they “support their values,” are engaged in “teaching right from wrong,” and reinforce “their faith or religious beliefs.” 12 12 Van Pelt, Hunt, and Wolfert, “Who Chooses Ontario Independent Schools and Why?”
Methodology
Survey Design
This report is based on data gathered and analyzed through an online survey. (Additional tables are provided in Appendix A.) This report’s authors developed an online questionnaire, and Edvance Christian Schools Association distributed it in May 2021. It was modeled on the “Pandemic Pivot” survey that Edvance launched in May 2020 and that Cardus published in June 2021.
13
13
Marcus, Van Pelt, and Boven, “Pandemic Pivot.”
Like the first survey, this second one is adapted from a survey of Christian schools that was designed, administered, and reported on by the Association of Christian Schools International.
14
14
We are grateful to L.E. Swaner and ACSI-USA for permitting our use and adaptation of their survey. We have also modeled our report on their paper, which conveys and discusses their survey findings for Christian schools in
their association (located mostly in the USA). See L.E. Swaner and M.H. Lee, “Christian Schools and COVID-19: 2020-2021 School Profile,” Colorado Springs: Association of Christian Schools International, 2020.
Potential survey participants were the principals (or school heads or delegates) of the eighty-four schools affiliated with Edvance. Access was distributed by email on May 13, with a letter of explanation and invitation to participate. Three additional reminders were sent between May 13 and May 31. The questionnaire was closed at 11:59 p.m. on May 31, 2021. Survey limitations are discussed in Appendix B, and the full questionnaire can be found in Appendix C.
Participation Rate
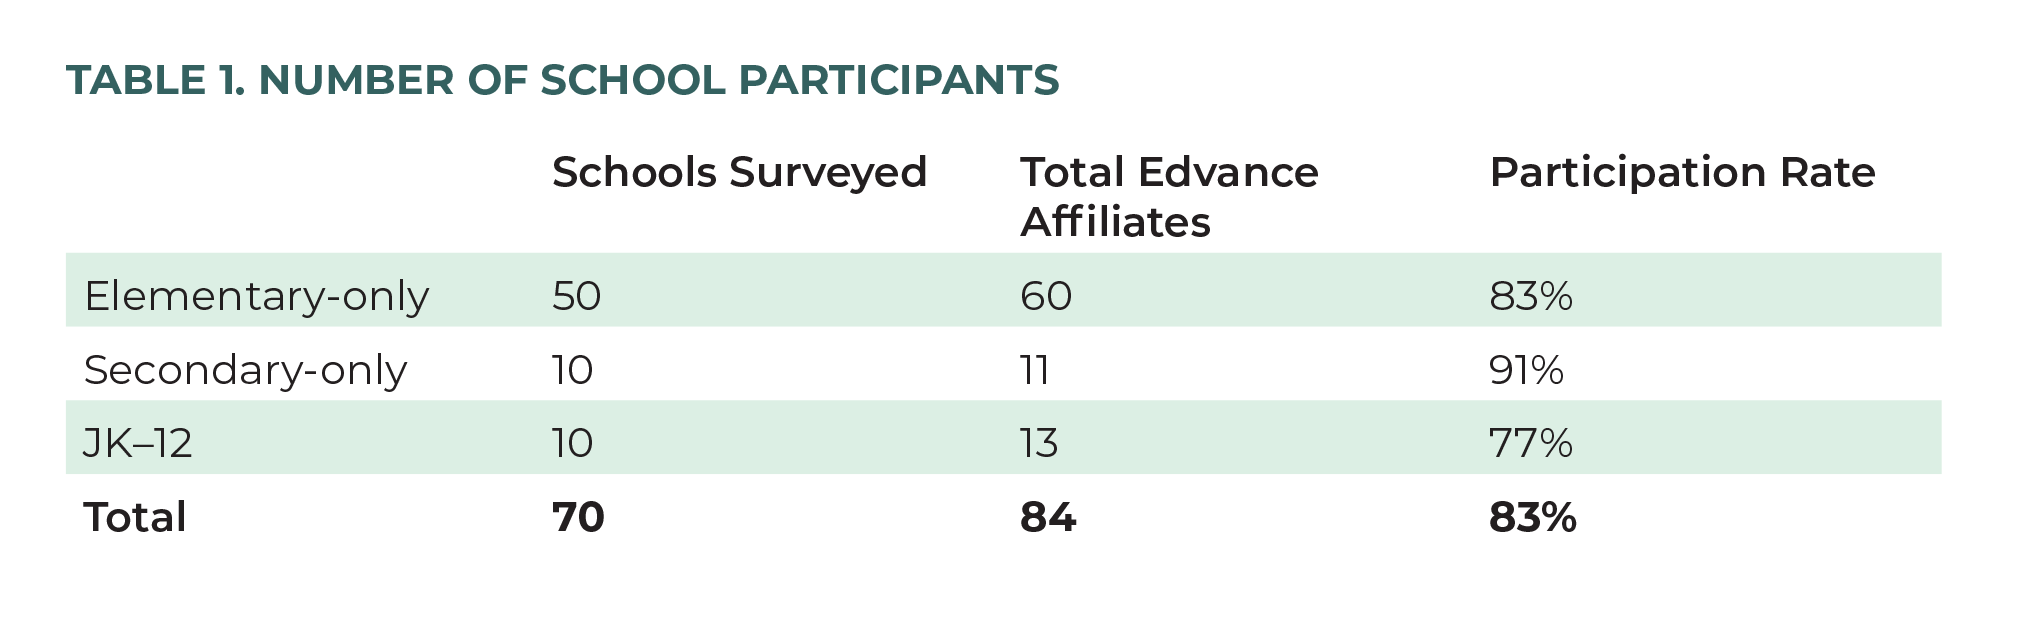
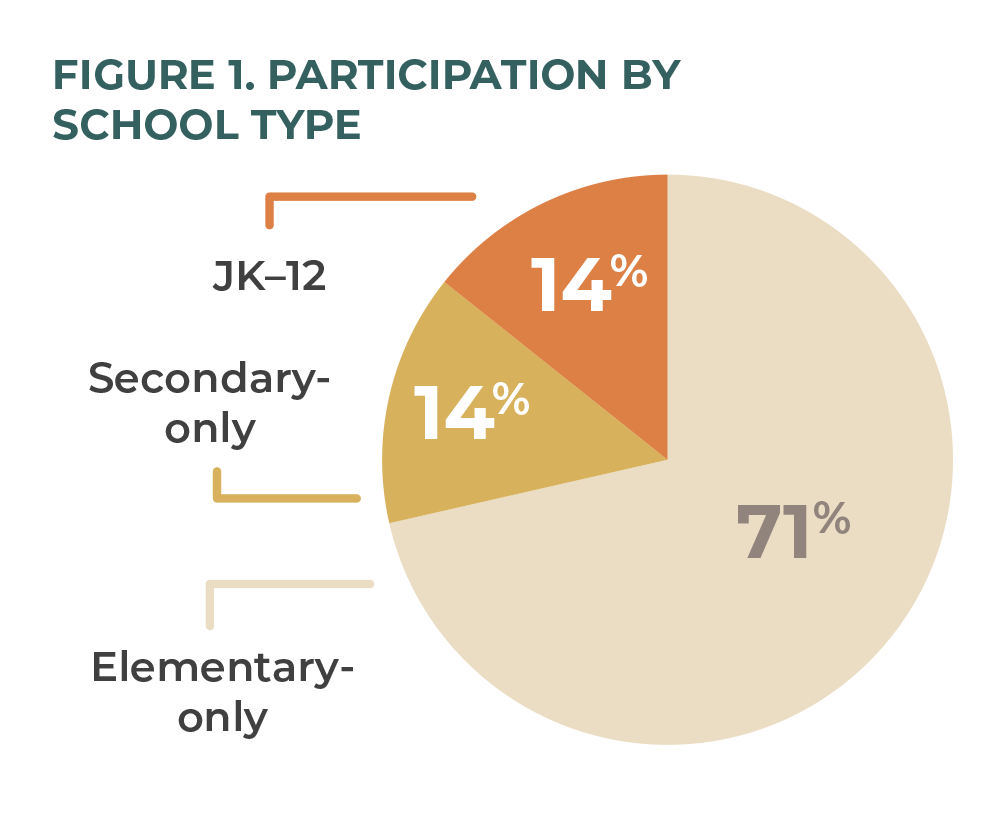
The survey had a participation rate of 83 percent. Of Edvance’s eighty-four schools, seventy participated in the survey. Fully 96 percent of respondents identified themselves as principals, with 3 percent also identifying as teachers, and 4 percent identifying as “other” (interim principal, principal’s assistant, or administrative assistant). Table 1 shows the number of participants in each school-level type and the total number of schools at each level. Figure 1 shows the percentage breakdown of respondents by school type: elementary (typically JK–8), secondary (typically grades 9–12), and elementary and secondary (typically JK–12).
School Size and Grade Level
In fall 2020, the eighty-four schools had a combined enrolment of 15,130, rising to 15,366 by spring 2021, with an overall median school enrolment of 149.5 students as of June 2021. The participating schools were near representative of all Edvance-affiliate schools in terms of school size, with a median student population of 162.5 in fall 2020 and 166 in June 2021. Respondents were also representative in terms of grade levels offered.
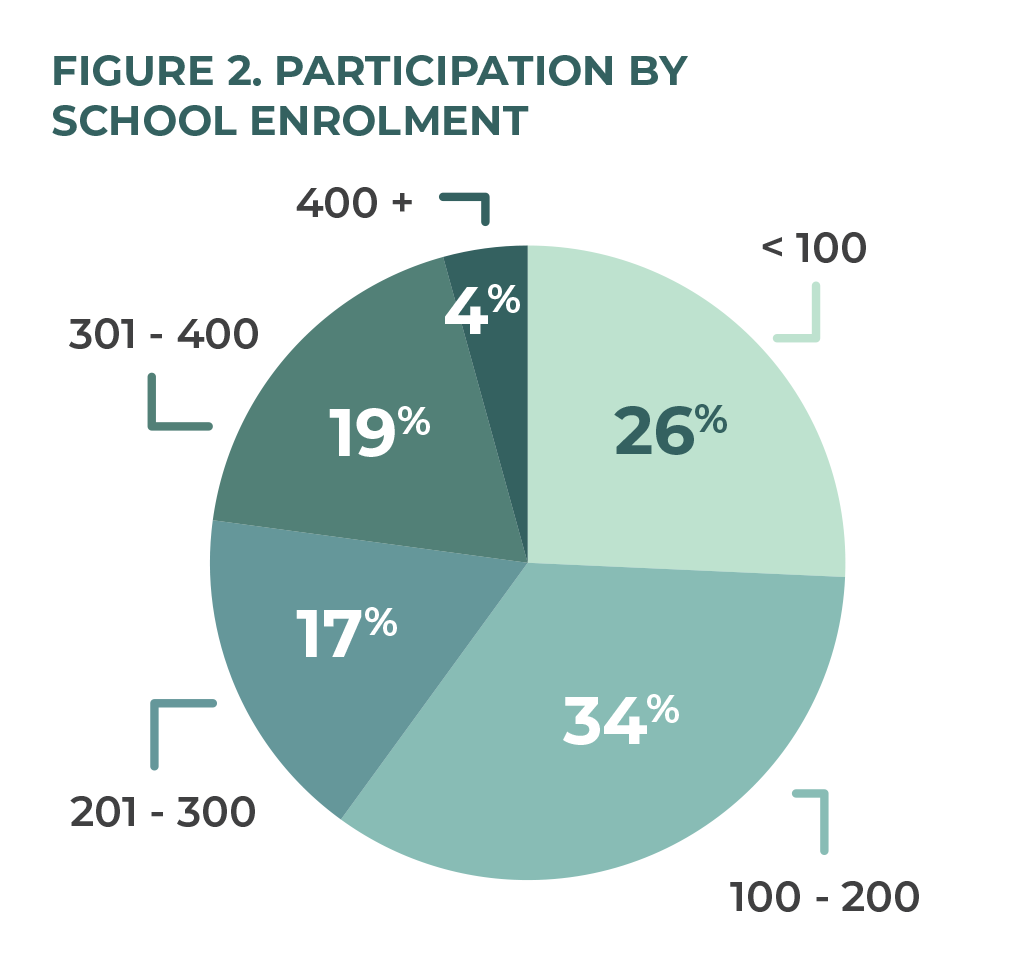
Throughout this report, school size is defined in terms of student enrolment by head count. As shown in figure 2, just over one-quarter (26 percent) of participating schools had fewer than 100 students, just over one-third (34 percent) had 100–200 students, less than one-fifth (17 percent) had between 201–300 students, almost one-fifth (19 percent) had 301–400 students, and only three schools (4 percent) had student enrolment over 400.
Findings
School Enrolment
Respondents were asked to report their enrolment at time of survey completion. These data were compared to the enrolment data that schools submitted to Edvance at the beginning of the 2020–2021 school year. Seventy percent of elementary schools showed an increase from the fall of 2020 to the spring of 2021, while half of JK–12 schools reported an increase. Seventy percent of secondary schools, on the other hand, reported either decreased or stagnant enrolment over the same time period (figure 3). In terms of actual aggregate enrolment numbers, Edvance schools who responded to this survey grew by 236 students (1.6 percent) from September 2020 to the time of survey close.
Elementary schools saw an increase in enrolment far above that of secondary or JK–12 schools. Perhaps this was due to these elementary schools providing a dynamic, engaging program that parents felt was missing in their previous school environment. Or, perhaps the secondary offerings were seen as equal to that of other school sectors, and parents made the choice to move to a tuition-free education given this perceived parity. There were also fewer international students in the 2020–21 school year, due to travel restrictions. The portion of international students would have been larger in secondary than in elementary, which might also contribute to the enrolment drop.
Education Delivery When Not in Lockdown
Half of respondent schools offered some type of remote learning for their students during normal face-to-face learning times, either primarily in-person with remote as an option (44 percent), or fully blended (7 percent). Nearly half (46 percent) of respondent schools offered only in-person instruction in 2020–21. No schools offered strictly remote learning in any category (figure 4).
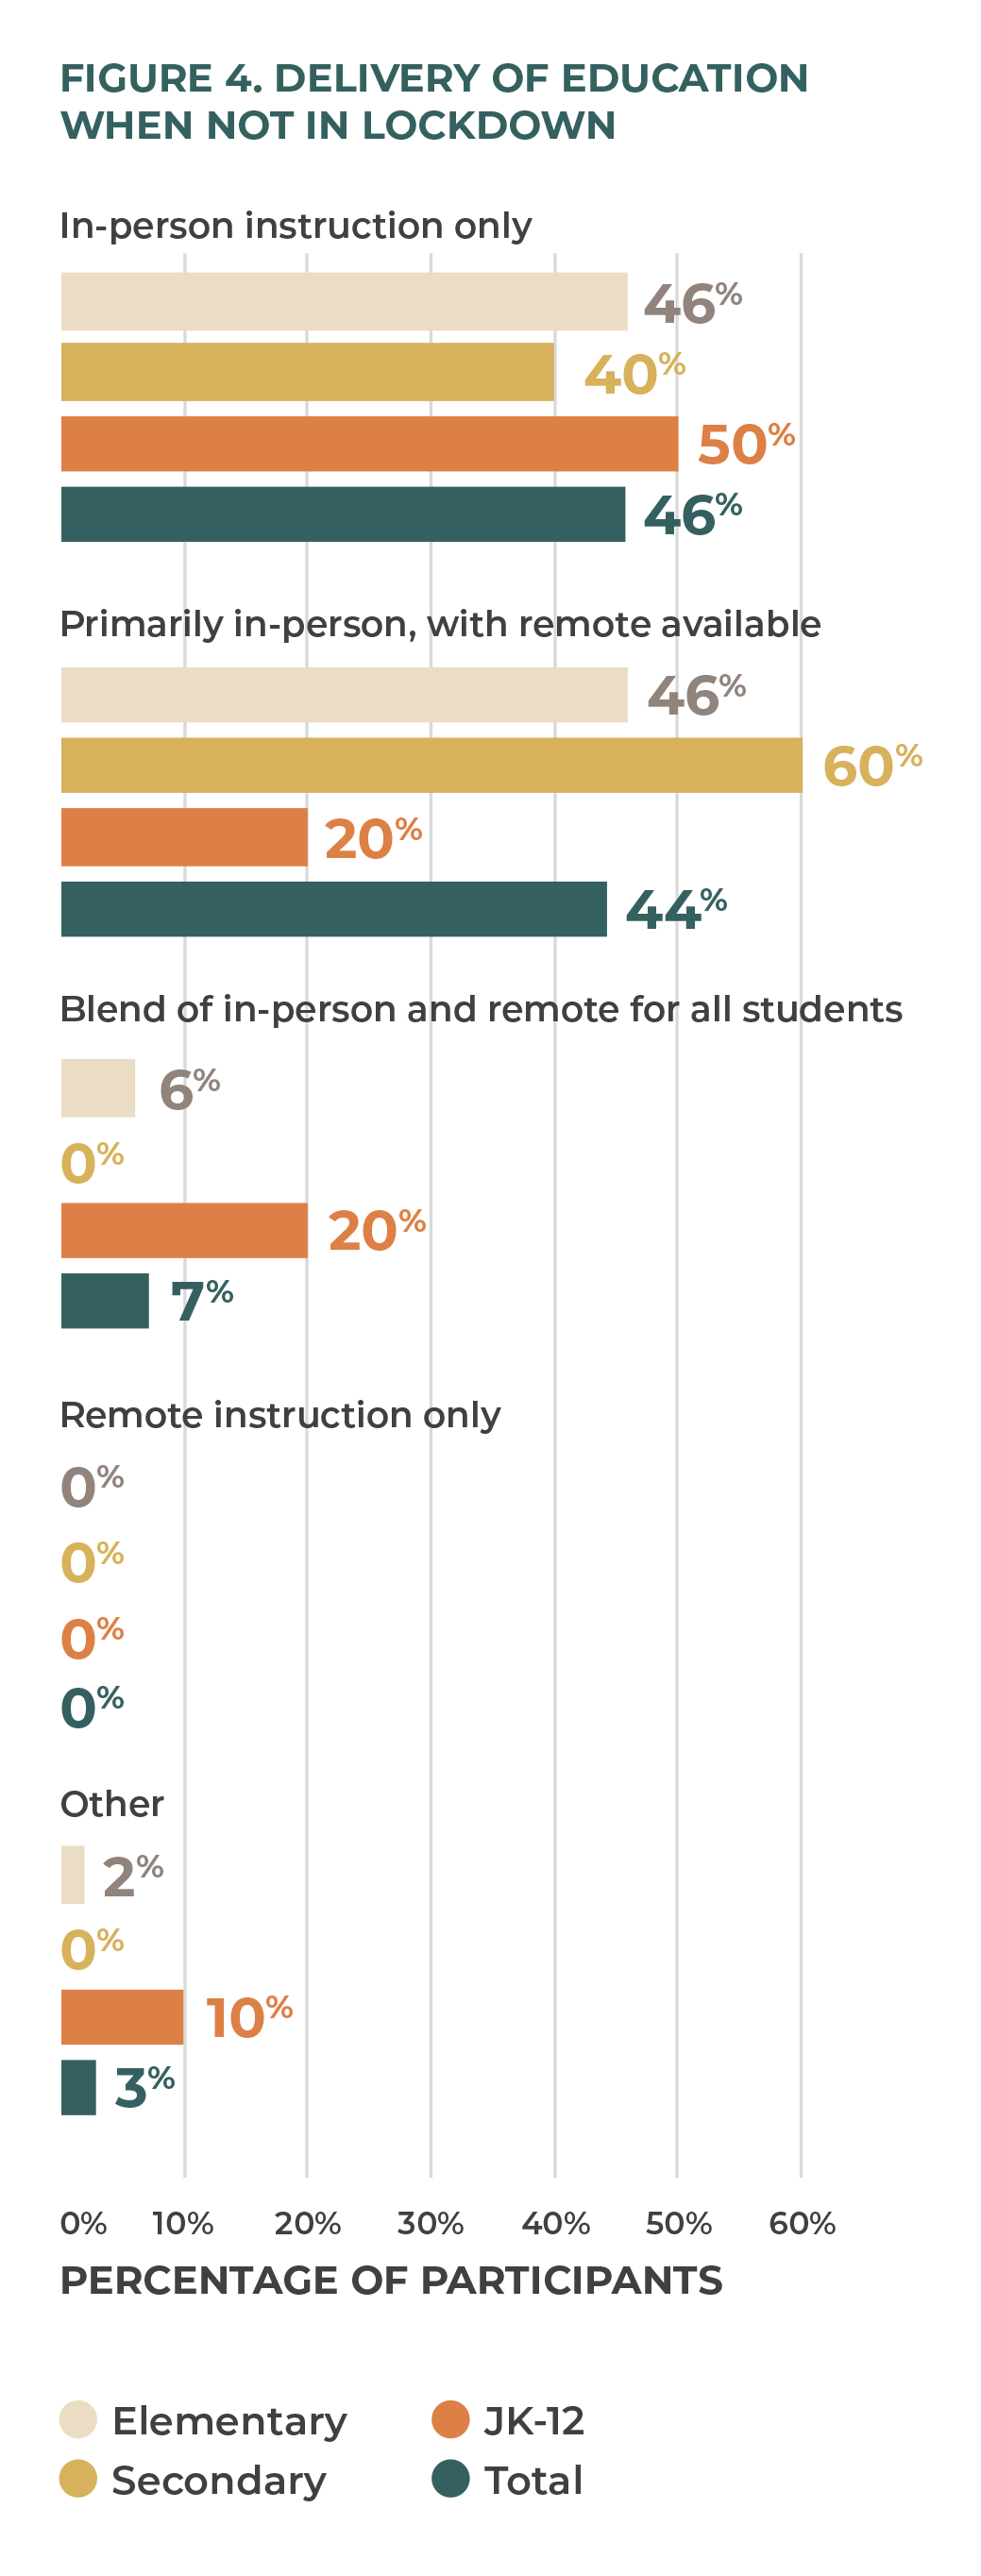
Survey participants indicated that a large percentage of their school year was spent in-person. Forty-six percent of elementary schools delivered only face-to-face learning, and another 46 percent focused primarily on in-person learning but offered an online option even when school buildings were open. They saw a need to focus on keeping elementary students engaged with face-to-face learning, when possible. A hybrid system was more common for older students. As such, it is not surprising that secondary schools, at 60 percent, were the most likely to have some students opting for remote learning amid a primarily face-to-face school orientation. Those schools that did offer a hybrid or completely virtual option did so based on specific student/family preference to participate in remote learning during the pandemic. The remaining 40 percent of secondary schools offered only in-person instruction. Exactly half of JK–12 schools offered only face-to-face instruction, 20 percent were primarily in-person with the option of remote learning for those desiring it, and 20 percent blended in-person and remote learning for all students.
Scheduling When Not in Lockdown
Respondents were asked to choose from a list of scheduling modifications that was based on provincial and local recommendations and requirements. Among all school types, the most frequent scheduling modification was using cohorts of student groups (figure 5). Fully 100 percent of elementary schools implemented this precaution, whereas 90 percent of secondary schools and 90 percent of JK–12 schools did so. Less frequently, schools implemented measures such as staggered schedules, concurrent instruction, and reduction of rotary classes. Least frequent among all school types was modifying start times and alternating schedules, which was mostly implemented by JK–12 schools.
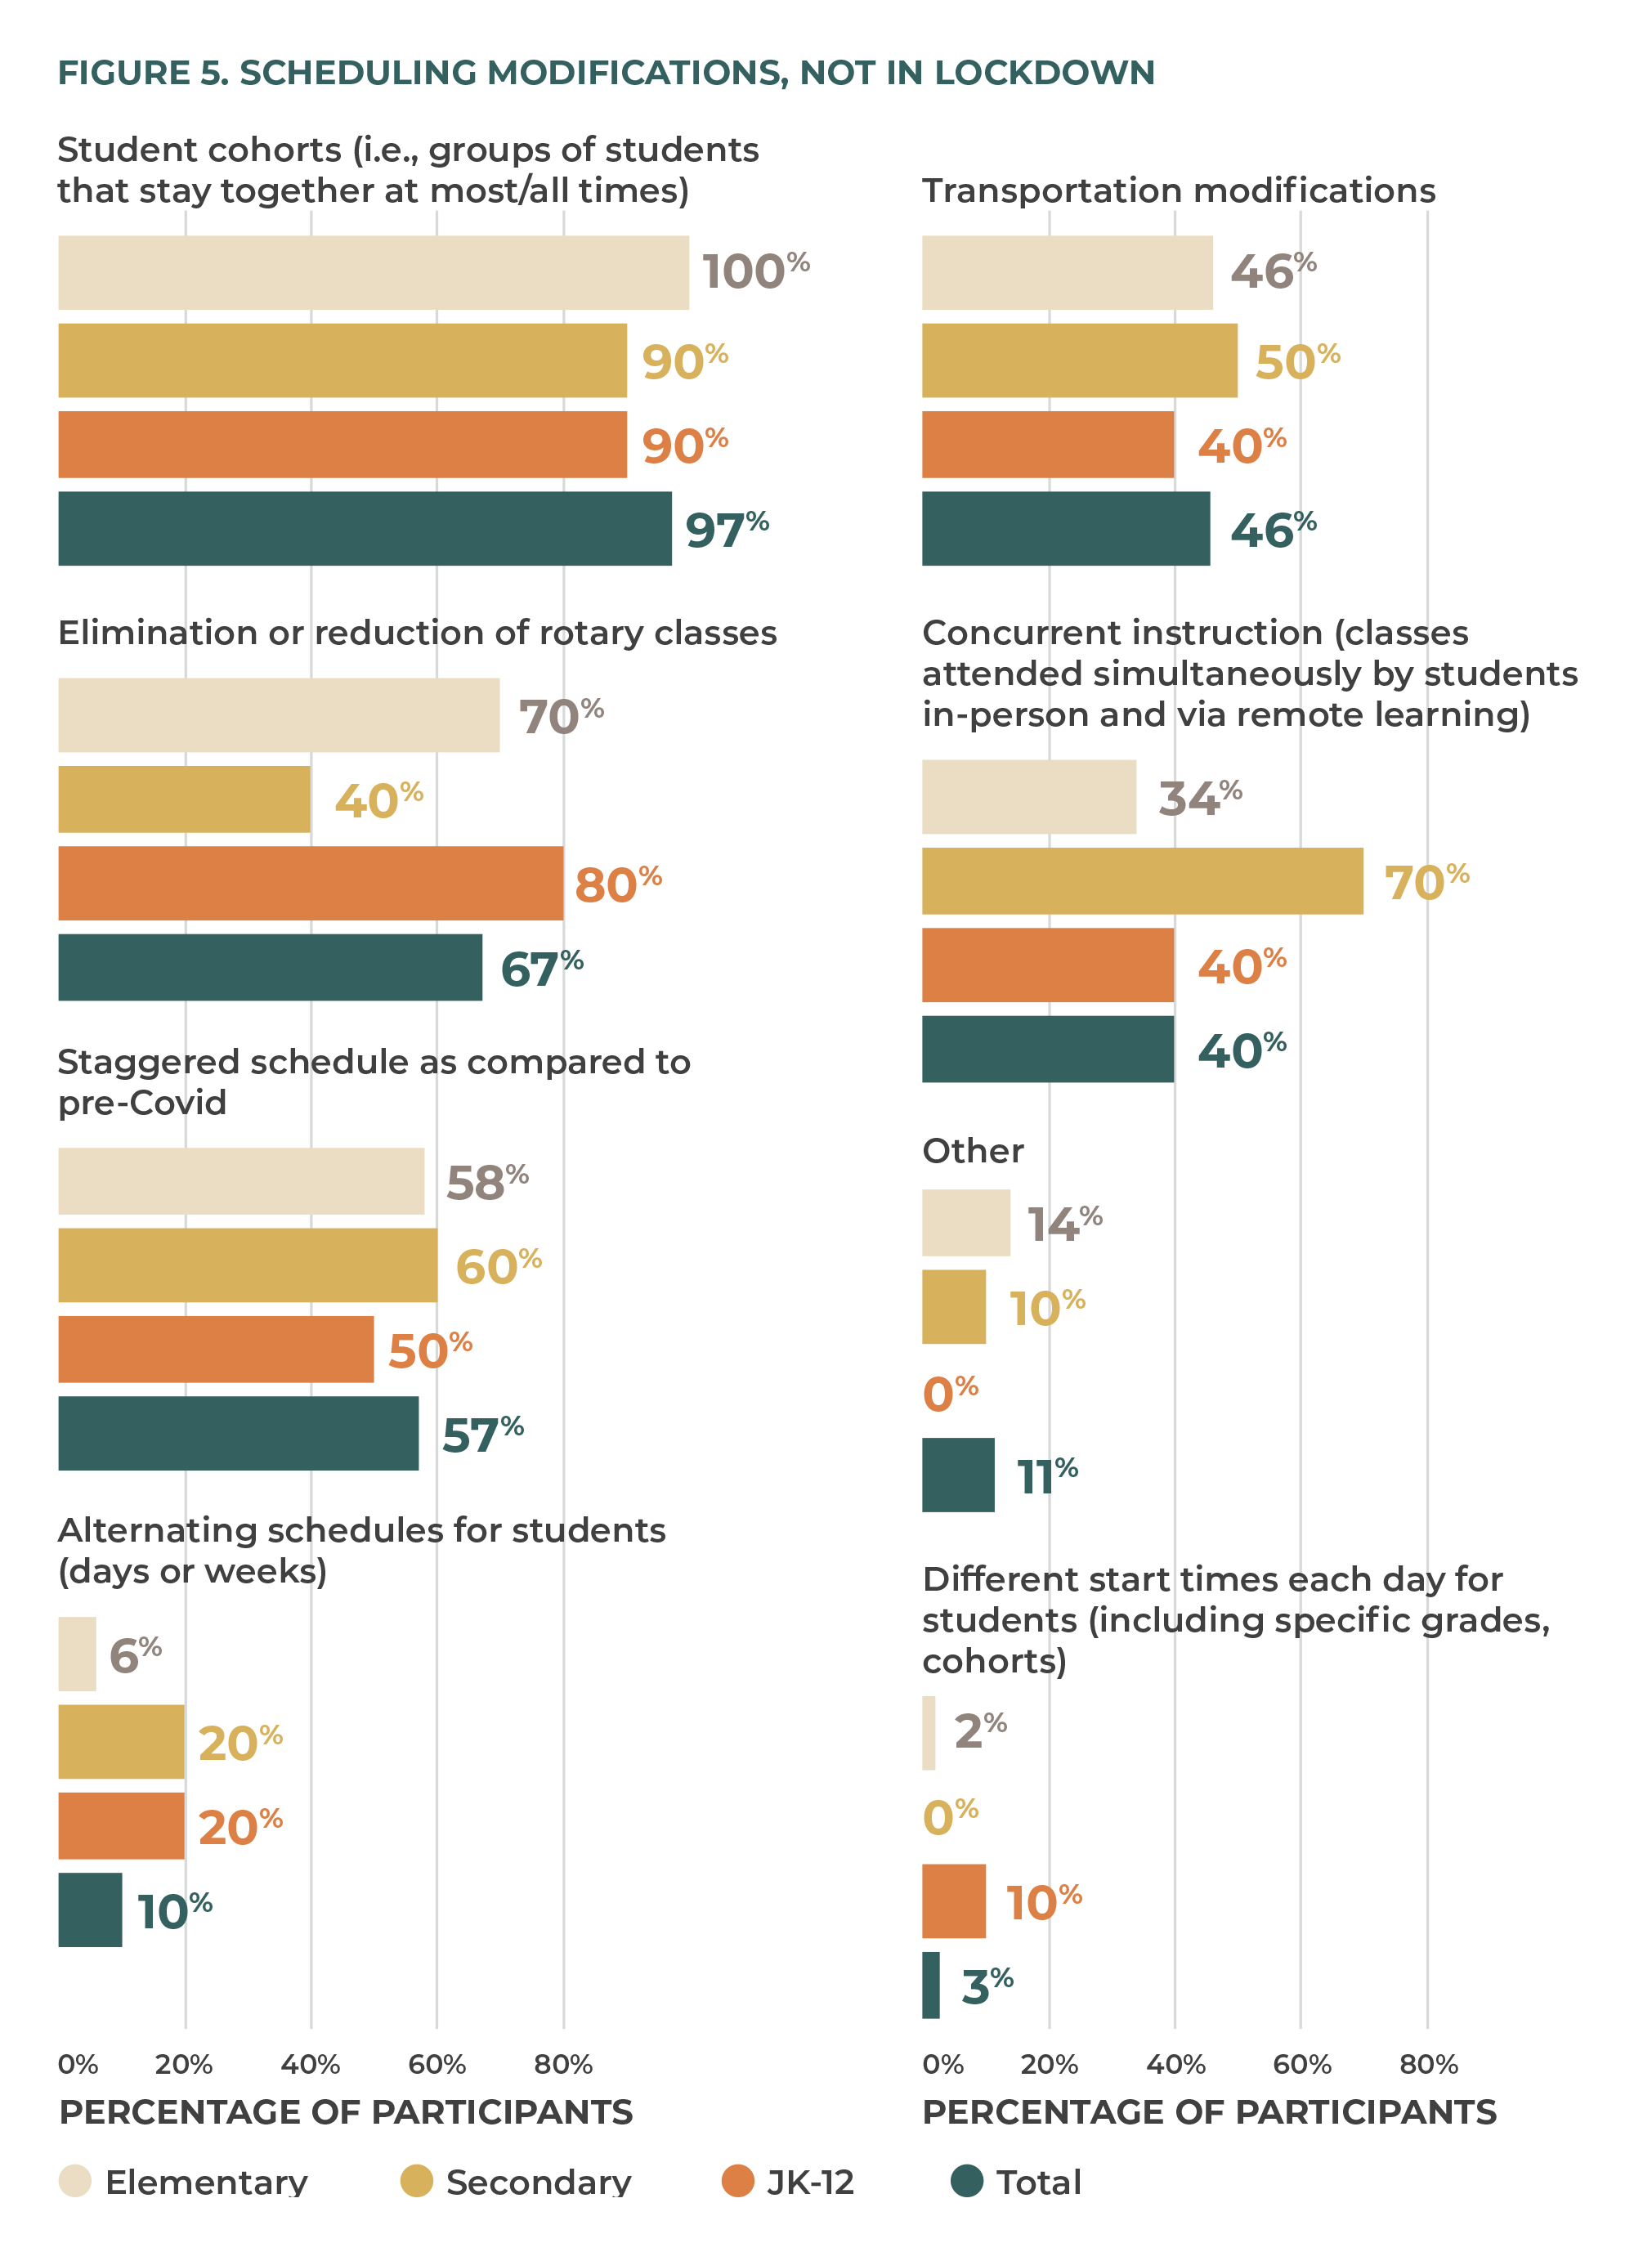
Overall, schools used a variety of techniques and approaches to improve buildings safety for their staff and students. The items outlined in the province’s re-opening plan were followed, as they were appropriate to each school, with student cohorts being utilized through almost all schools. The real story is in the “other” section, which details measures that schools took that were not listed and were outside the provincial parameters to make schools safe. List 1 demonstrates that independent schools have a nimbleness not afforded to public school boards, because independent schools can be responsive to their school culture, location, and in this case even specific COVID-19 threats on an individual school basis. It also demonstrates schools’ creativity in addressing specific problems. Provincial policy, and even policy of local school boards that apply district-wide, prevent or impede schools’ ability to make decisions that work for them but might not work for another school, even if they are located nearby.
Health and Safety When Not in Lockdown
We asked respondents to identify the precautions that they took that exceeded provincial and regional regulations. The most common additional precaution was the regular sanitization of shared materials, with 89 percent of all schools reporting this precaution (figure 6). Most schools (84 percent) asked their employees to wear personal protective equipment that exceeded provincial and regional standards. Interestingly, elementary schools were far more likely (72 percent) to reduce their class sizes than were secondary schools (50 percent) and JK–12 schools (60 percent). Although some additional health and safety precautions were not requirements for schools to implement, many schools chose to take these extra precautions.
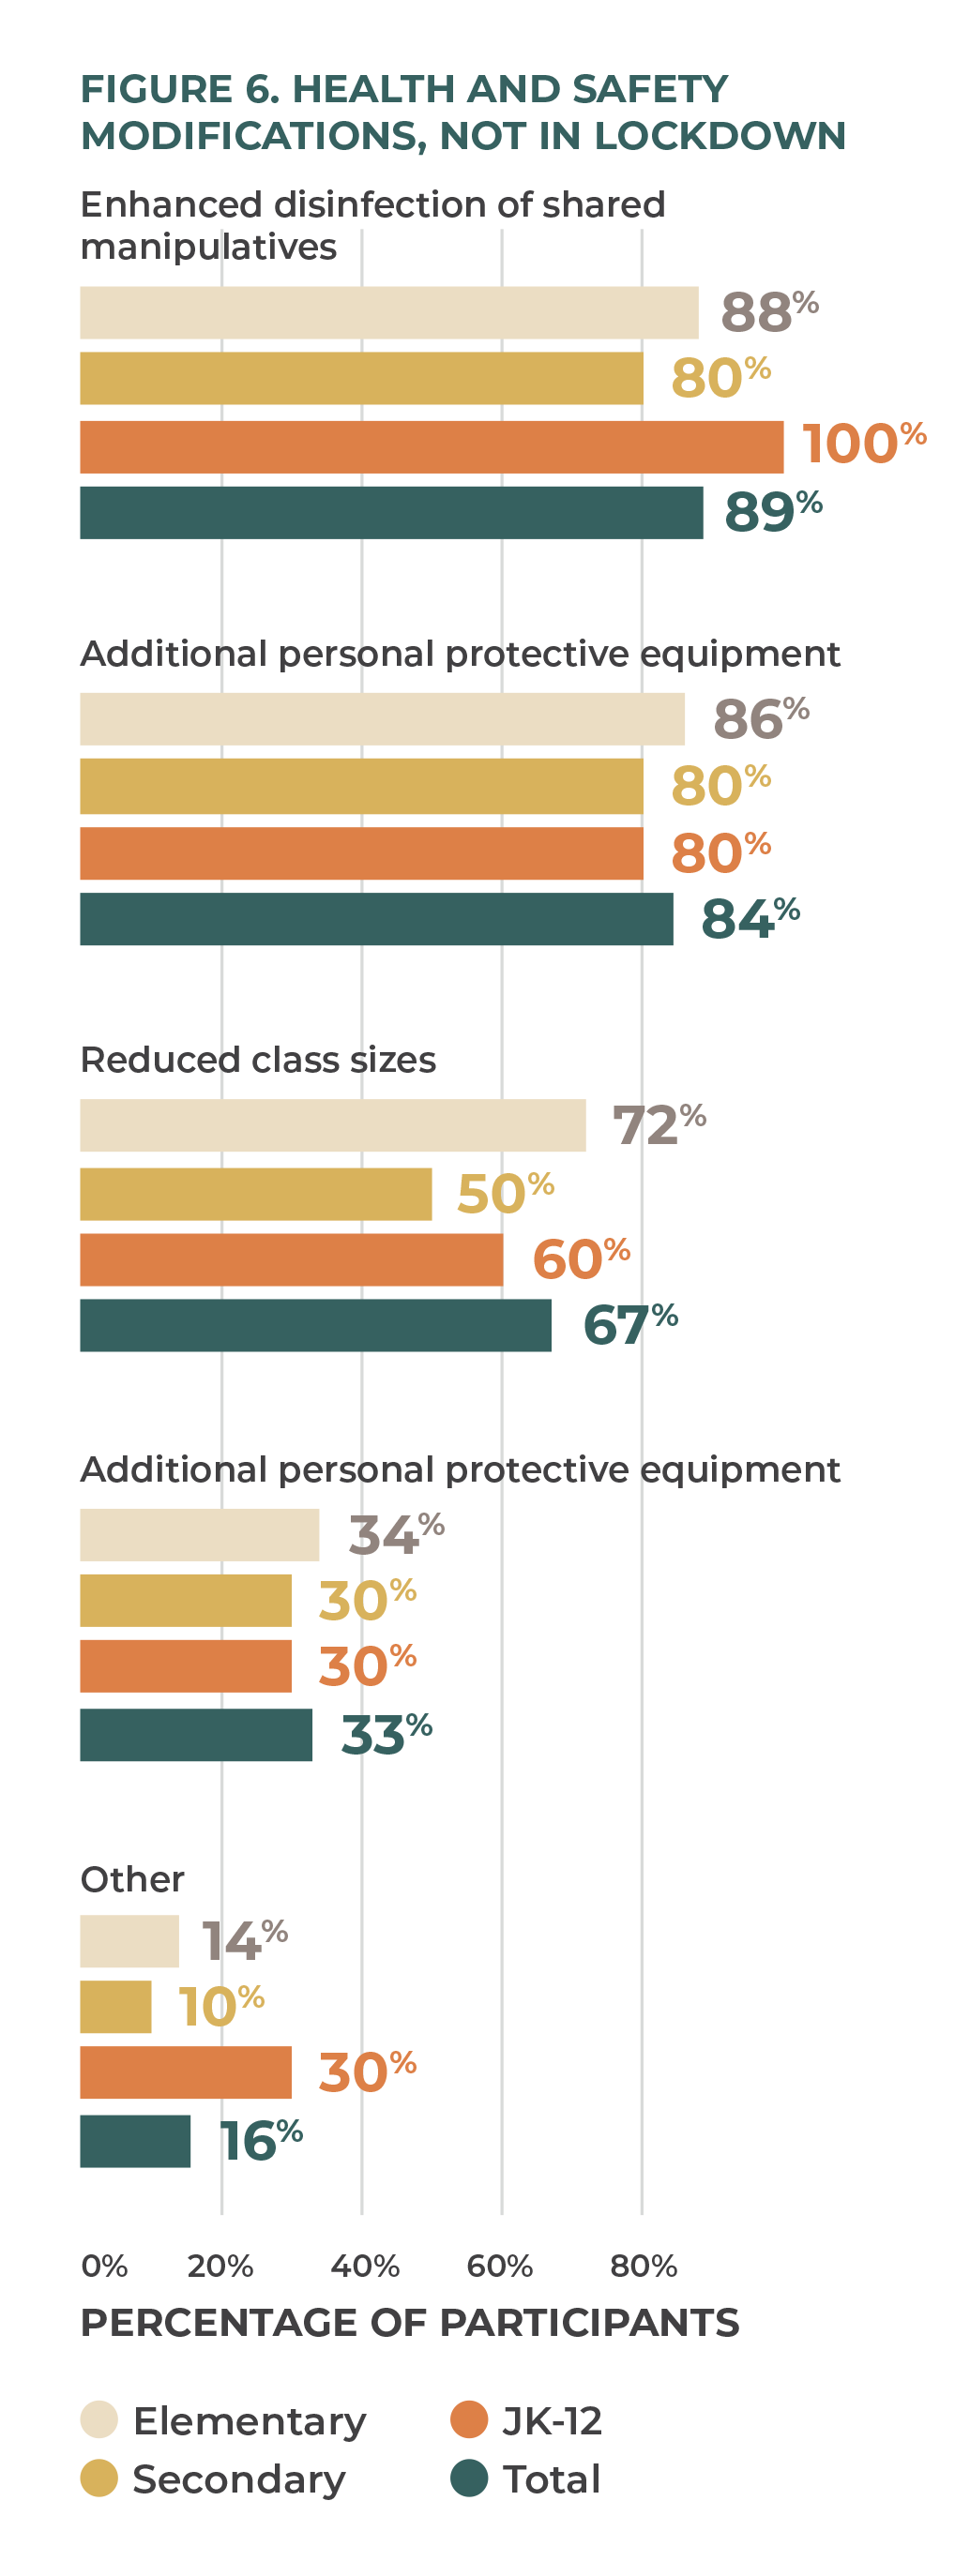
Respondents were also given the option to state other safety precautions not listed as part of the survey. These answers varied but demonstrate again the ability of individual schools to respond in a nimble, creative manner based on their needs, the resources that they had available, and the ability to reallocate funds or materials in a way that was most useful to them.
“Along with the rest of the province, our school has had to face many challenges this past year adjusting to the many COVID protocols. We worked hard as a community to focus on the silver linings. Some of the COVID-19 protocols required us to make changes that we would not have thought to do otherwise . . . and they were good changes that we will likely not change if things go back to ‘normal.’”
Space Usage When Not in Lockdown
We asked respondents to indicate space-use modifications in their buildings, by choosing from a pre-populated list. Fully 100 percent of secondary schools used designated routing of students, lunch time modifications, and modifications to group gatherings. Almost all elementary schools made changes in how a space was used (98 percent) and modified group gatherings (98 percent). All school types limited visitors to campus (figure 7).
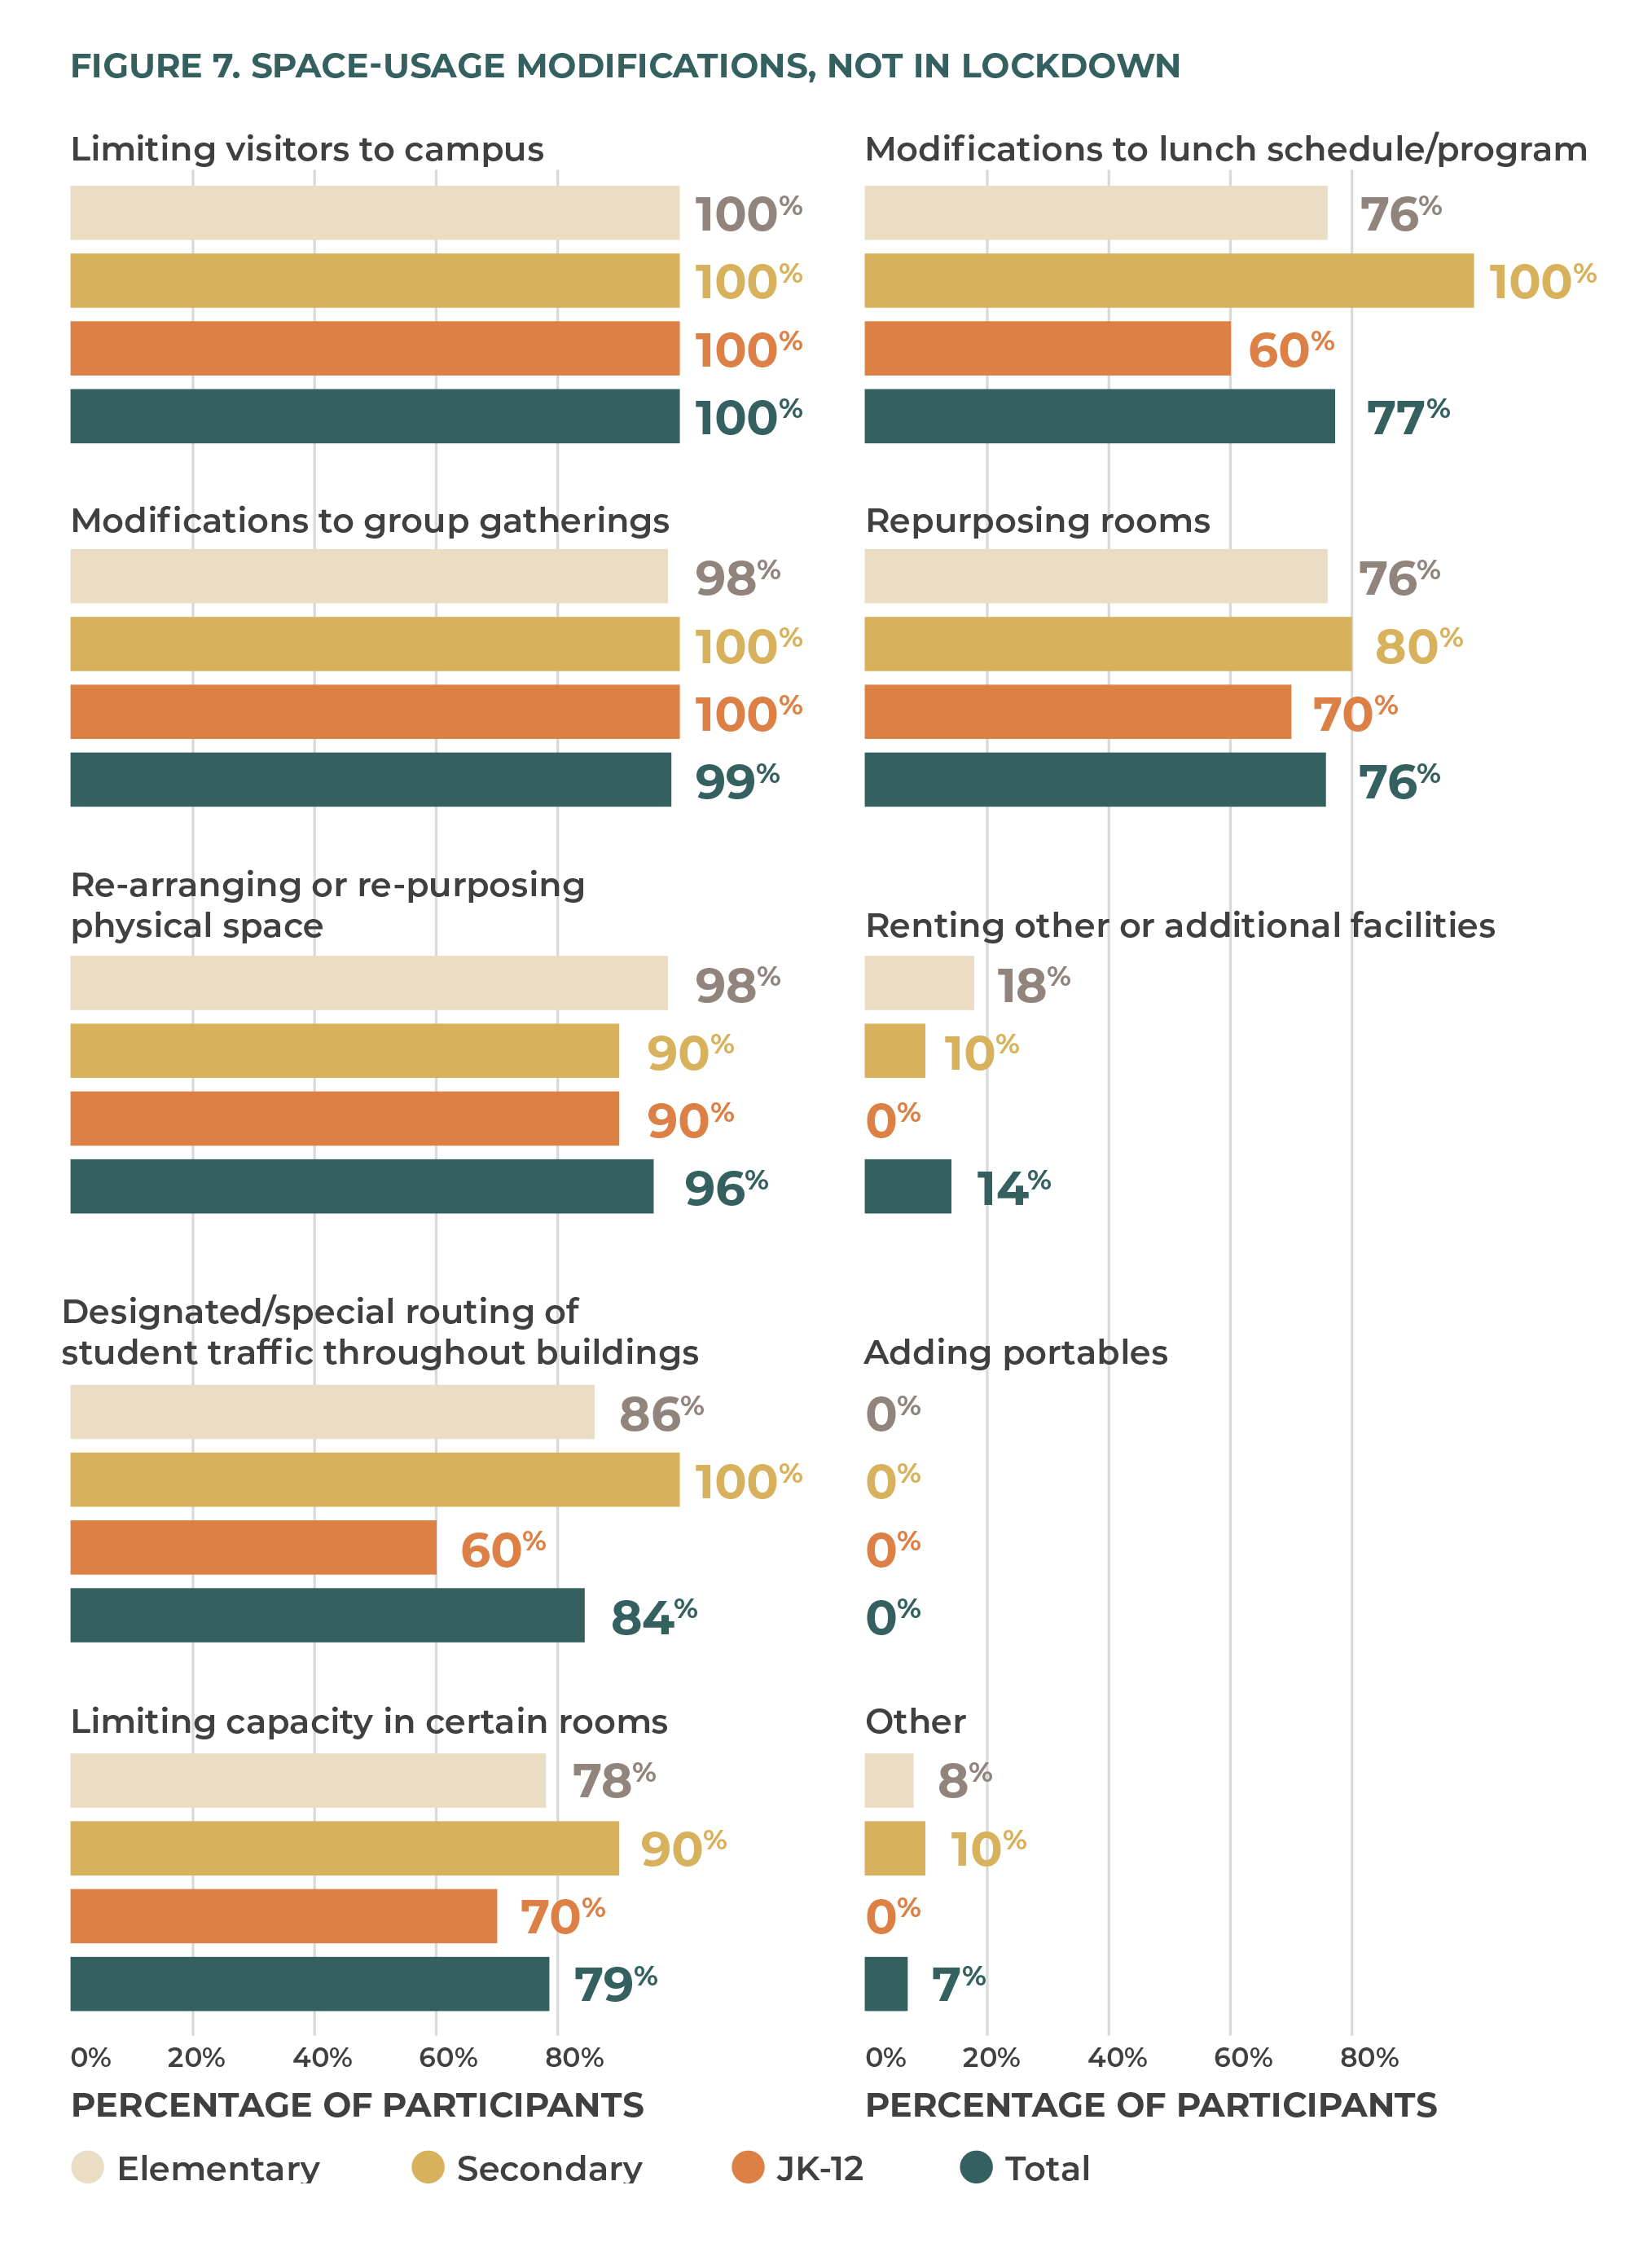
This section’s findings highlight the benefits of regional and even individual school autonomy. Survey participants were able to implement the safety protocols outlined by government officials and local public health units and also implement additional protocols to ensure that both staff and students were kept healthy. Survey participants were also able to highlight precautions that fell outside official recommendations. This list shows that schools were able to respond to the needs and culture of each specific school and, to a large extent, had the ability to allocate funds to make those adaptions.
“When our public health nurse came to do an in-person school visit, she was very happy with our school. She said we were doing everything we needed to do to stay safe and that she loved seeing how happy the children were! One of our classes made thank-you cards for her for helping our school stay safe during the pandemic and posted them on their classroom door. I brought her to the doorway of each classroom and introduced her and gave time for the students to ask questions about COVID or about our safety protocol. It was a very encouraging experience!”
Activities When Not in Lockdown
The response to the question, “How have COVID-related modifications impacted the student activities?” highlights the pandemic’s toll on extra-curricular programs. Survey participants indicated that 93 percent of schools had outdoor sports either cancelled or negatively impacted. Almost all (96 percent) had indoor sports cancelled or negatively impacted, and 91 percent had arts programs cancelled or negatively impacted. Unsurprisingly, 96 percent of schools indicated that student trips were either cancelled or negatively impacted. Community service, religious services, and student clubs were also either cancelled or negatively impacted in the majority of schools (figure 8).
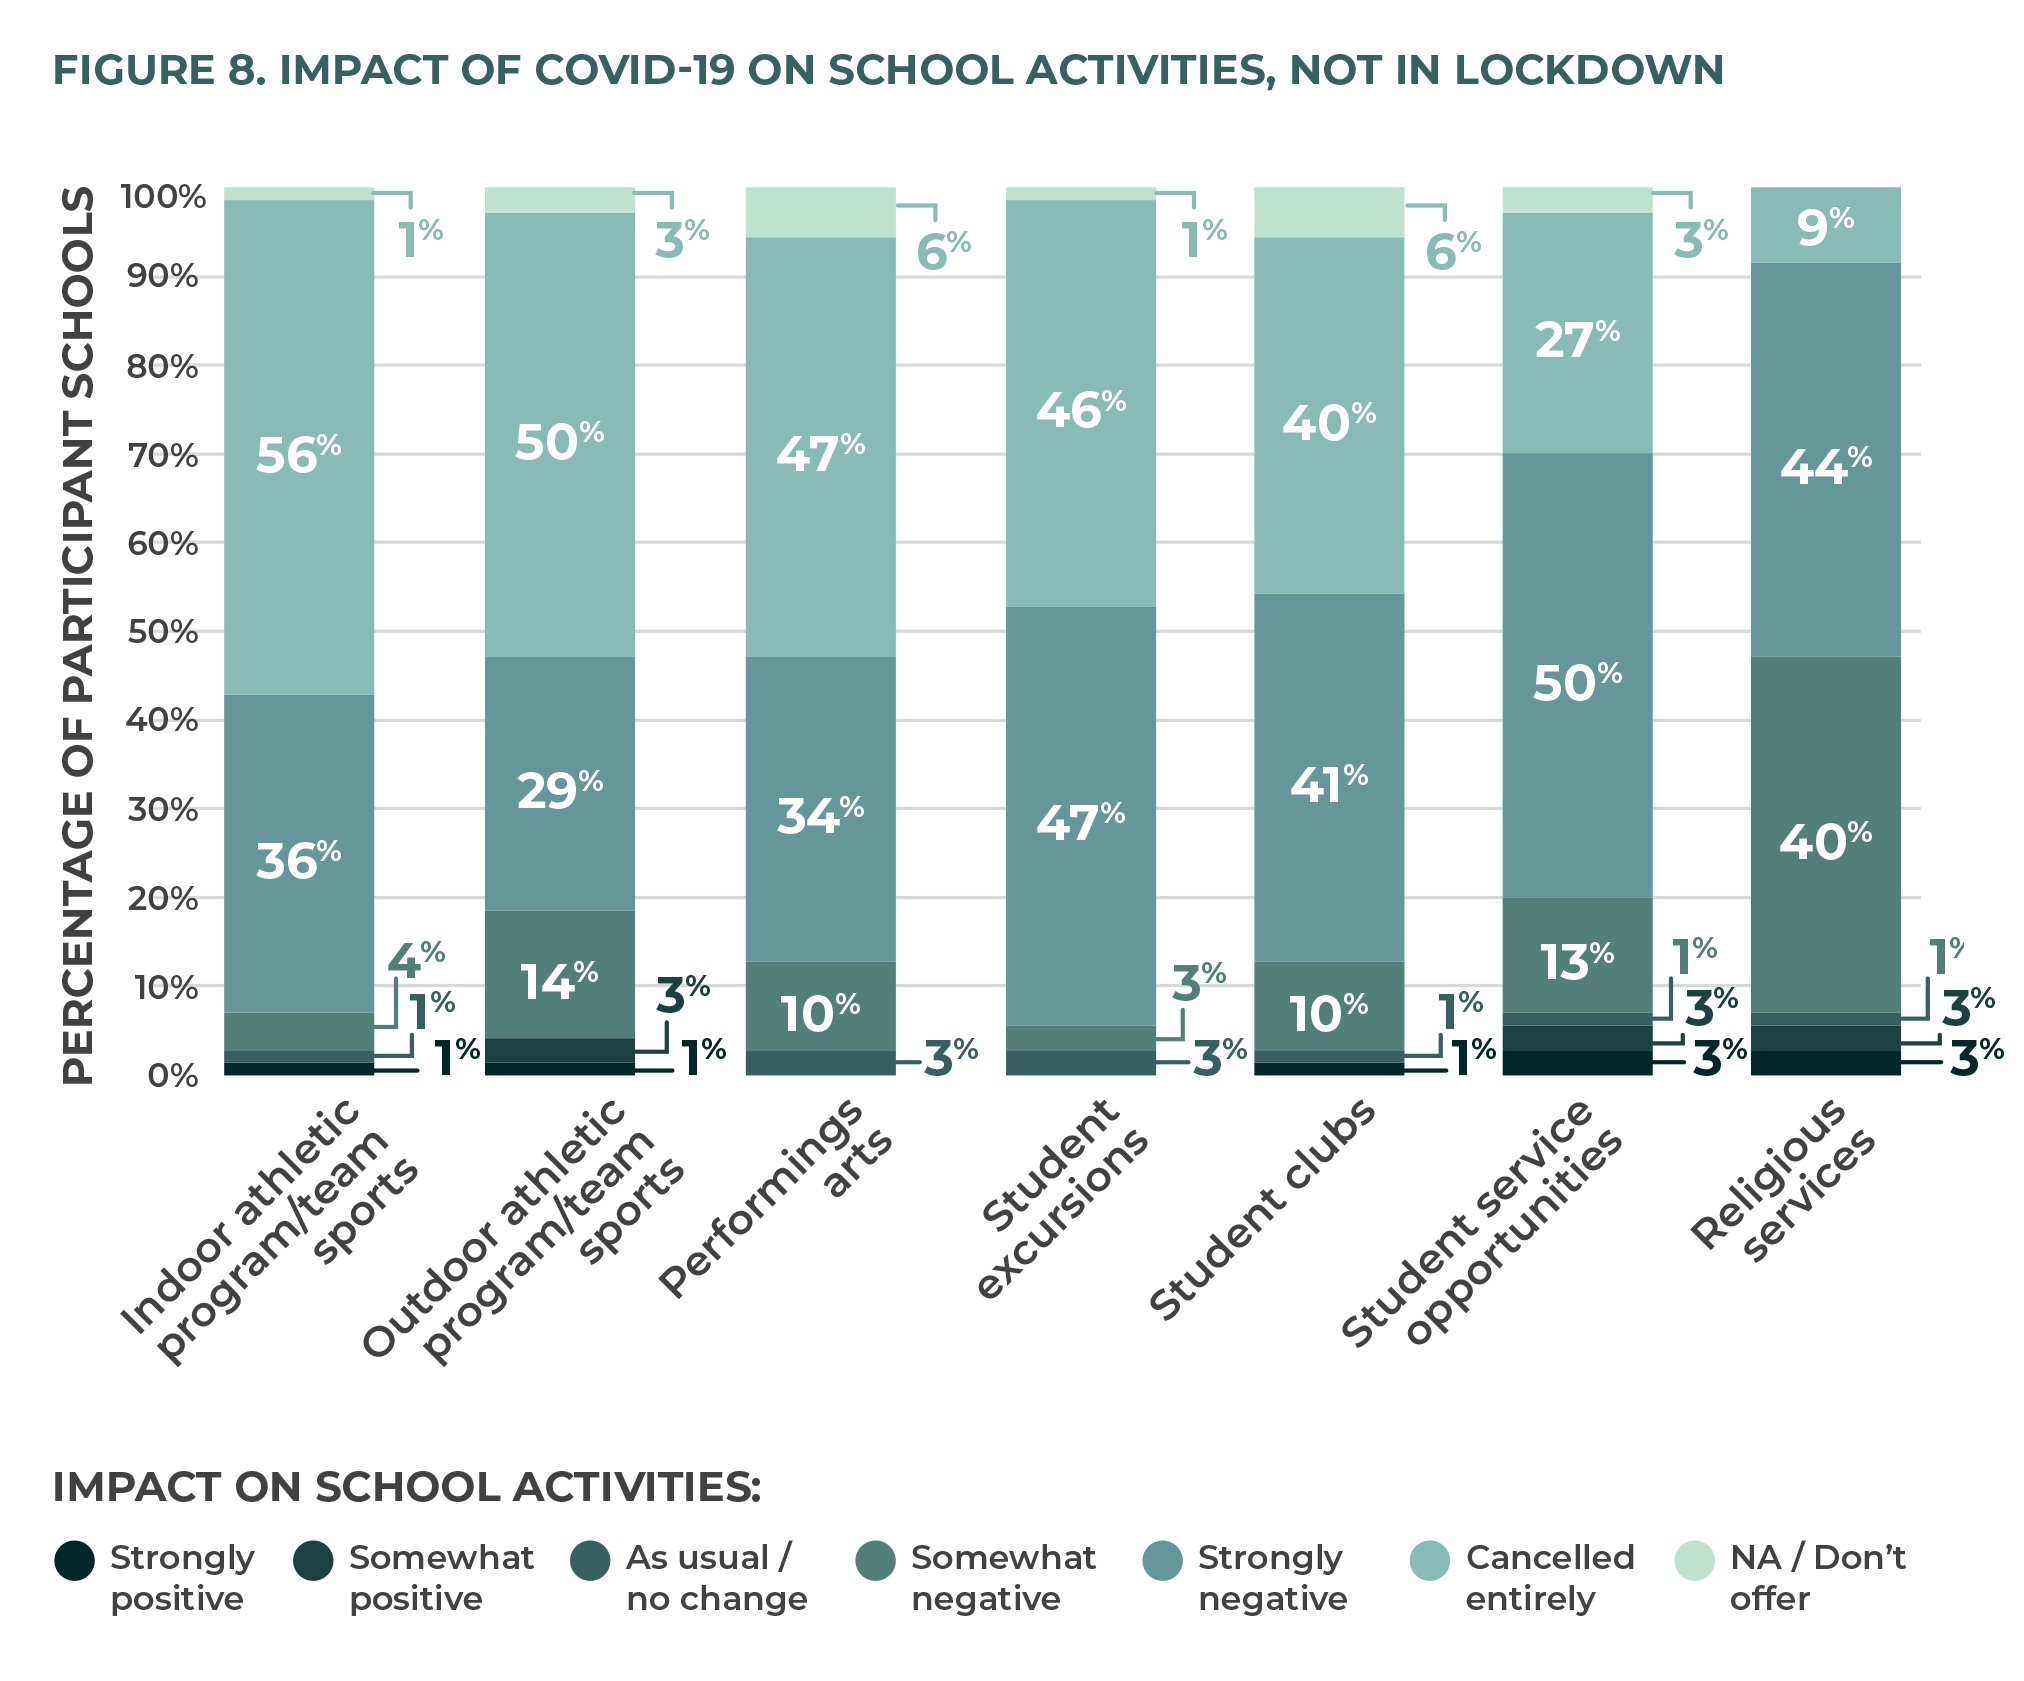
These results are not surprising, but they do pose the question, What does this mean for our students? The Ontario COVID-19 Science Advisory Table described some of the effects that school closures had on students. One of the things they noted apart from the direct impact on education was the effect that the lack of extra-curricular activities had on students. They noted:
“Data from People for Education 15 15 People for Education, “Missing Out: The Visible and Invisible Loss of Extracurricular Activities,” April 18, 2021, https://peopleforeducation.ca/our-work/missing-out-the-visible-and-invisible-loss-of-extracurricular-activities/. show the vast majority of schools offered no sports, clubs and co-curricular activities at elementary and secondary levels in 2020–21, even where in-person schooling continued, compared to 90 percent of schools offering these broader opportunities in previous years. There is a strong body of literature associating these activities with social emotional skill development, more physical activity, and higher levels of engagement in school.
“A number of pieces of evidence suggest adverse health impacts on children during COVID-19, although not directly linked to school disruption. Cross-sectional survey evidence shows a decline during the lockdowns in children’s levels of physical activity.” 16 16 Ontario COVID-19 Science Advisory Table, “COVID-19 and Education Disruption in Ontario: Emerging Evidence on Impacts,” June 4, 2021, updated June 16, 2021, https://doi.org/10.47326/ocsat.2021.02.34.1.0.
Graduation
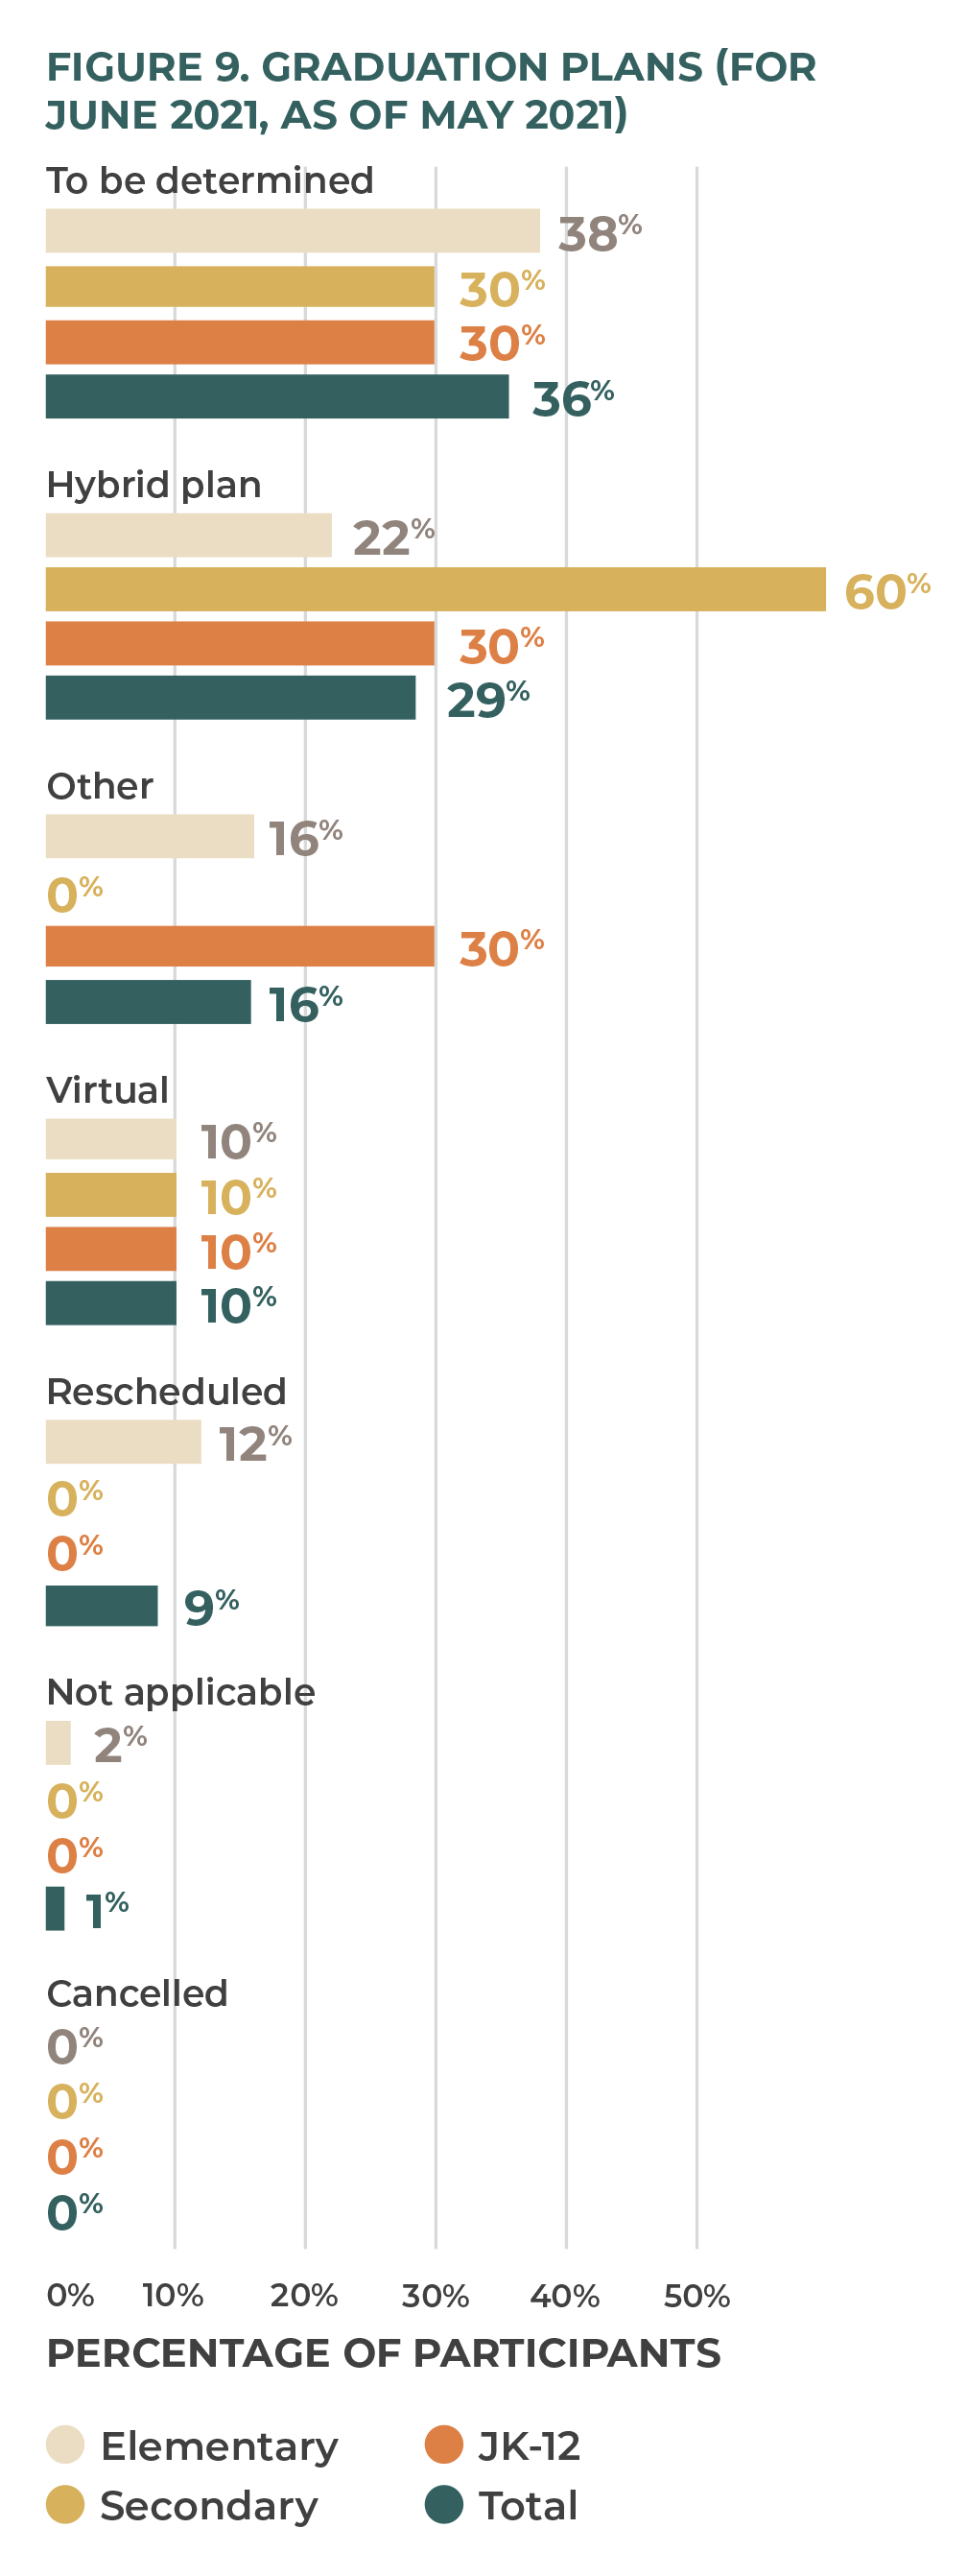
When respondents were asked about graduation plans, 60 percent of secondary schools indicated that they had a hybrid plan for graduation, with 10 percent of elementary, secondary, and JK–12 schools going completely virtual (figure 9). Many schools indicated that they had not finalized plans for graduation at the time of the survey. It is important to note that this survey was completed before the province indicated that in-person graduations would be permitted. When this news was announced, many schools shifted to some form of outdoor, in-person graduation plan. Variations of plans are due to the specific requirements of local public health units. This is another example of how local autonomy and a human-scale education system provides for diversity and adaptability, which allows schools to respond to their unique situation and school culture.
Remote Learning
Subject Areas Offered
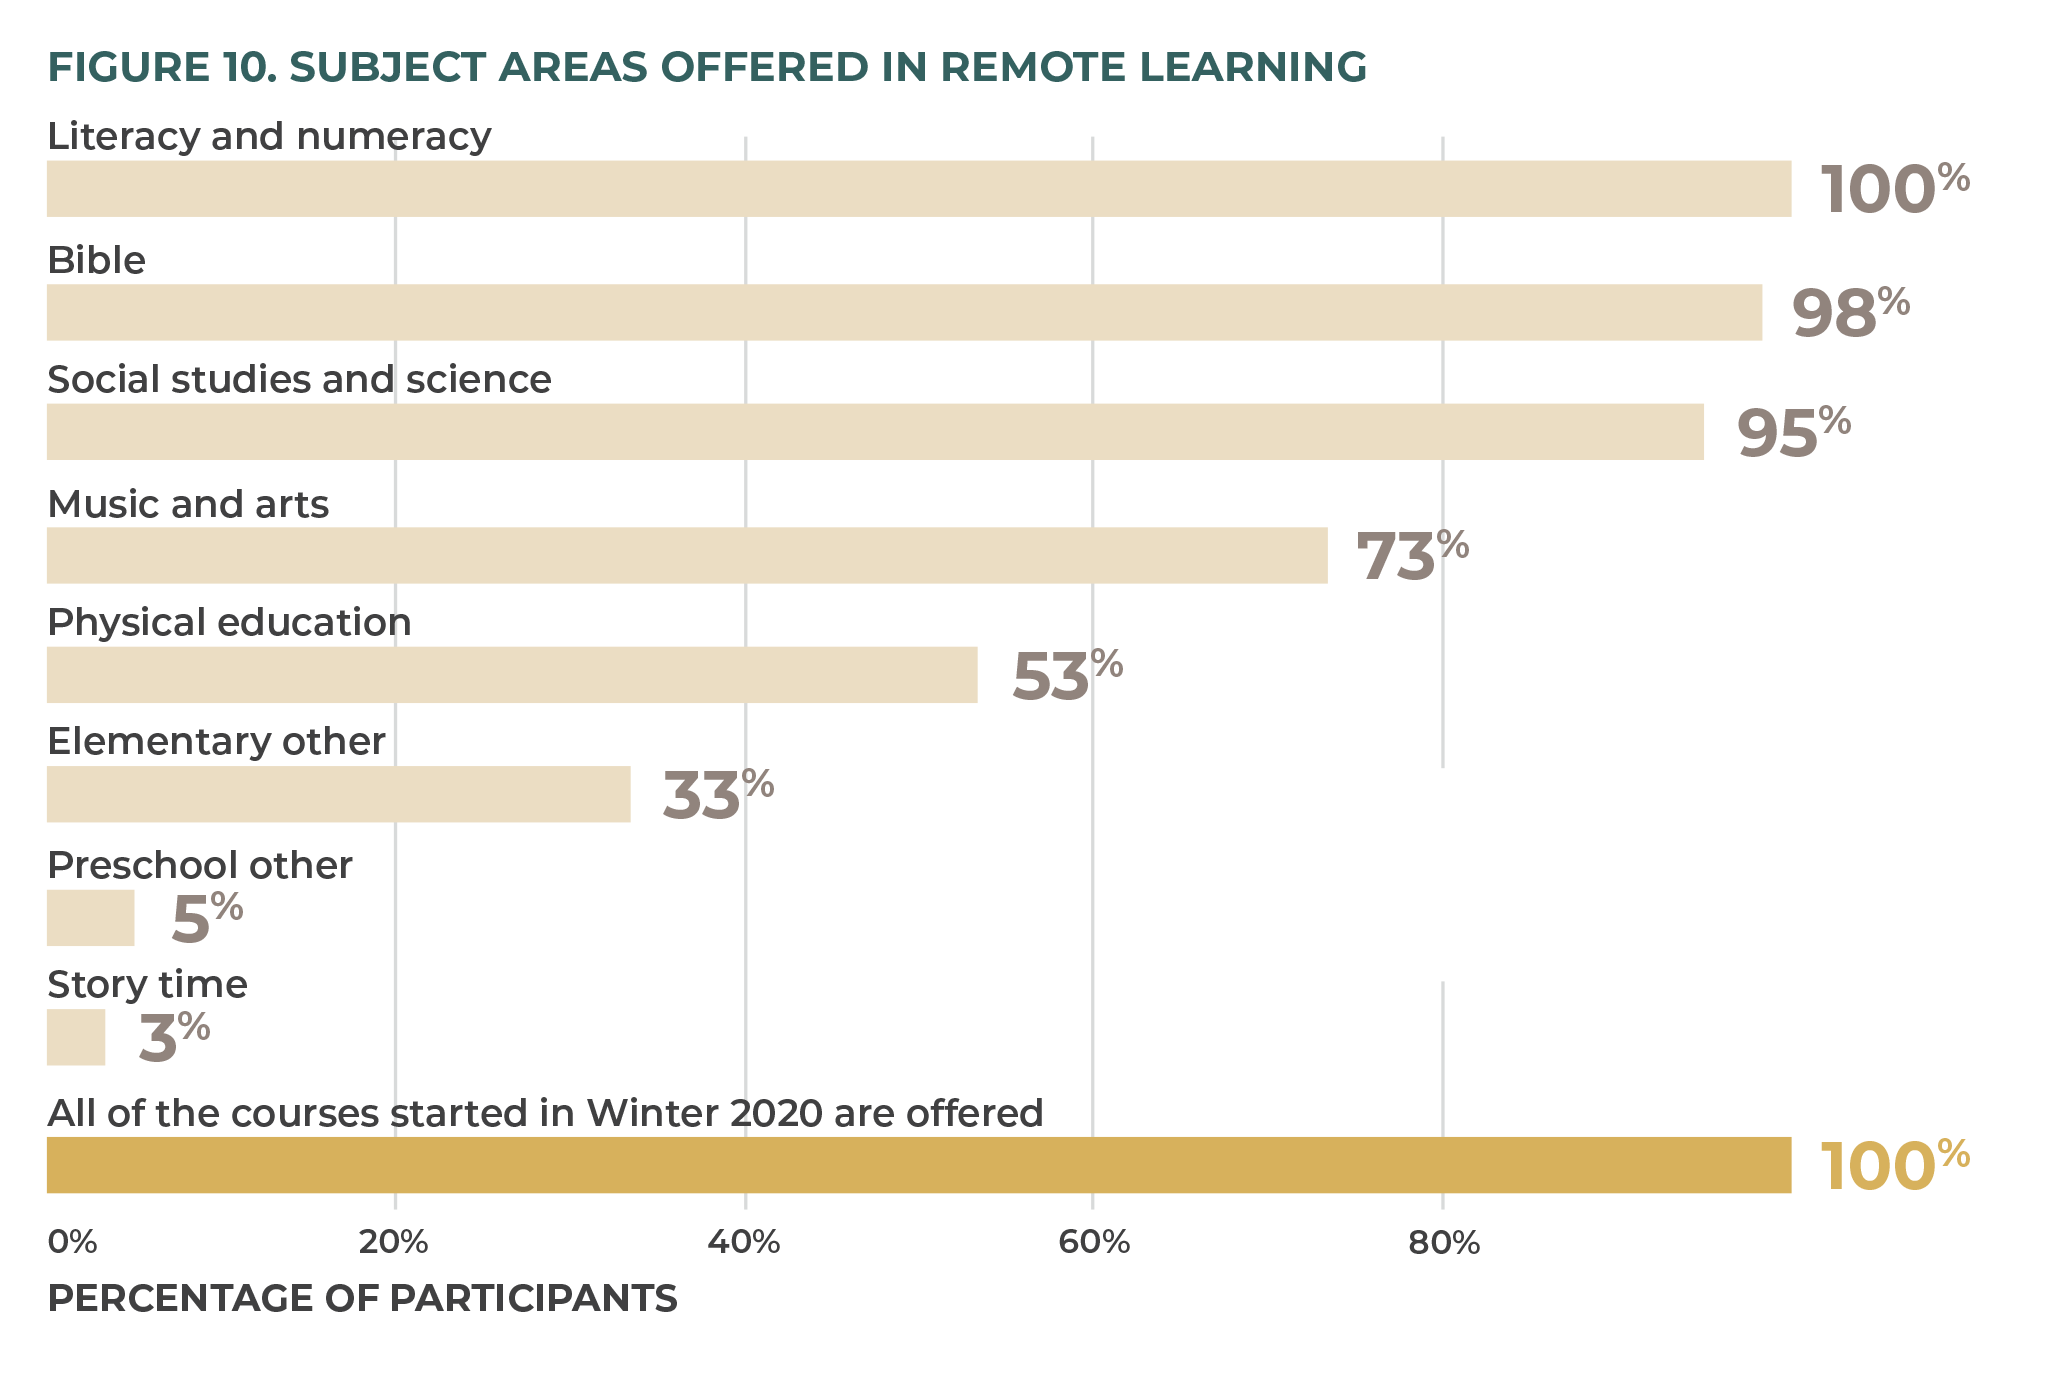
Survey participants were asked to indicate what impact remote learning had on their academic program offerings. Secondary schools reported that they were able to offer 100 percent of their program. Elementary schools focused on numeracy and literacy (100 percent), Bible (98 percent), and social studies and science (95 percent). Most elementary schools reported offering music and the arts (73 percent), while approximately half (53 percent) continued with physical education (figure 10). Given the opportunity to comment further on other courses, subjects, and activities offered at the elementary-school level, schools reported courses in computer, media, health, and French, morning meetings, closing circles, and more. In all, learning included more than literacy and numeracy.
“COVID and the three lockdowns revealed that our staff can adapt and pivot with the best of them and our school gained a deeper reputation for quality in our community. COVID also [gave] our board a deeper sense of how hard our staff work throughout the crisis.”
Remote Learning Tools
Respondents were asked to choose, from a pre-populated list, which learning tools they used during remote learning. Video conferencing was the most popular tool, with 100 percent of JK–SK (senior kindergarten), grades 1–3, and secondary students using it. Grades 4–6 had a 95 percent usage, and grades 7–8 had a 98 percent usage. Secondary schools were the largest group to use an online learning management system (LMS), with 90 percent of respondents indicating that they had such a program in place. Elementary schools took a staggered approach, with a 41 percent LMS usage rate for JK–SK, a 64 percent usage rate for grades 1–3, a 90 percent usage rate for grades 4–6, and a 95 percent usage rate for grades 7–8. Fully 93 percent or more of all age groups, except preschool, used some type of synchronous class meetings (table 2). The number of schools using synchronous learning did not change much between the spring of 2020 and the spring of 2021.
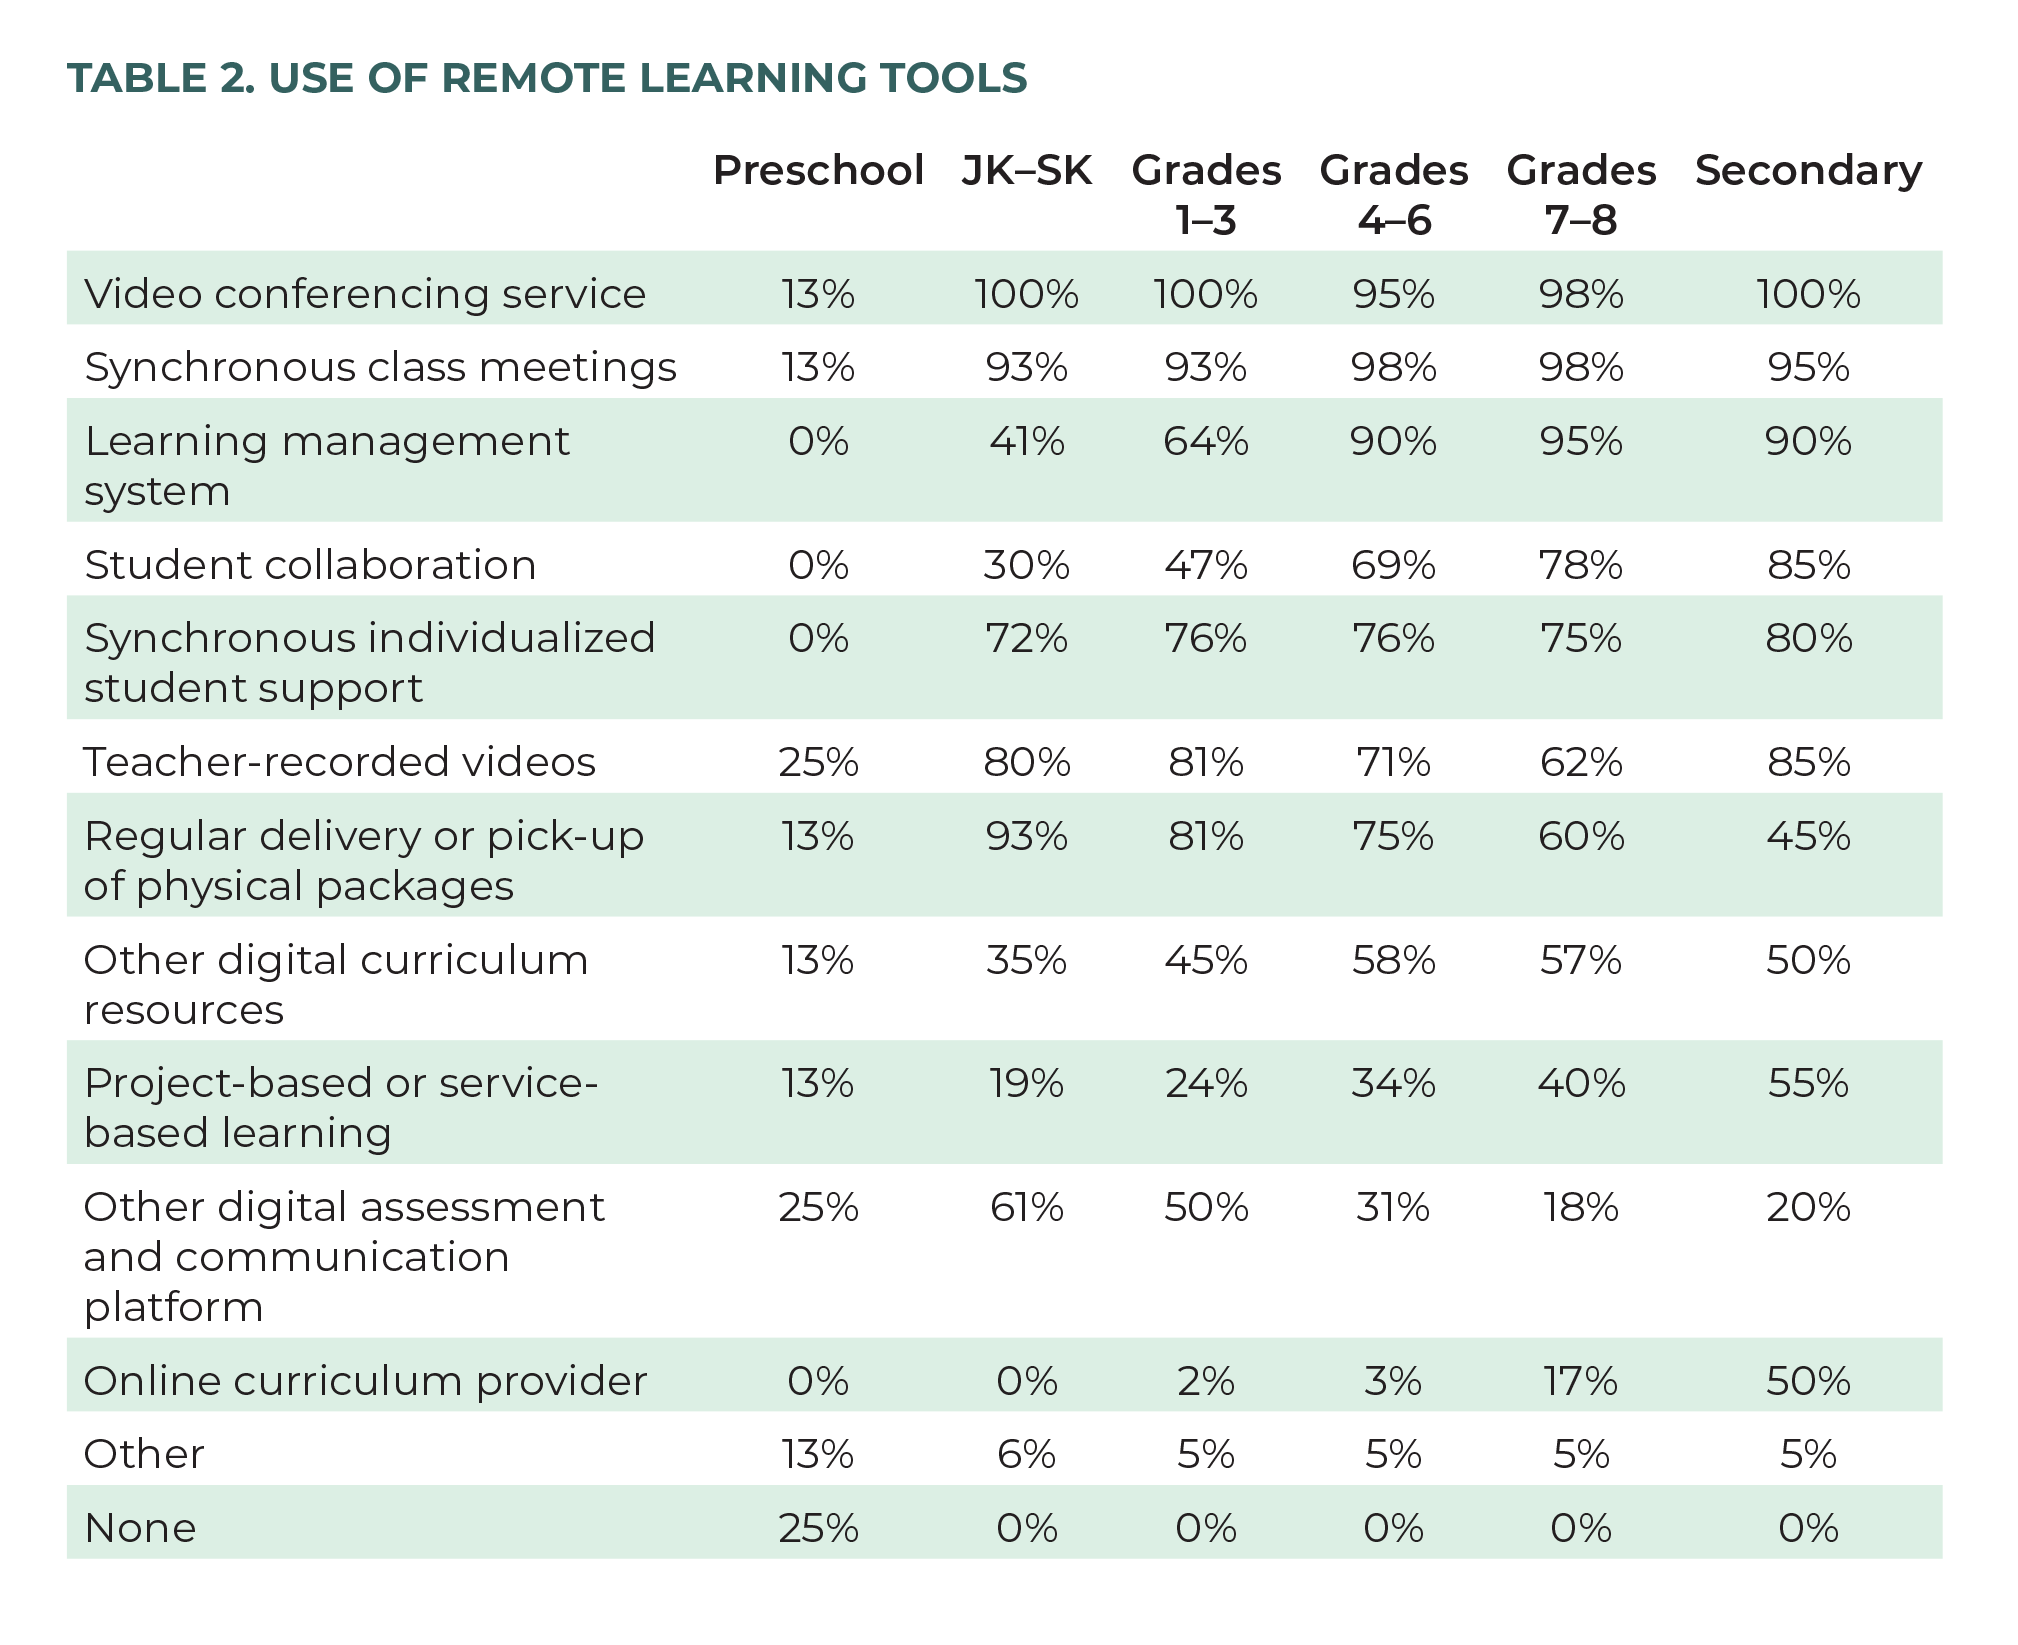
Notably, many schools provided regular physical packages of learning materials for their students. This service declined in frequency the higher the grade and thus was most frequent in JK–SK, for which 93 percent of schools reported providing this, followed by 81 percent for grades 1–3 and 75 percent for grades 4–6.
Synchronous Learning
To determine how many hours of synchronous learning schools engaged in with their students, respondents were asked to choose from a list of hour increments, broken into grade divisions. There was much variation among grade levels. Generally speaking, as students got older, they were engaged in more hours of synchronous learning per day. This is shown mostly plainly in figure 11, 17 17 Note: Preschool is not included in figure 11. Fully 100% of preschool students at respondent schools experienced less than one hour per day of synchronous learning when remote. where one-quarter of schools (25 percent) reported four to five hours for the grades 7–8 students, while only 6 percent of schools reported four to five hours in grades 1–3. It is interesting to note, however, that this pattern drops off dramatically at the secondary school level, where the majority of schools (52 percent) reported between one and three hours.
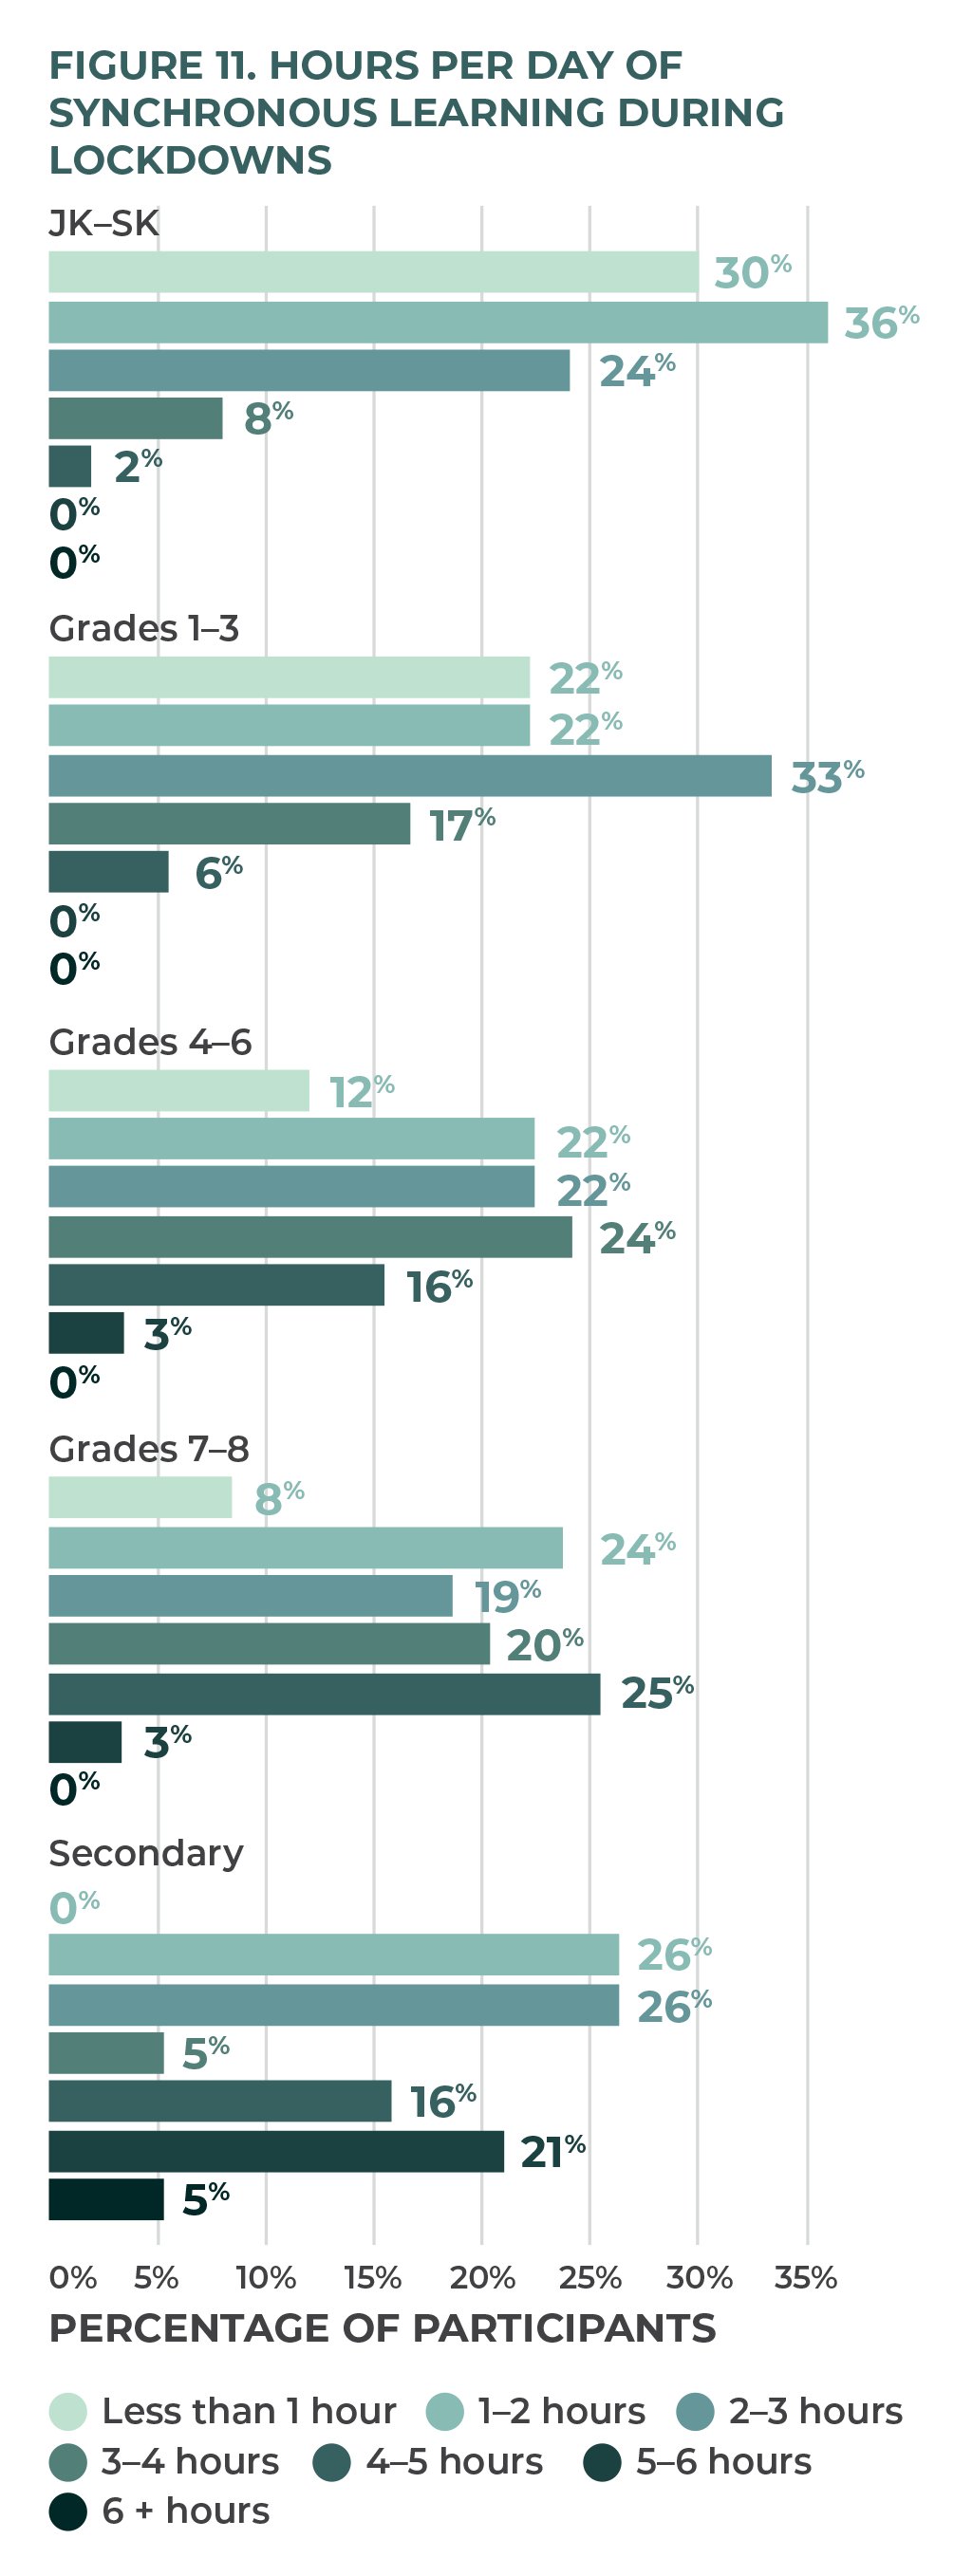
The public system mandated 225 minutes of online learning a day, regardless of age, grade, or perceived ability to work independently. 18 18 Ontario Ministry of Education, “Policy/Program Memorandum No. 164,” August 13, 2020, http://www.edu.gov.on.ca/extra/eng/ppm/164.html. Independent schools tried to respond to concerns about screen time, attention span of younger students, and their school culture. This may account for the wide variability in the amount of synchronous learning.
Student Support Services
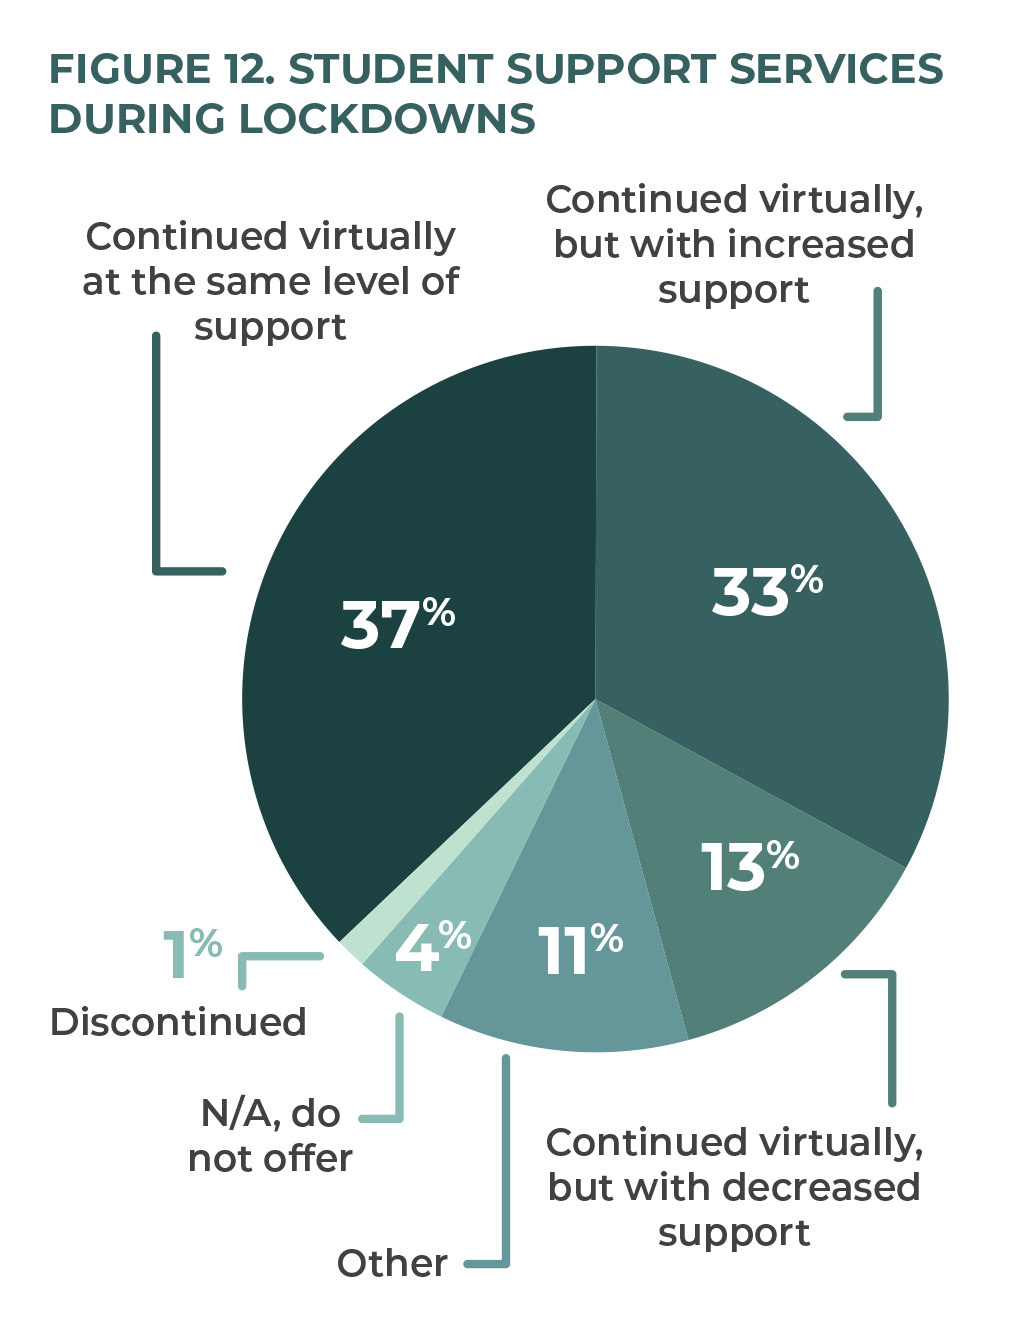
Schools were permitted to “provide in-person instruction to pupils with special education needs who cannot be accommodated through remote learning.” 19 19 Government of Ontario, “Reopening Ontario (A Flexible Response to COVID-19) Act, 2020, Ontario Regulation 278/21,” April 14, 2021, https://www.ontario.ca/laws/regulation/r21278. Schools used discretion regarding which students would be able to access in-person support versus other methods of support. For students who required specialized support and were unable to receive in-person assistance, we asked schools to choose how they continued these services. Over one-third of schools (37 percent) responded that support services were continuing virtually at the same level of support, while another third (33 percent) responded that these support services were continuing virtually but with an increased level of support. A minority of schools responded that their support decreased (13 percent) or discontinued (1 percent) (figure 12).
Schools were also asked to report if they offered in-person student support services during lockdowns. Over three-quarters (76 percent) of schools did so, with 79 percent and 80 percent of elementary-only and secondary-only schools, respectively, offering this service (figure 13). Fully 421 students with support services in responding schools received in-person support while schools were closed during lockdowns.
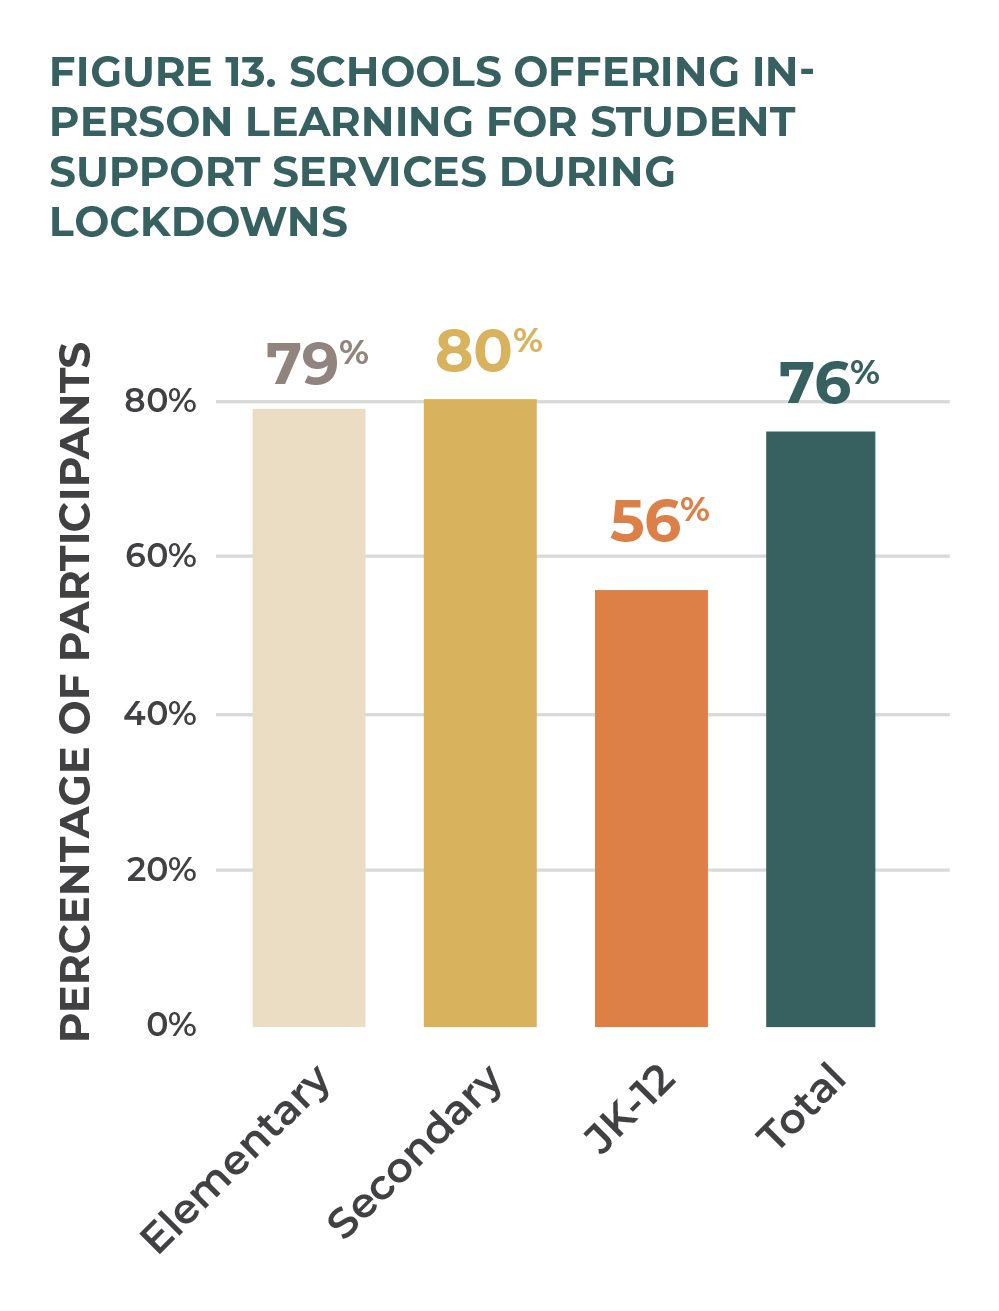
We know anecdotally that although in-person support was promised by the Minister of Education, local school boards indicated that they could not find staff to come in and fill these positions, leaving parents and students with limited options for continuing their education during lockdown periods.
Community Connection
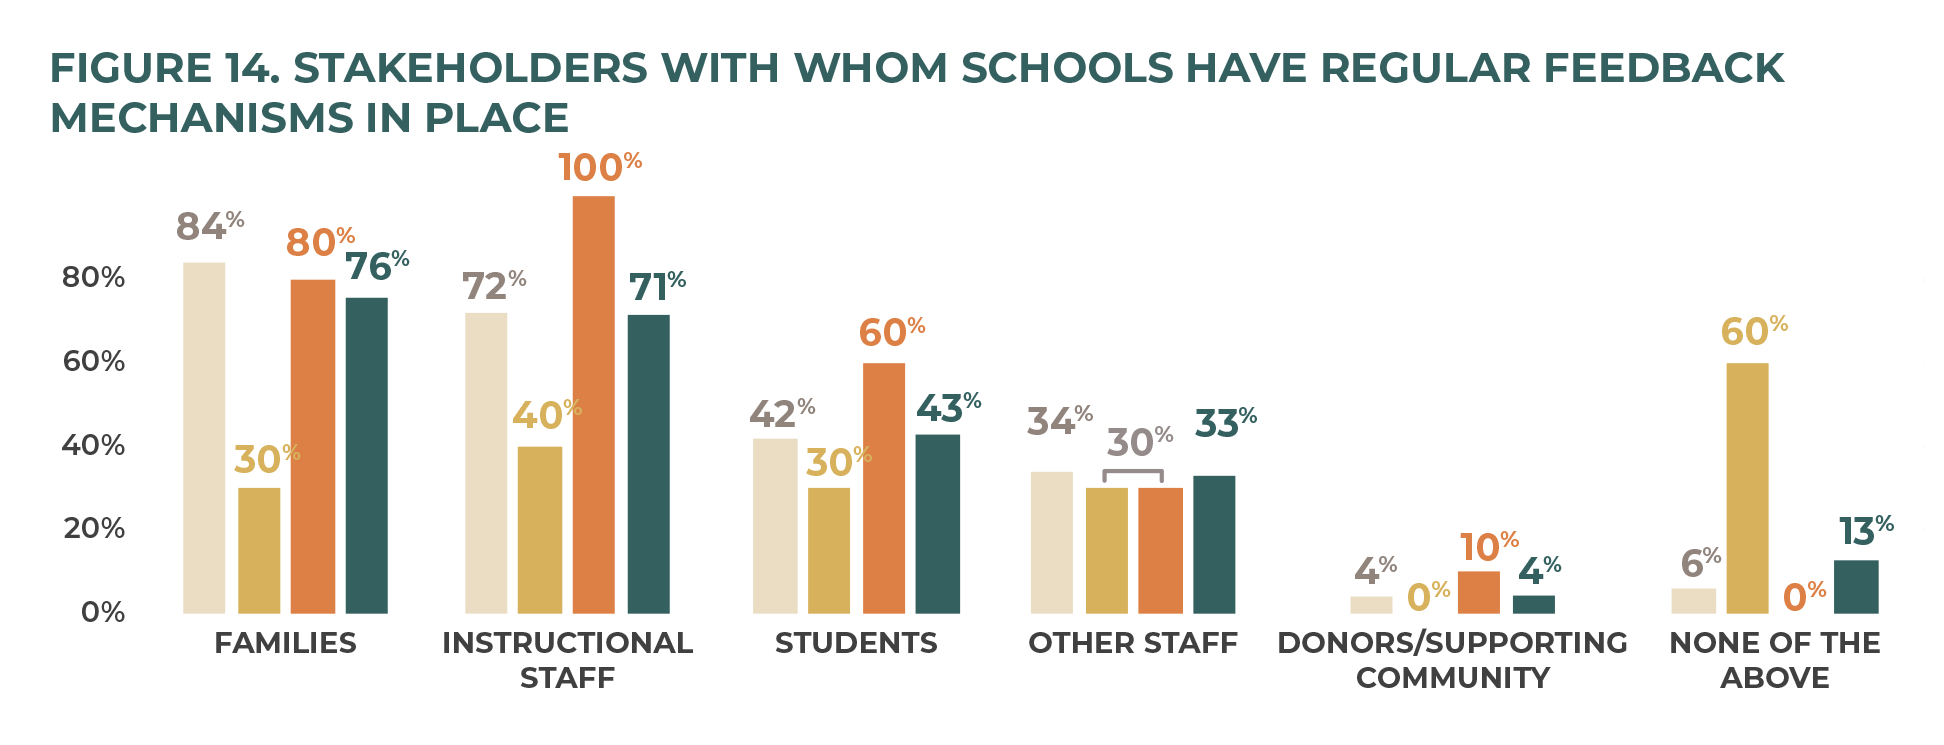
When asked about what types of regular feedback mechanisms the schools put in place for a variety of stakeholders, elementary and JK–12 schools were far more likely to have some kind of system in place. Sixty percent of secondary schools reported having none of the listed feedback mechanisms in place. Elementary schools and JK–12 schools prioritized feedback mechanisms for families (84 percent and 80 percent, respectively) and instructional staff (72 percent and 100 percent, respectively). They were less likely to have feedback mechanisms in place for “other staff” and “donors/supporting community” (figure 14).
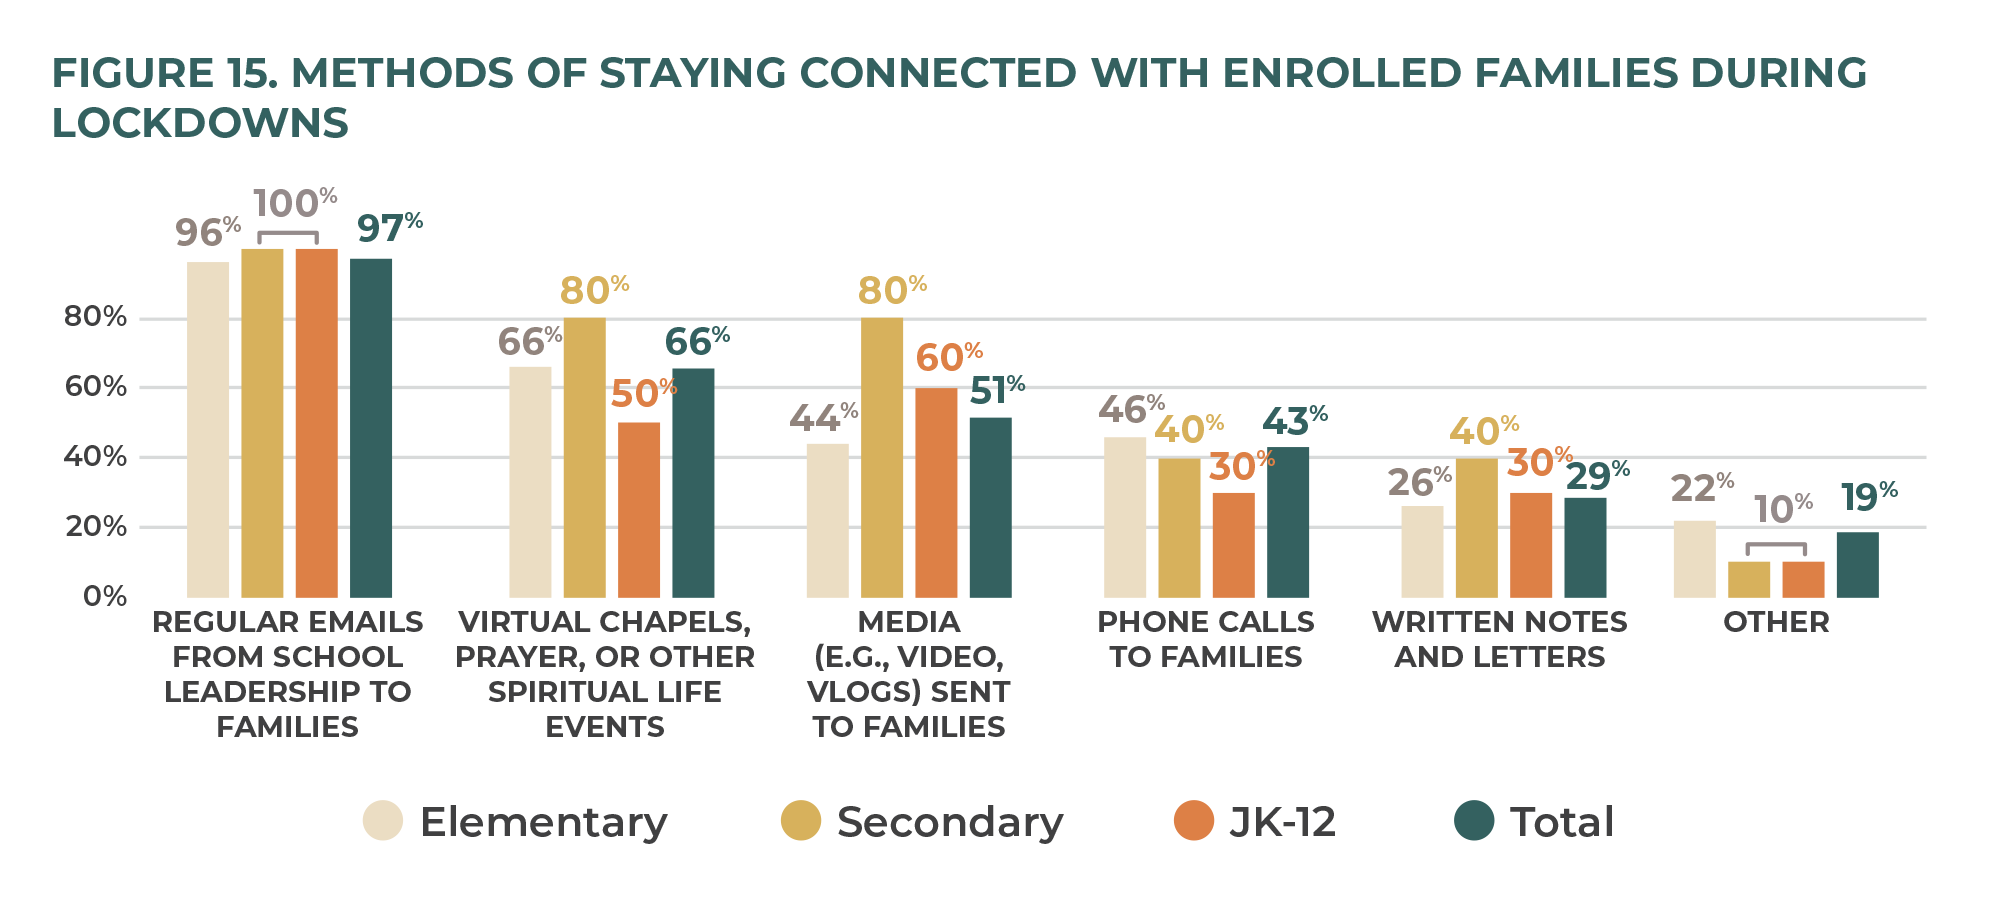
We asked survey participants how they stayed connected to their school community. Fully 100 percent of secondary and JK–12 schools used regular email from school leadership, and 96 percent of elementary schools did so (figure 15). Other ways that schools stayed connected were virtual chapels, phone calls to families, and social media. In addition to the list that the survey provided, respondents described other ways that they stayed in touch with the school community. The variety of methods enabled them to communicate in ways that made sense for their school population, student base, and school culture. It also allowed schools to provide real-time updates as they responded to changes in government requirements, even as these changes happened on a daily basis.
Tuition
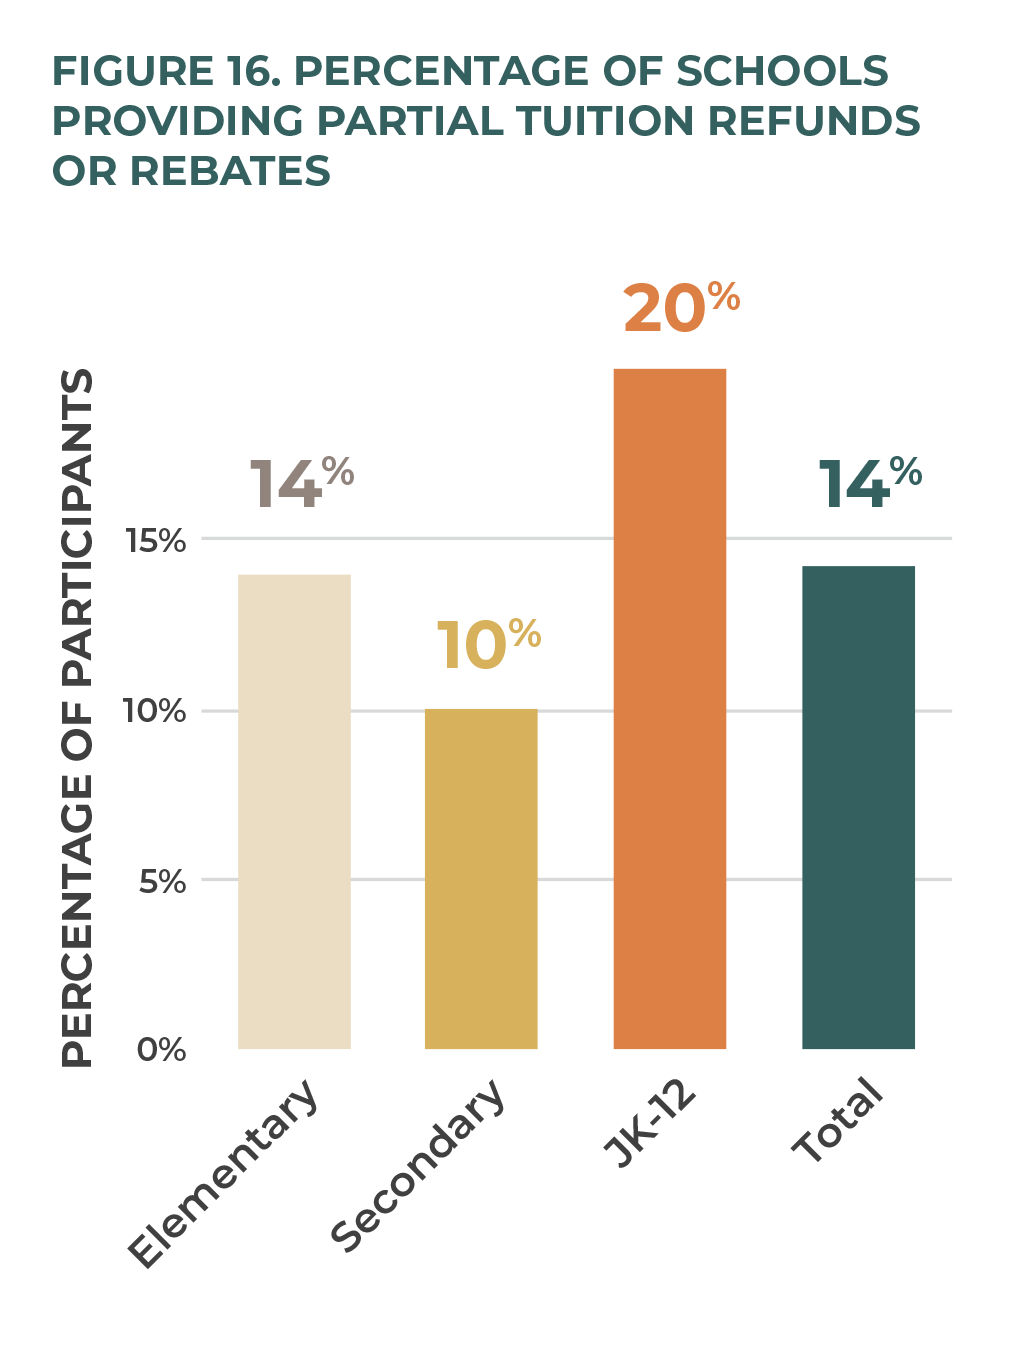
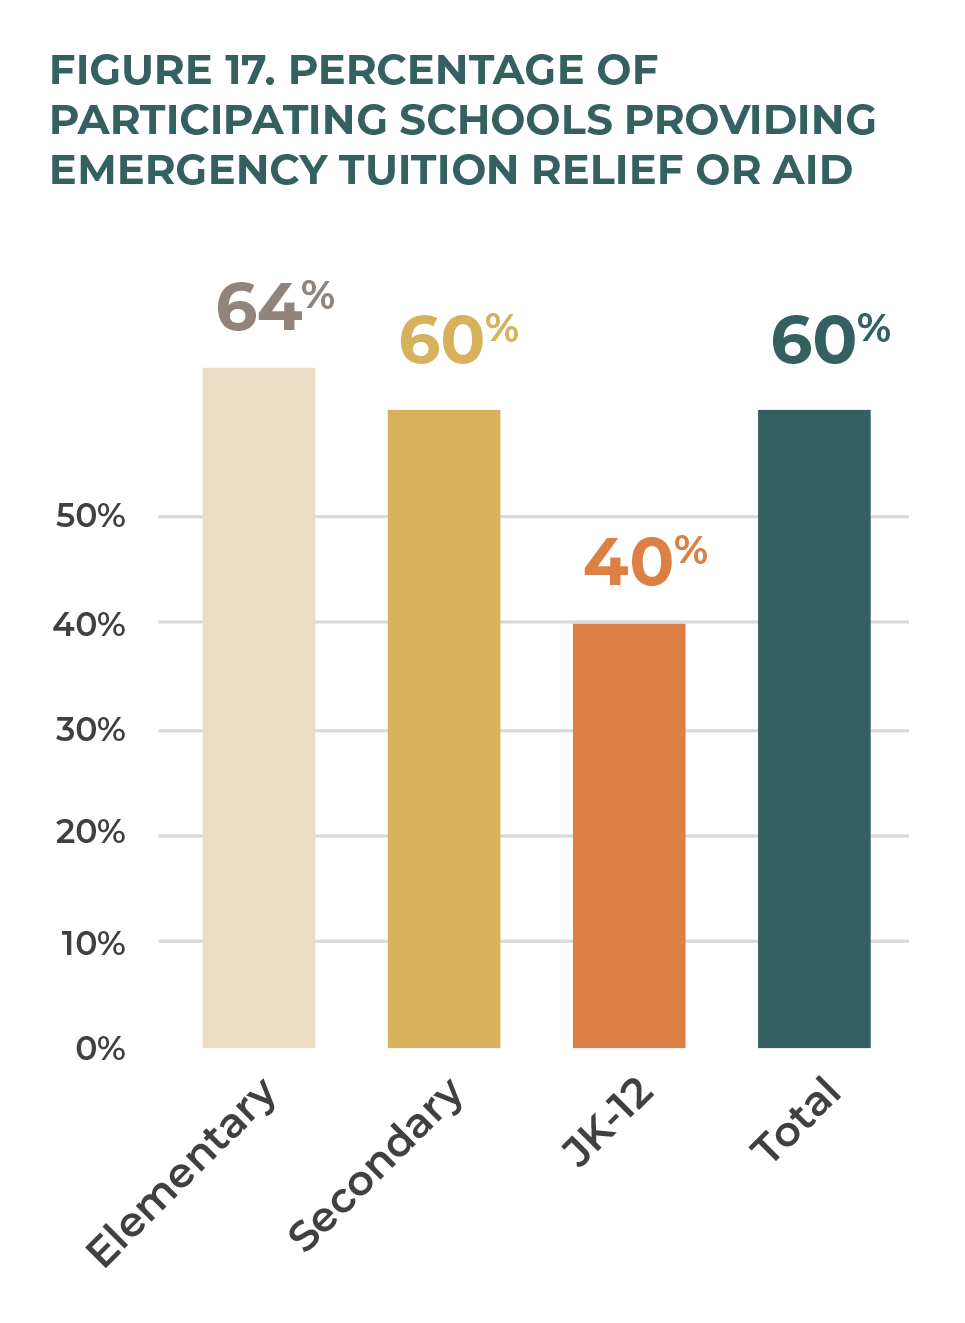
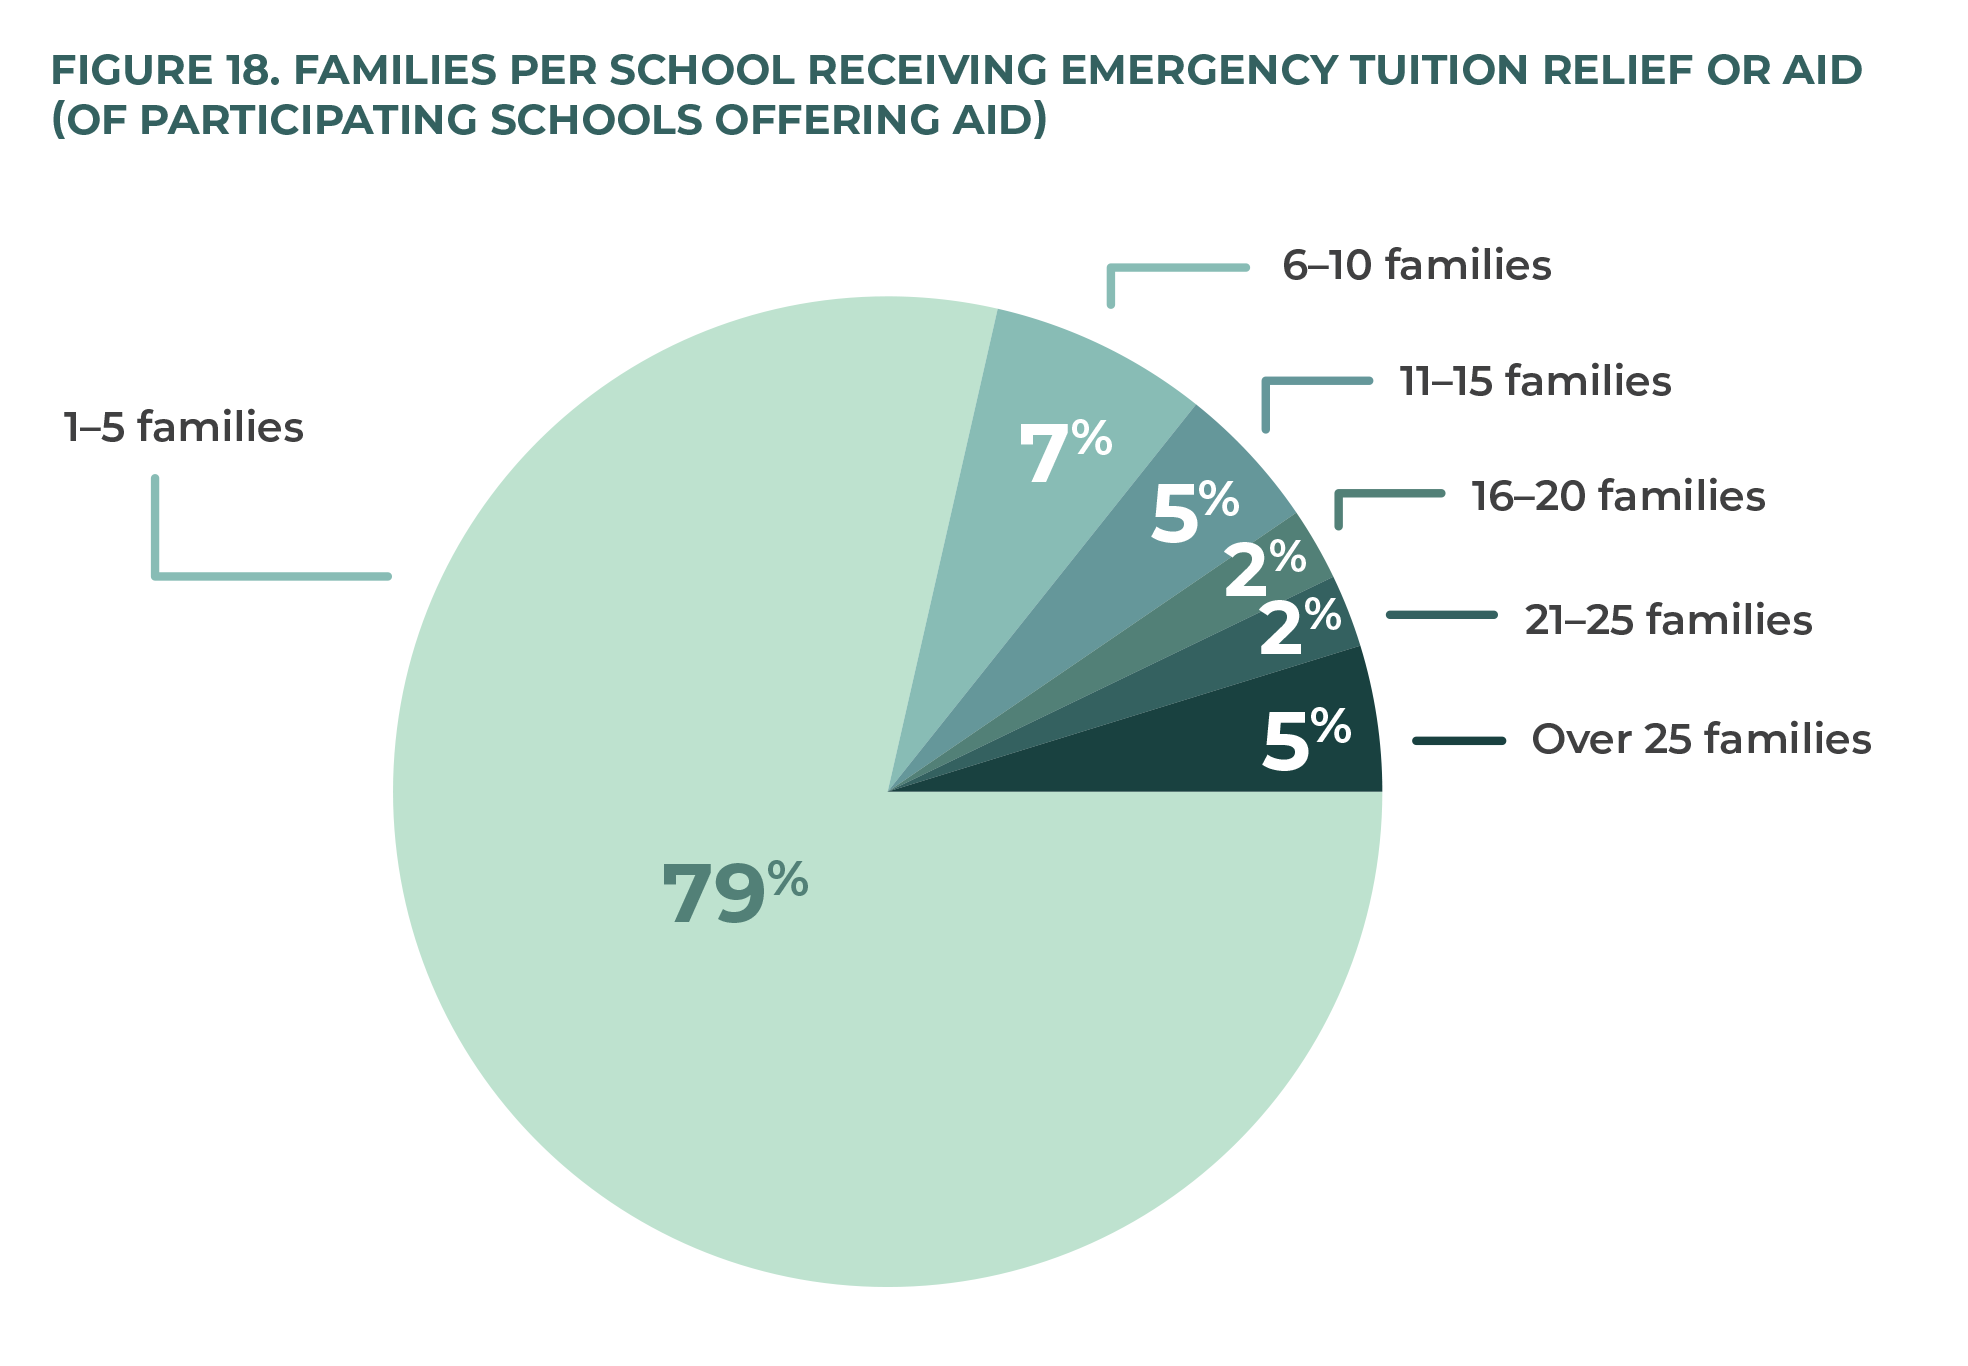
Fourteen percent of participants indicated that they had provided some form of partial tuition relief or rebate (figure 16). Most schools, however, continued their practice of offering financial assistance to those most in need. Sixty percent of schools reported offering tuition assistance to their families (figure 17), with 79 percent (figure 18) of those schools reporting that they assisted between one and five families. Two schools reported helping a high number, 30 and 35 families. Overall, schools reported providing financial assistance to 248 families.
Accessing Government Programs
Eighty-nine percent (62 out of 70 schools) took part in the Canada Emergency Wage Subsidy, and 50 percent used the Canada Emergency Business Account. Only three schools (4 percent) indicated that they had not made use of any government assistance (figure 19). Independent schools were very hesitant to apply for any funding from the federal government. When asked why, principals replied that they were afraid that the money would somehow be “clawed back” once the pandemic crisis was over, indicating fears of “strings attached.”
Staffing
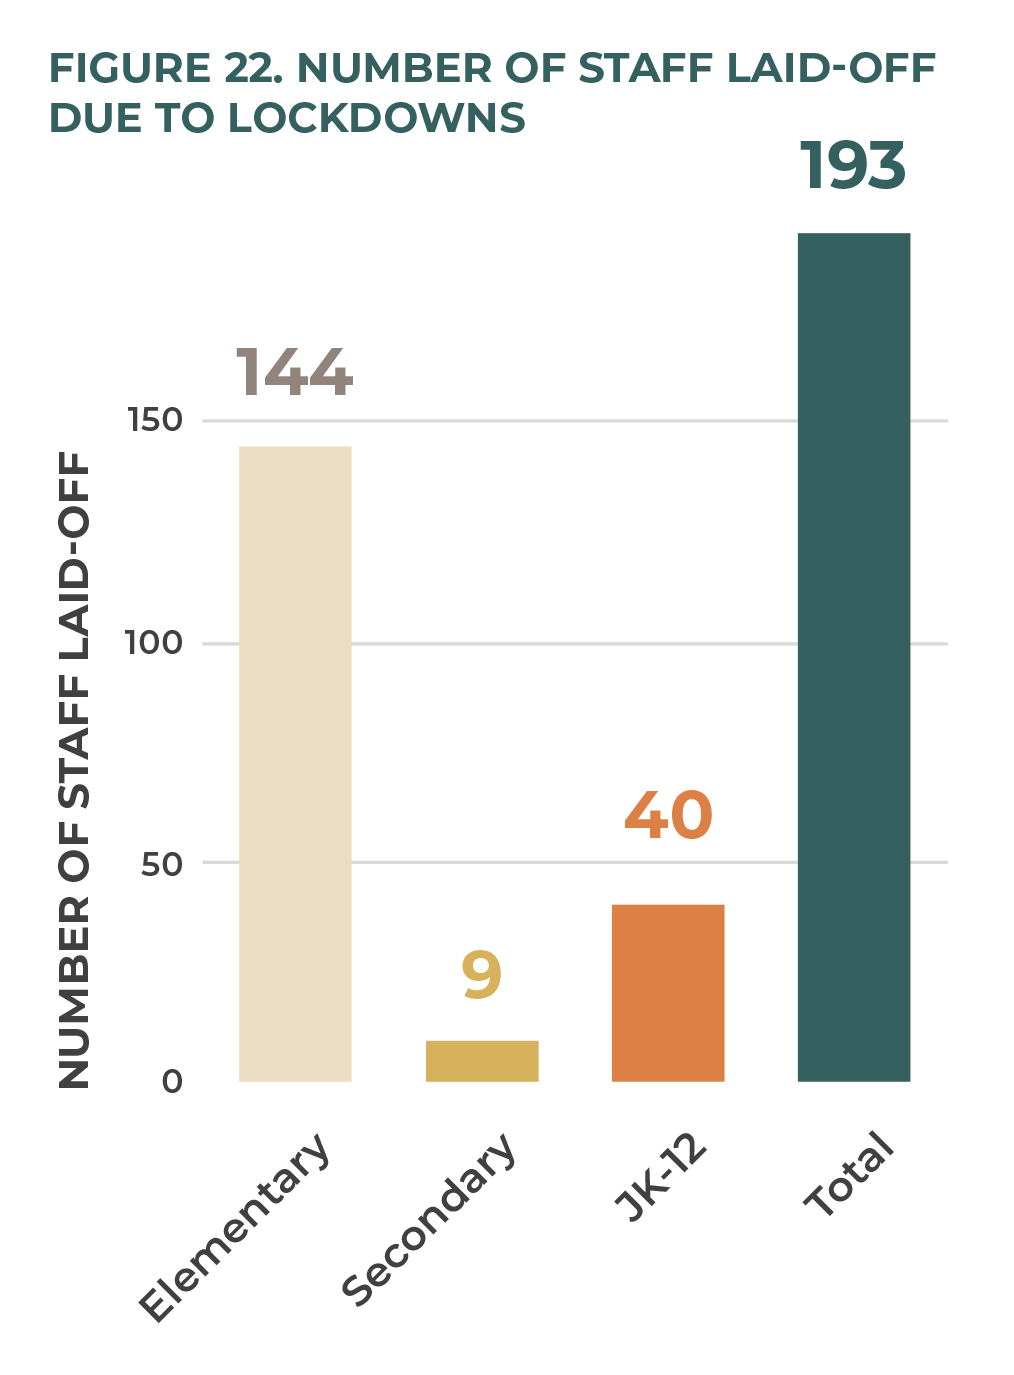
In order to determine the effect that closures had on schools’ employment needs, we asked respondents to answer a number of questions related to staffing needs before and after the closures. A large majority (80–90 percent, depending on school type) reported that when not in a period of school closure, their staffing needs either increased or did not change (figure 20). Combined, schools reported a total of 97 positions added. When asked whether school closures resulted in layoffs, however, over half (56 percent) of schools reported laying off staff (figure 21). At least 193 staff were laid off across all school types; elementary schools were most affected, with 144 staff laid off. Nine secondary school staff and forty JK–12 school staff were laid off (figure 22). 20 20 These counts and percentages are approximate and understated, as they do not necessarily account for laid-off bus drivers and other auxiliary staff.
Fundraising and Donations
School fundraising activities were significantly affected during the 2021–22 school year. The area most negatively affected was fundraising sales and events; 64 percent of respondents reported that these either decreased or stopped altogether. Yet three-quarters of schools (76 percent) indicated that monetary donations either increased or continued as normal. Independent schools are heavily dependent on fundraisers and philanthropy, and they needed to be nimble in their efforts. Principals gave many examples of how their fundraising efforts changed in response to the government restrictions. Many schools transitioned their usual live auction to a virtual event. Some created drive-through events. Others simply cancelled their events and made direct appeals instead. That only 21 percent of schools reported a decrease in monetary donations is a testament to the generosity of donors in this sector and to the creativity and nimbleness that independent schools can apply (figure 23).
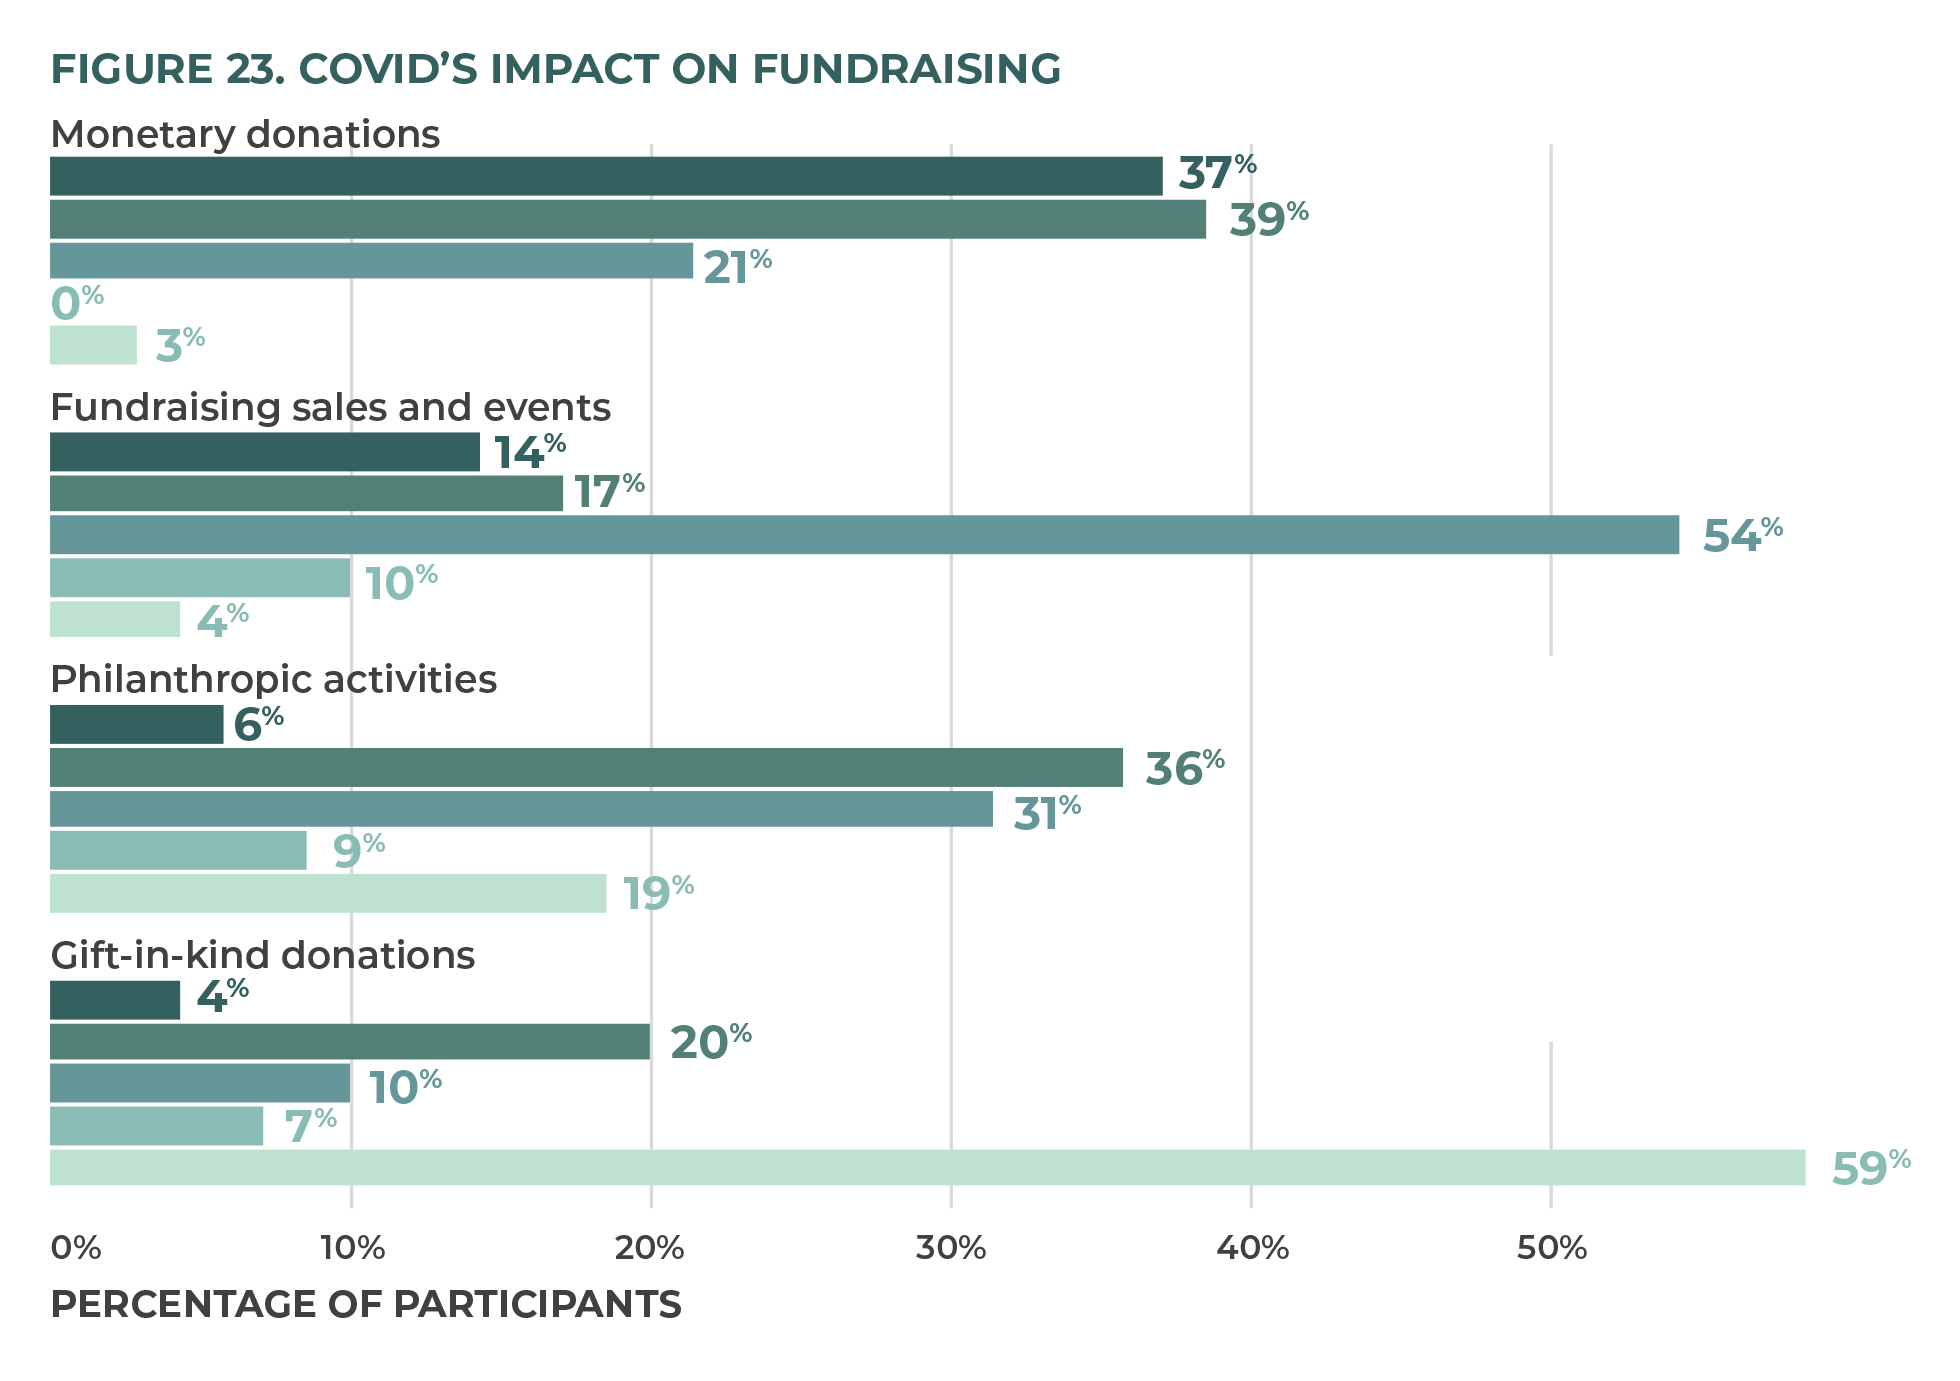
It is worth noting that many of the in-kind donations reported were personal protective equipment, for which independent schools received no funding from the government.
“One of our donors gave $1,000 to every family new to our school this year, just to encourage and affirm their decision to send a child to our school and make that investment at a challenging time. This totalled $33,000 and was a tremendous blessing.”
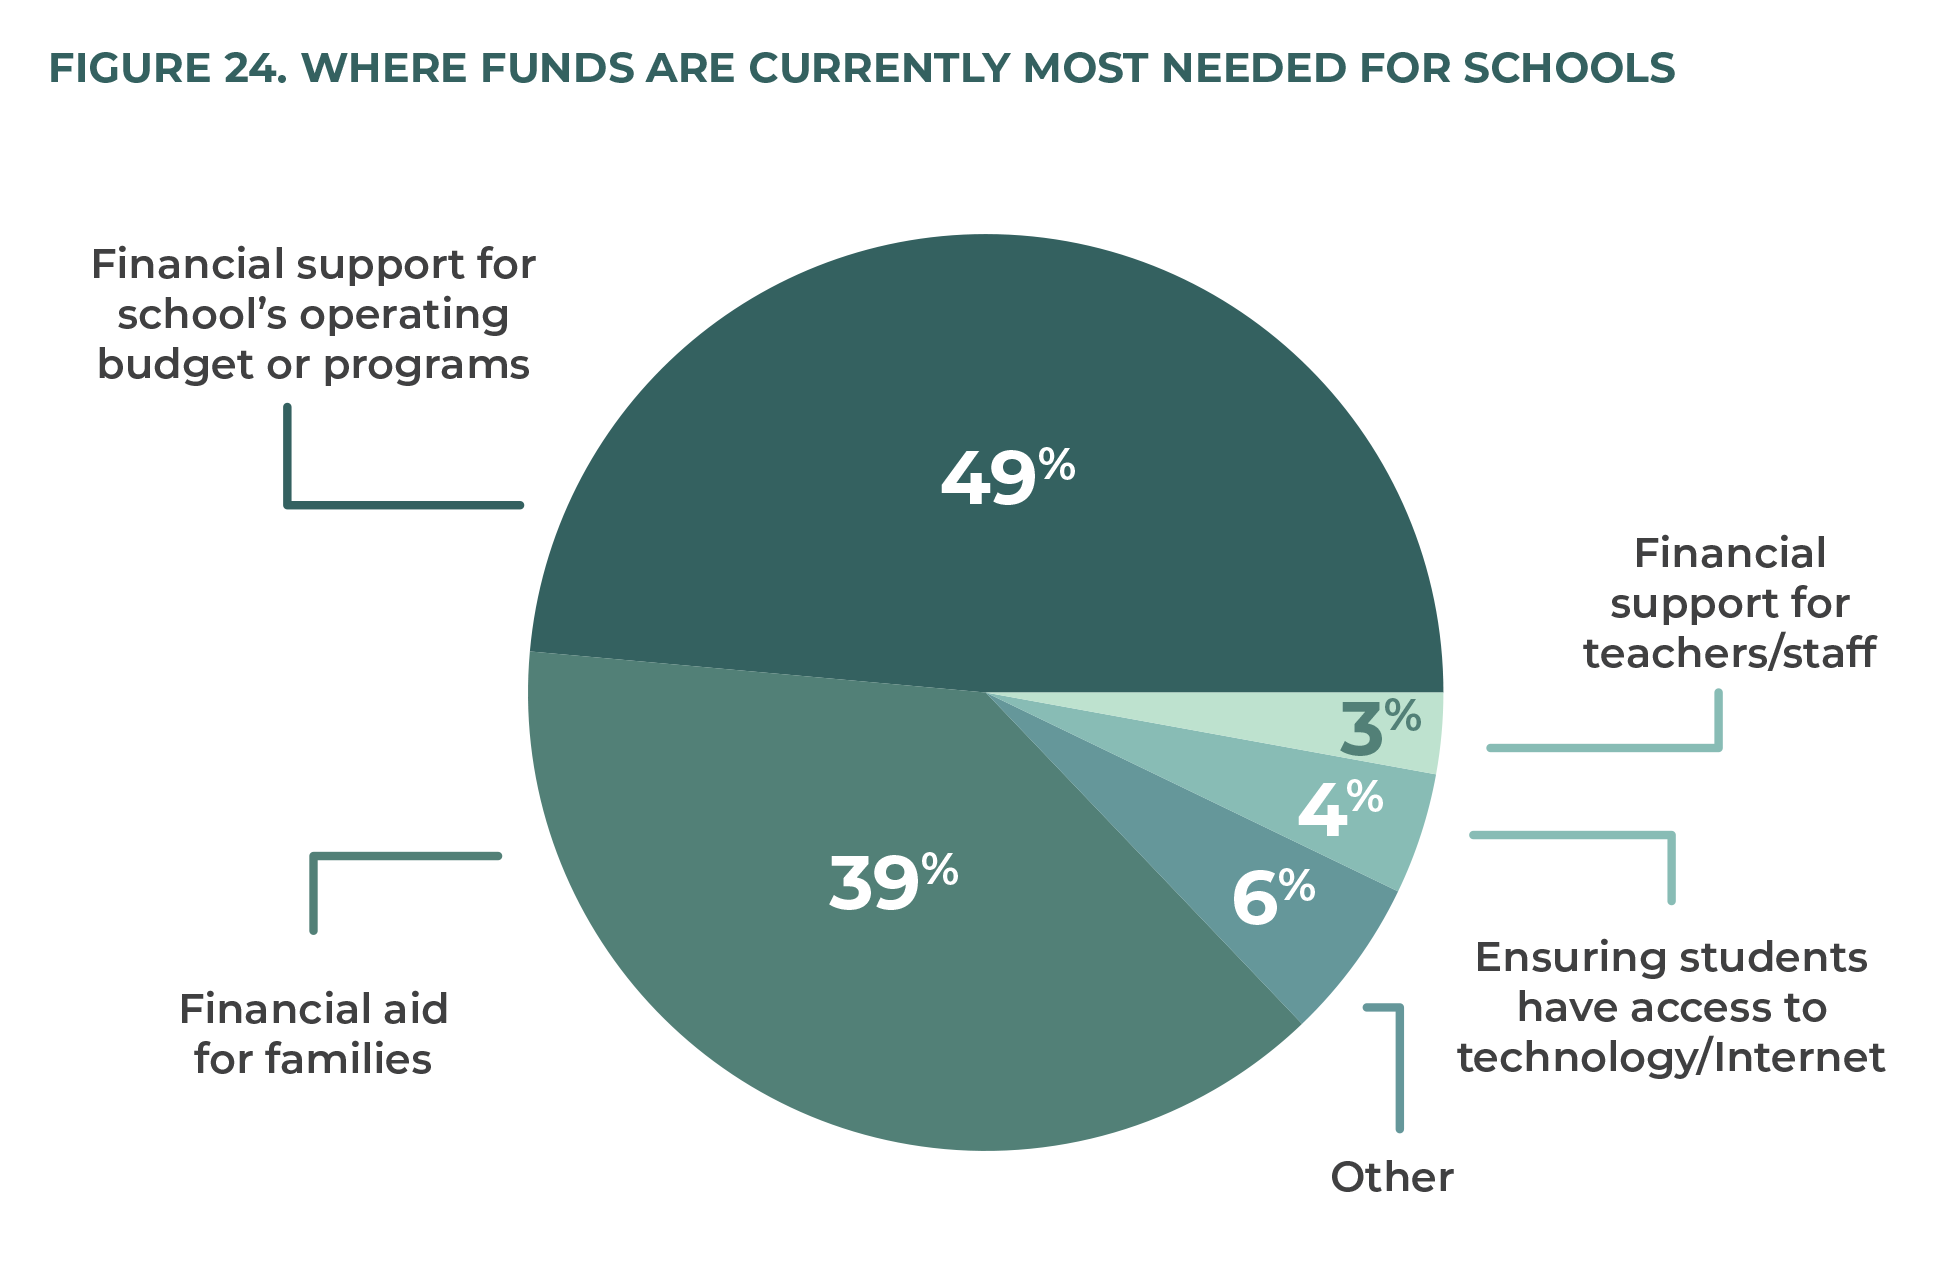
When respondents were asked about where funds were needed the most, 49 percent said that the operating budget was their greatest need, with financial aid for families being the second greatest, at 39 percent. Only 13 percent of respondents indicated that they would use donations for purposes outside of their operating budget or financial aid (figure 24).
Potential Positive Impacts
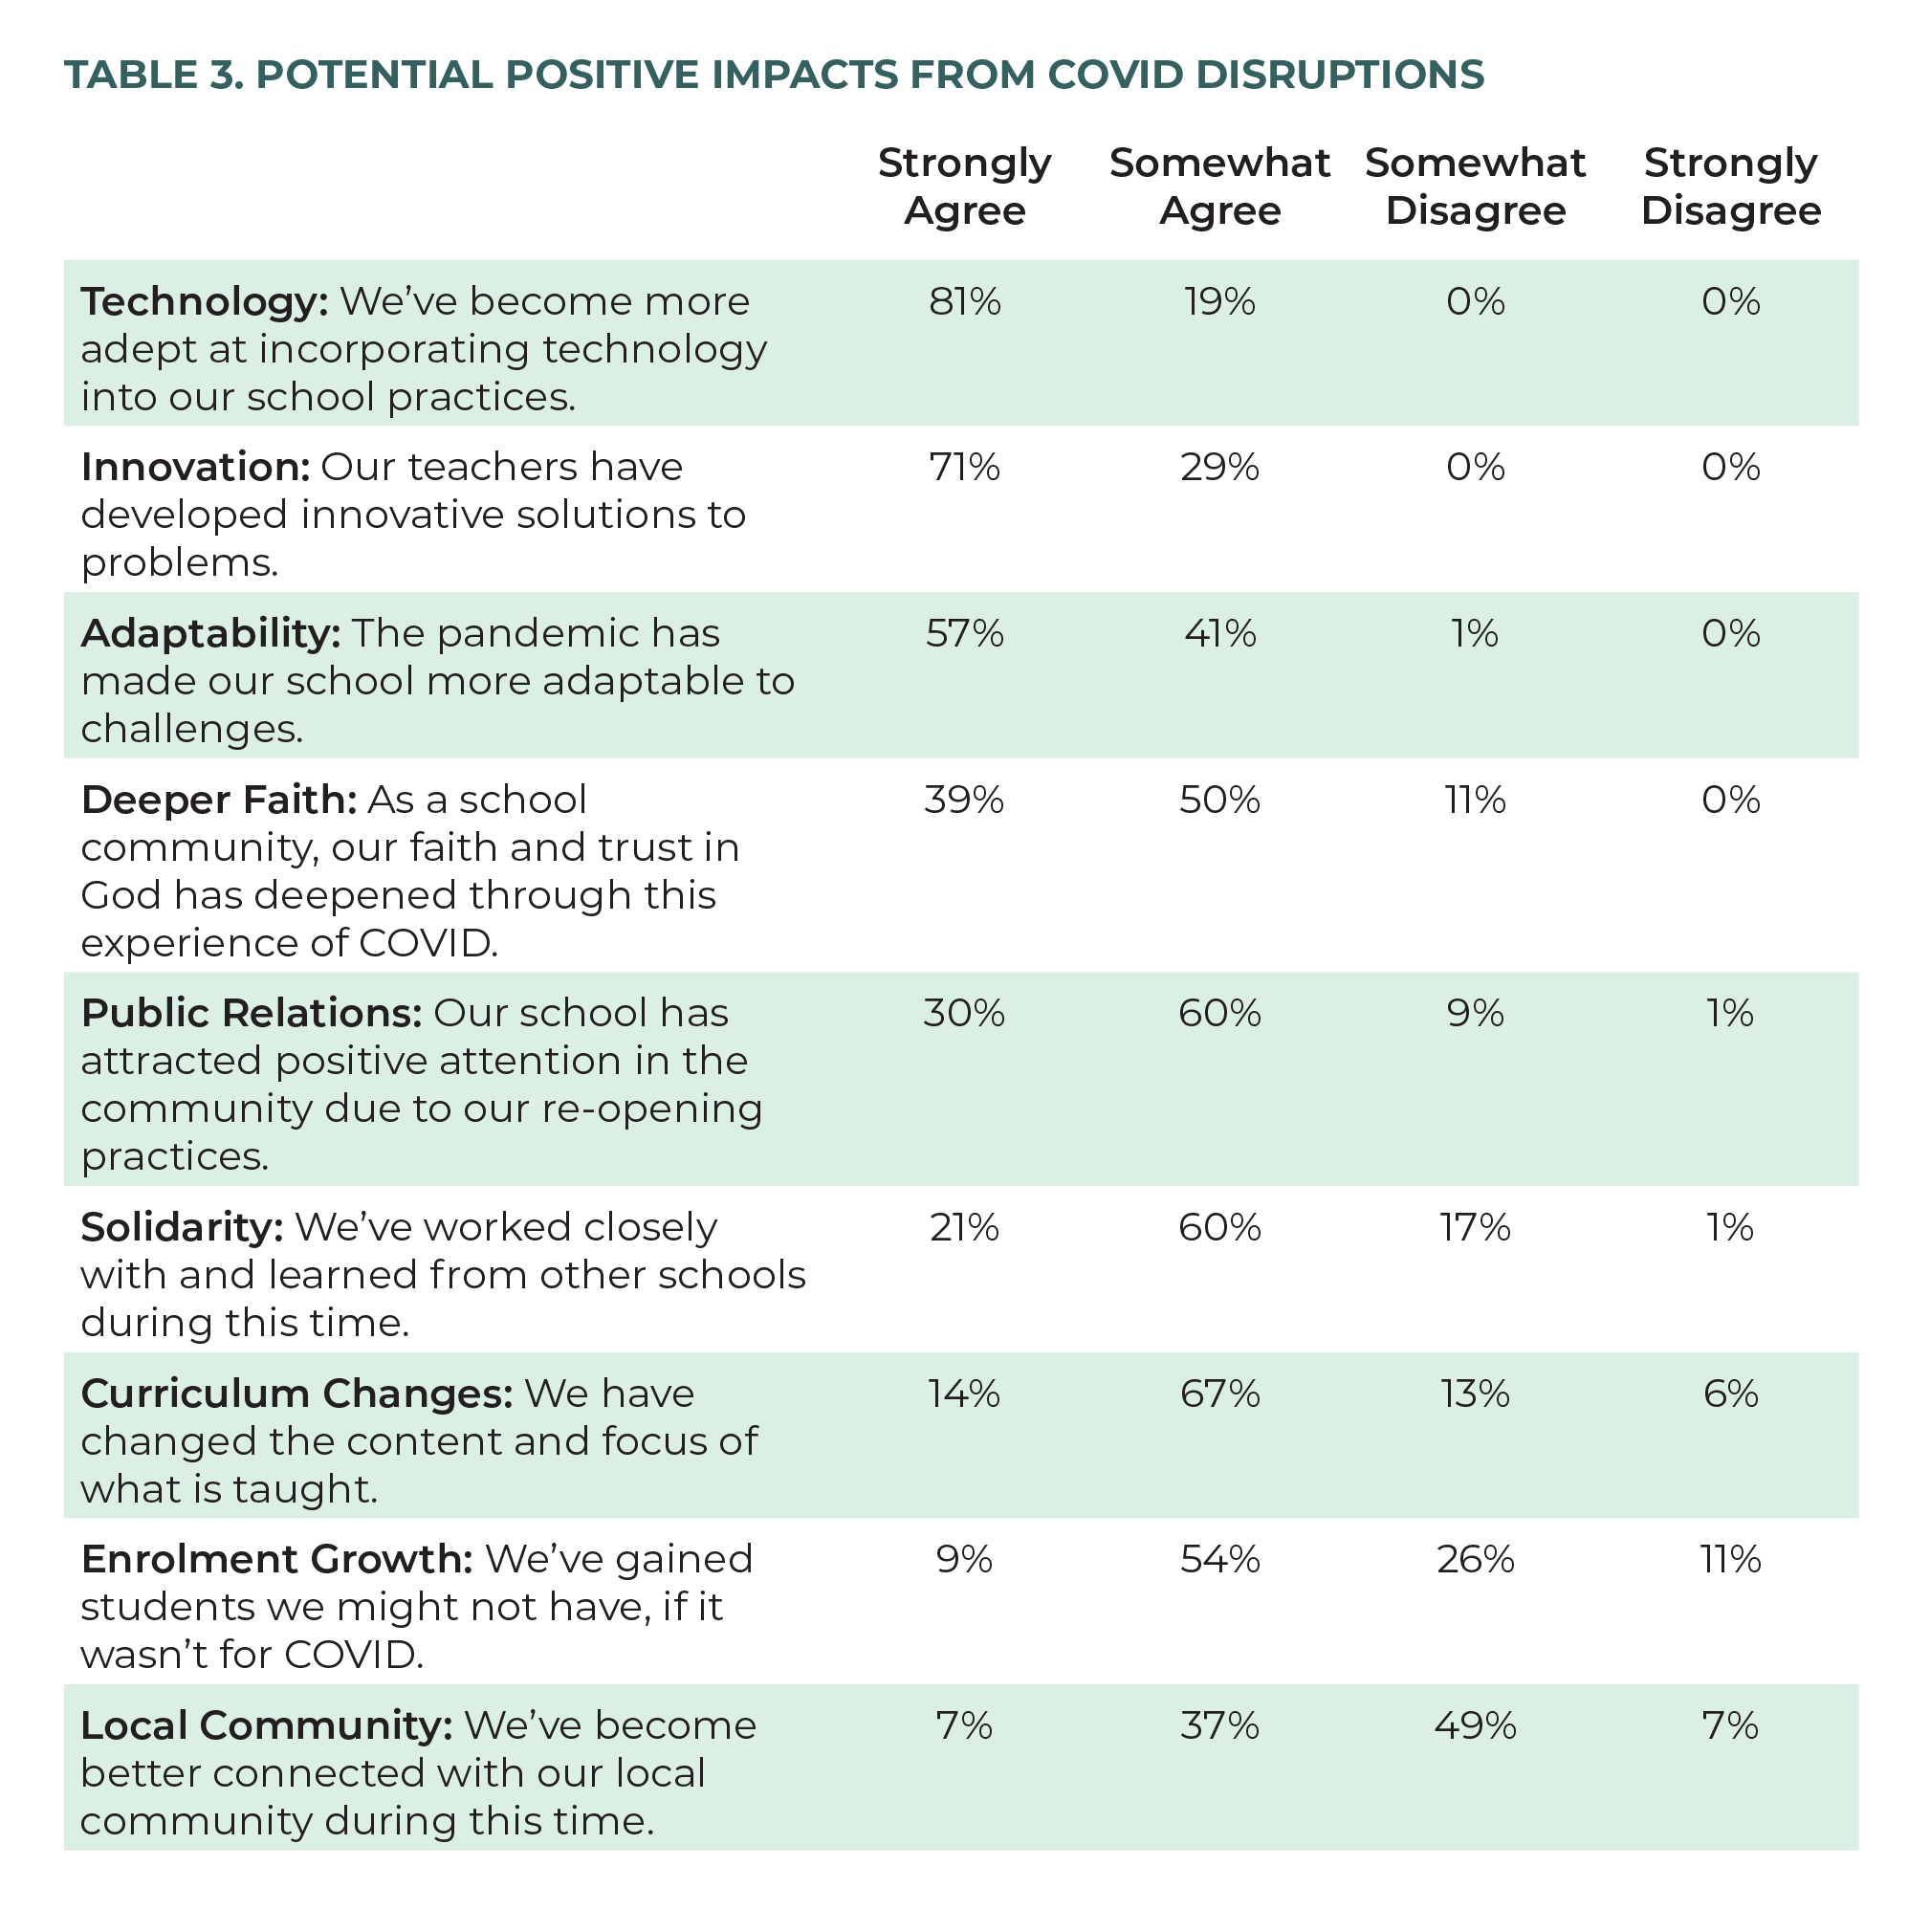
Although school closures and pandemic-related restrictions made many aspects of school more difficult, there were some positive impacts as well. We asked respondents to choose from a list of potential positive impacts and rate them on a Likert scale from Strongly Agree to Strongly Disagree. There were three key areas of positive impact that all respondents rated as Strongly Agree or Somewhat Agree: technology, innovation, and adaptability. First, schools became more adept at incorporating technology into school practices. Second, teachers developed innovative solutions to problems. And third, schools became more adaptable in responding to challenges. It is interesting that while 90 percent of schools reported having attracted positive attention in the community with respect to their re-opening, only 44 percent of schools reported feeling better connected with their local community during the past year (table 3).
Potential Concerns
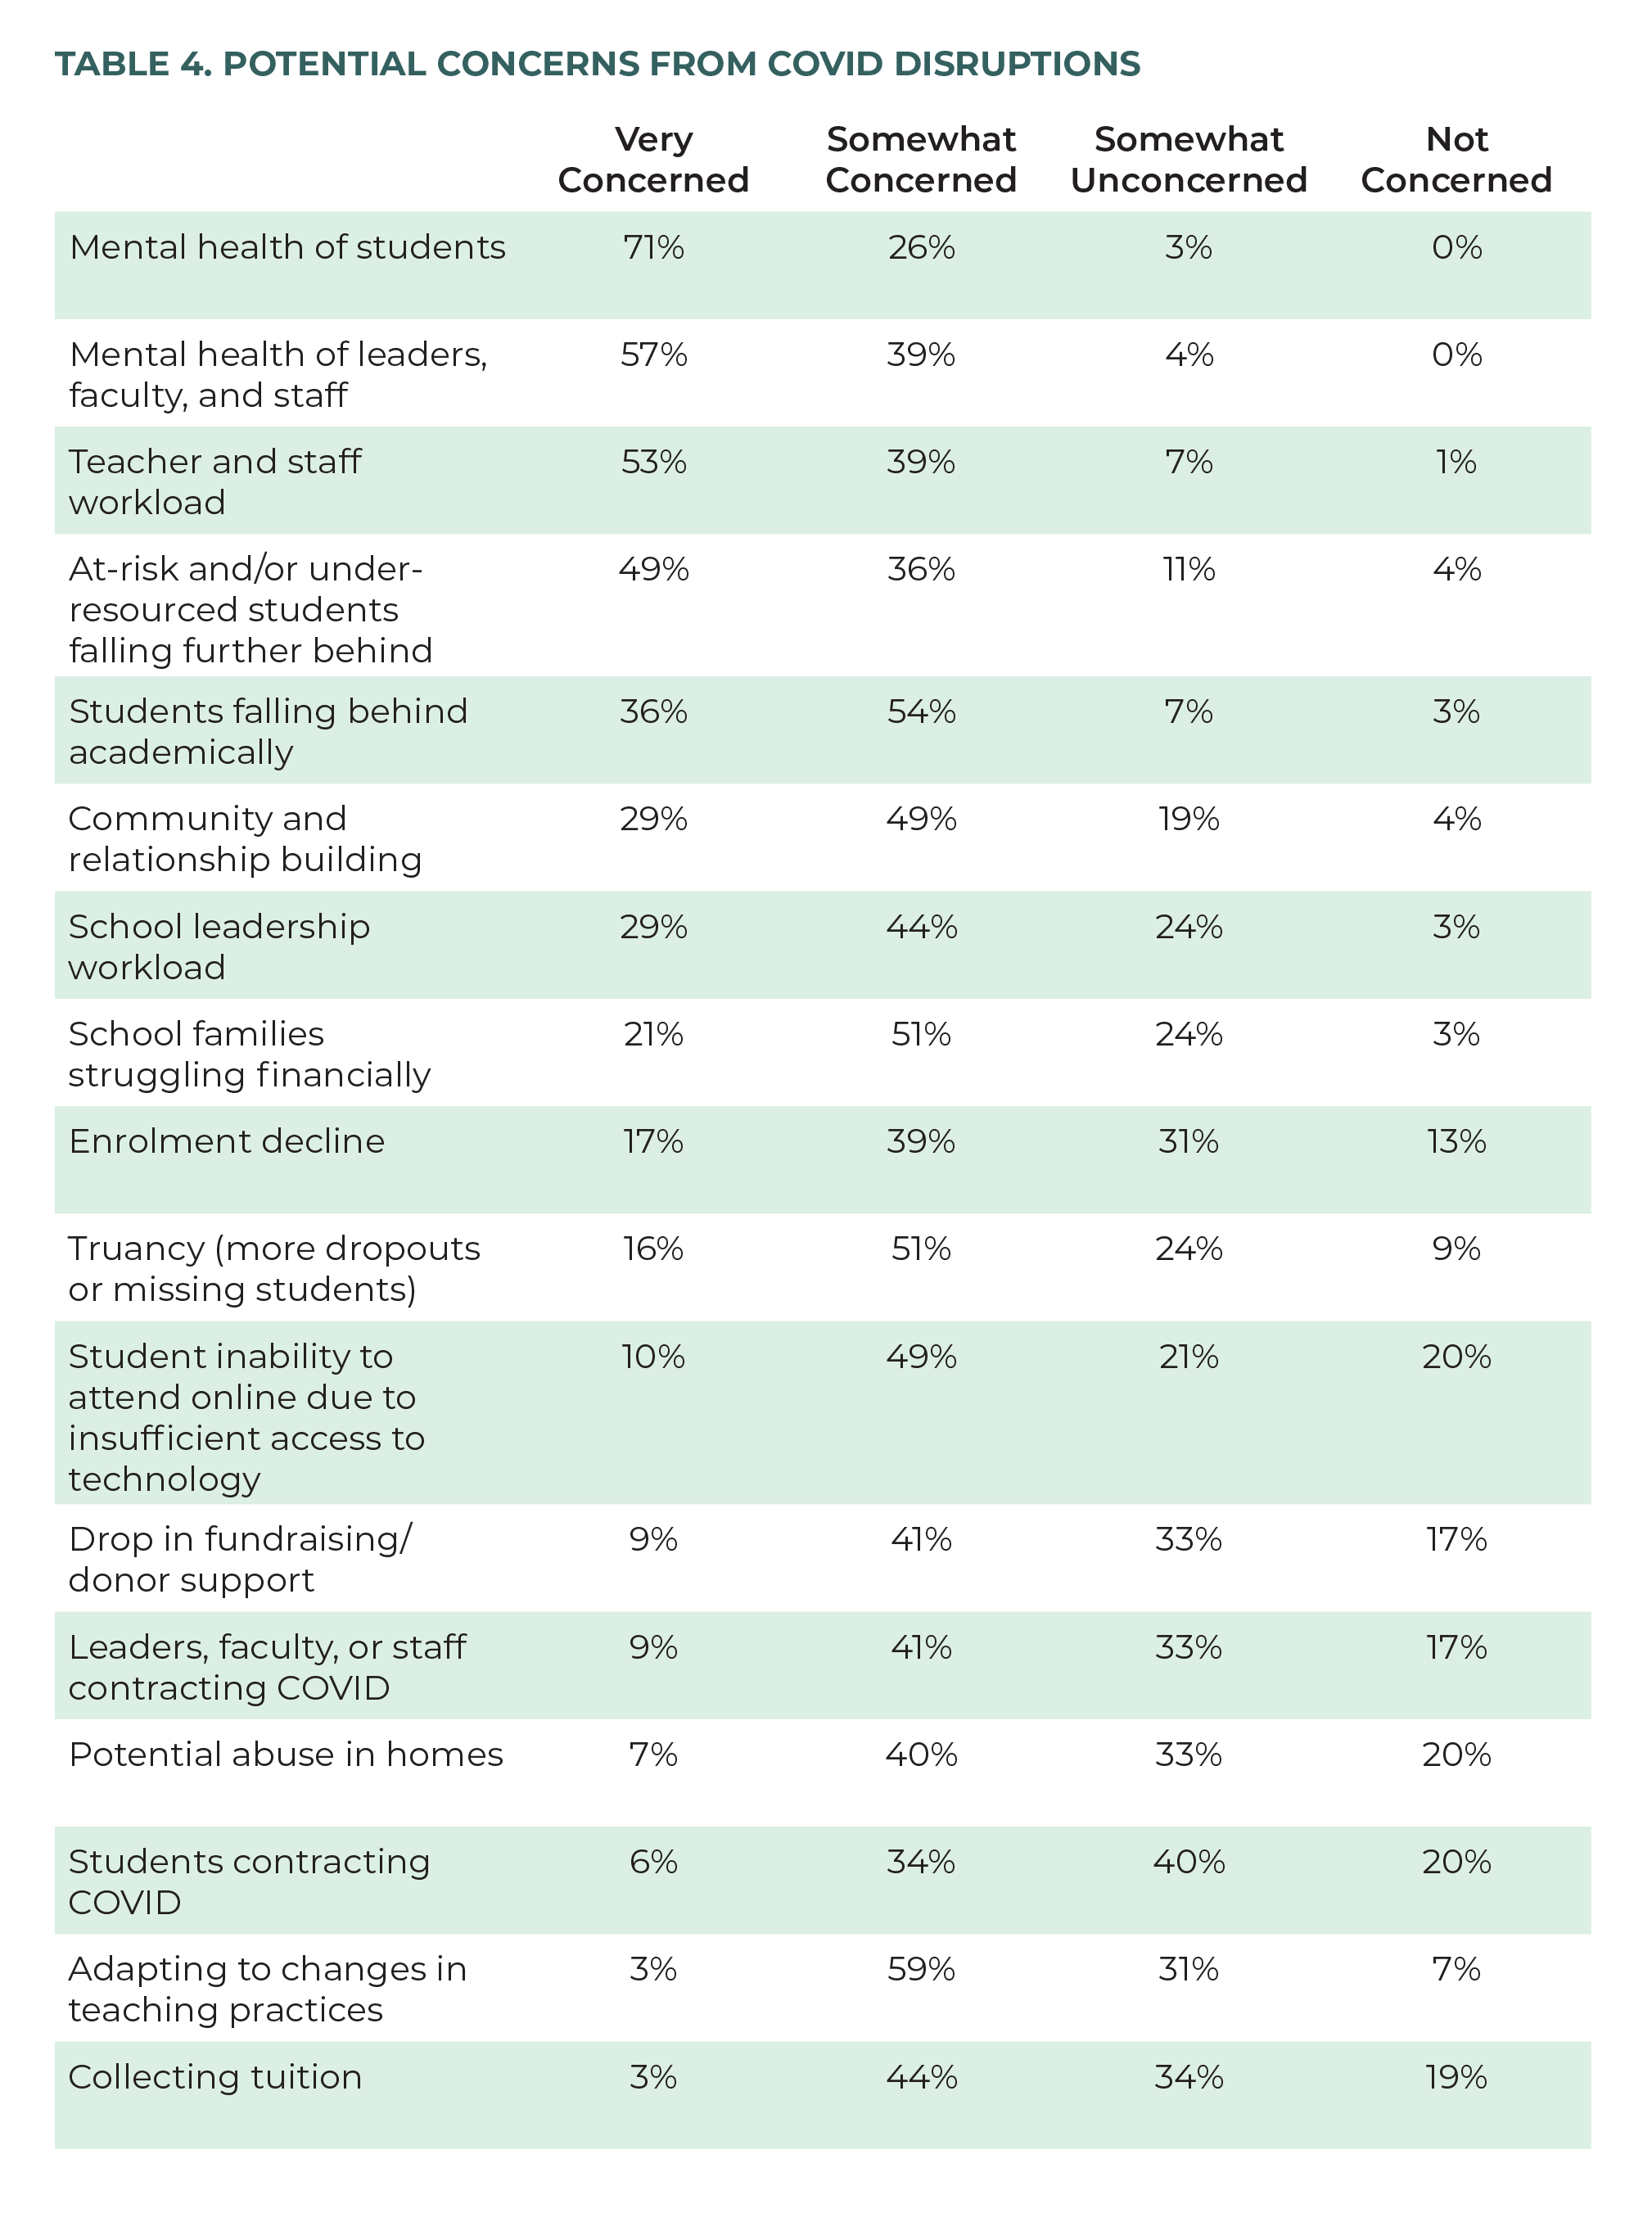
Although there were positive impacts arising out of COVID-19 restrictions, there were also areas of concern. Respondents were asked to rate statements of concern on a Likert scale from Very Concerned to Not Concerned. The area of greatest concern was the mental health of students, with 71 percent very concerned and 26 percent at least somewhat concerned. Similarly, the second highest concern—at 57 percent very concerned and 39 percent somewhat concerned—was the mental health of leaders, faculty, and staff. Also of high concern was teacher and staff workload, with 53 percent very concerned and 39 percent somewhat concerned. Most also reported some concern about student learning loss (i.e., falling behind academically), with specific concern that at-risk and under-resourced students may be falling further behind. Respondents’ lowest concern was that students might contract COVID-19 (table 4). It is possible that respondents’ confidence in the efficacy of the precautions put in place at their schools decreased their concern about possible COVID-19 spread in their schools.
These concerns are not unique to the independent school sector. The Ontario COVID-19 Science Advisory Table released a report in June 2021 that outlined many effects of school closures during the pandemic. They specifically noted:
“A number of pieces of evidence suggest adverse health impacts on children during COVID-19, although not directly linked to school disruption. Cross-sectional survey evidence shows a decline during the lockdowns in children’s levels of physical activity. Similarly, heightened mental health challenges have been identified among children during the COVID-19 pandemic. Youth, aged 15–24 years, saw the greatest declines in self-reported mental health of any age group. The percentage of young people who reported their mental health was excellent or very good dropped from 60 percent to 40 percent between March 2019 and July 2020.” 21 21 Ontario COVID-19 Science Advisory Table, “COVID-19 and Education Disruption in Ontario.”
Faculty Development and Support
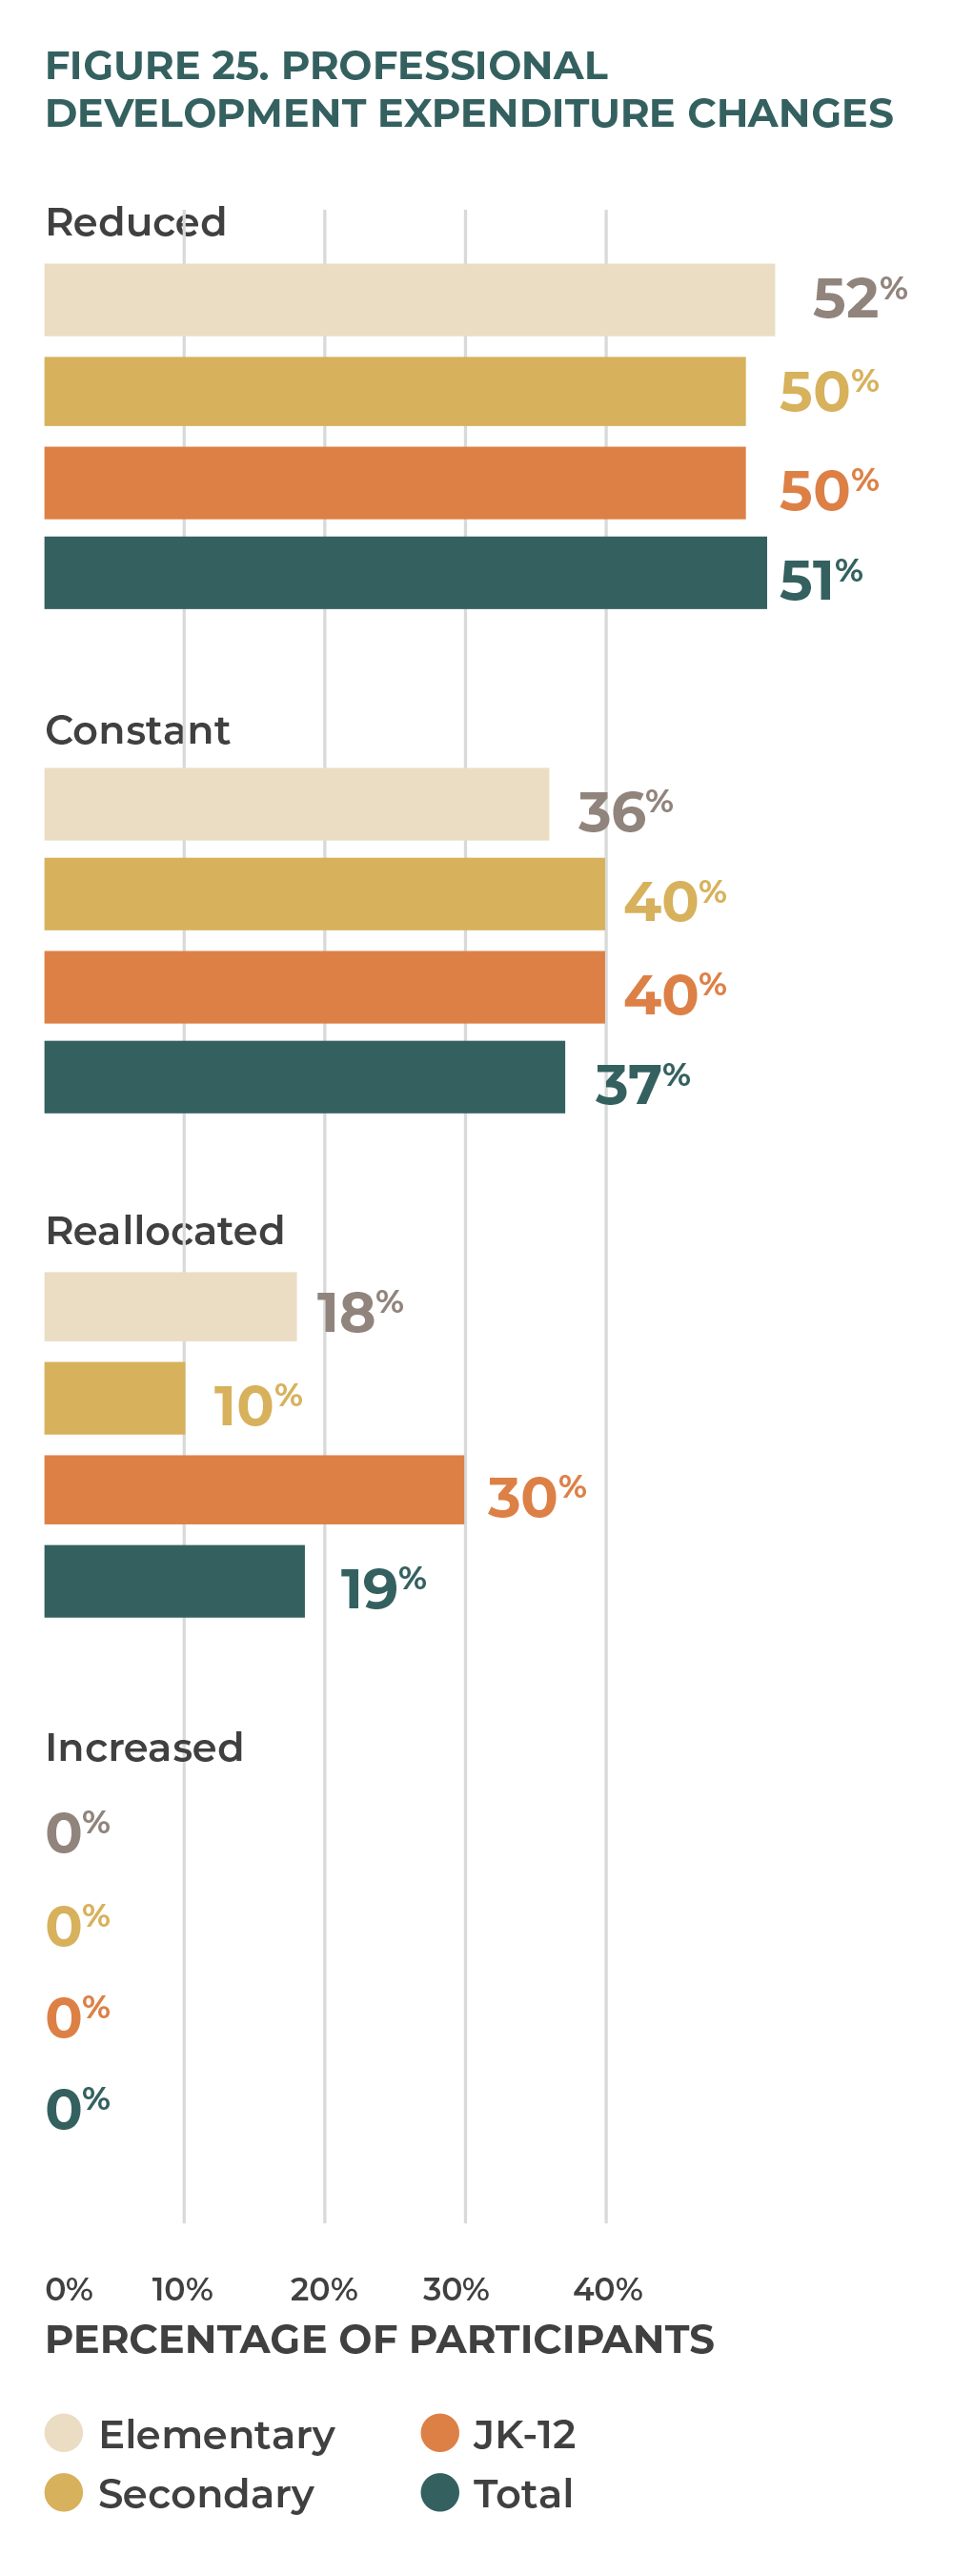
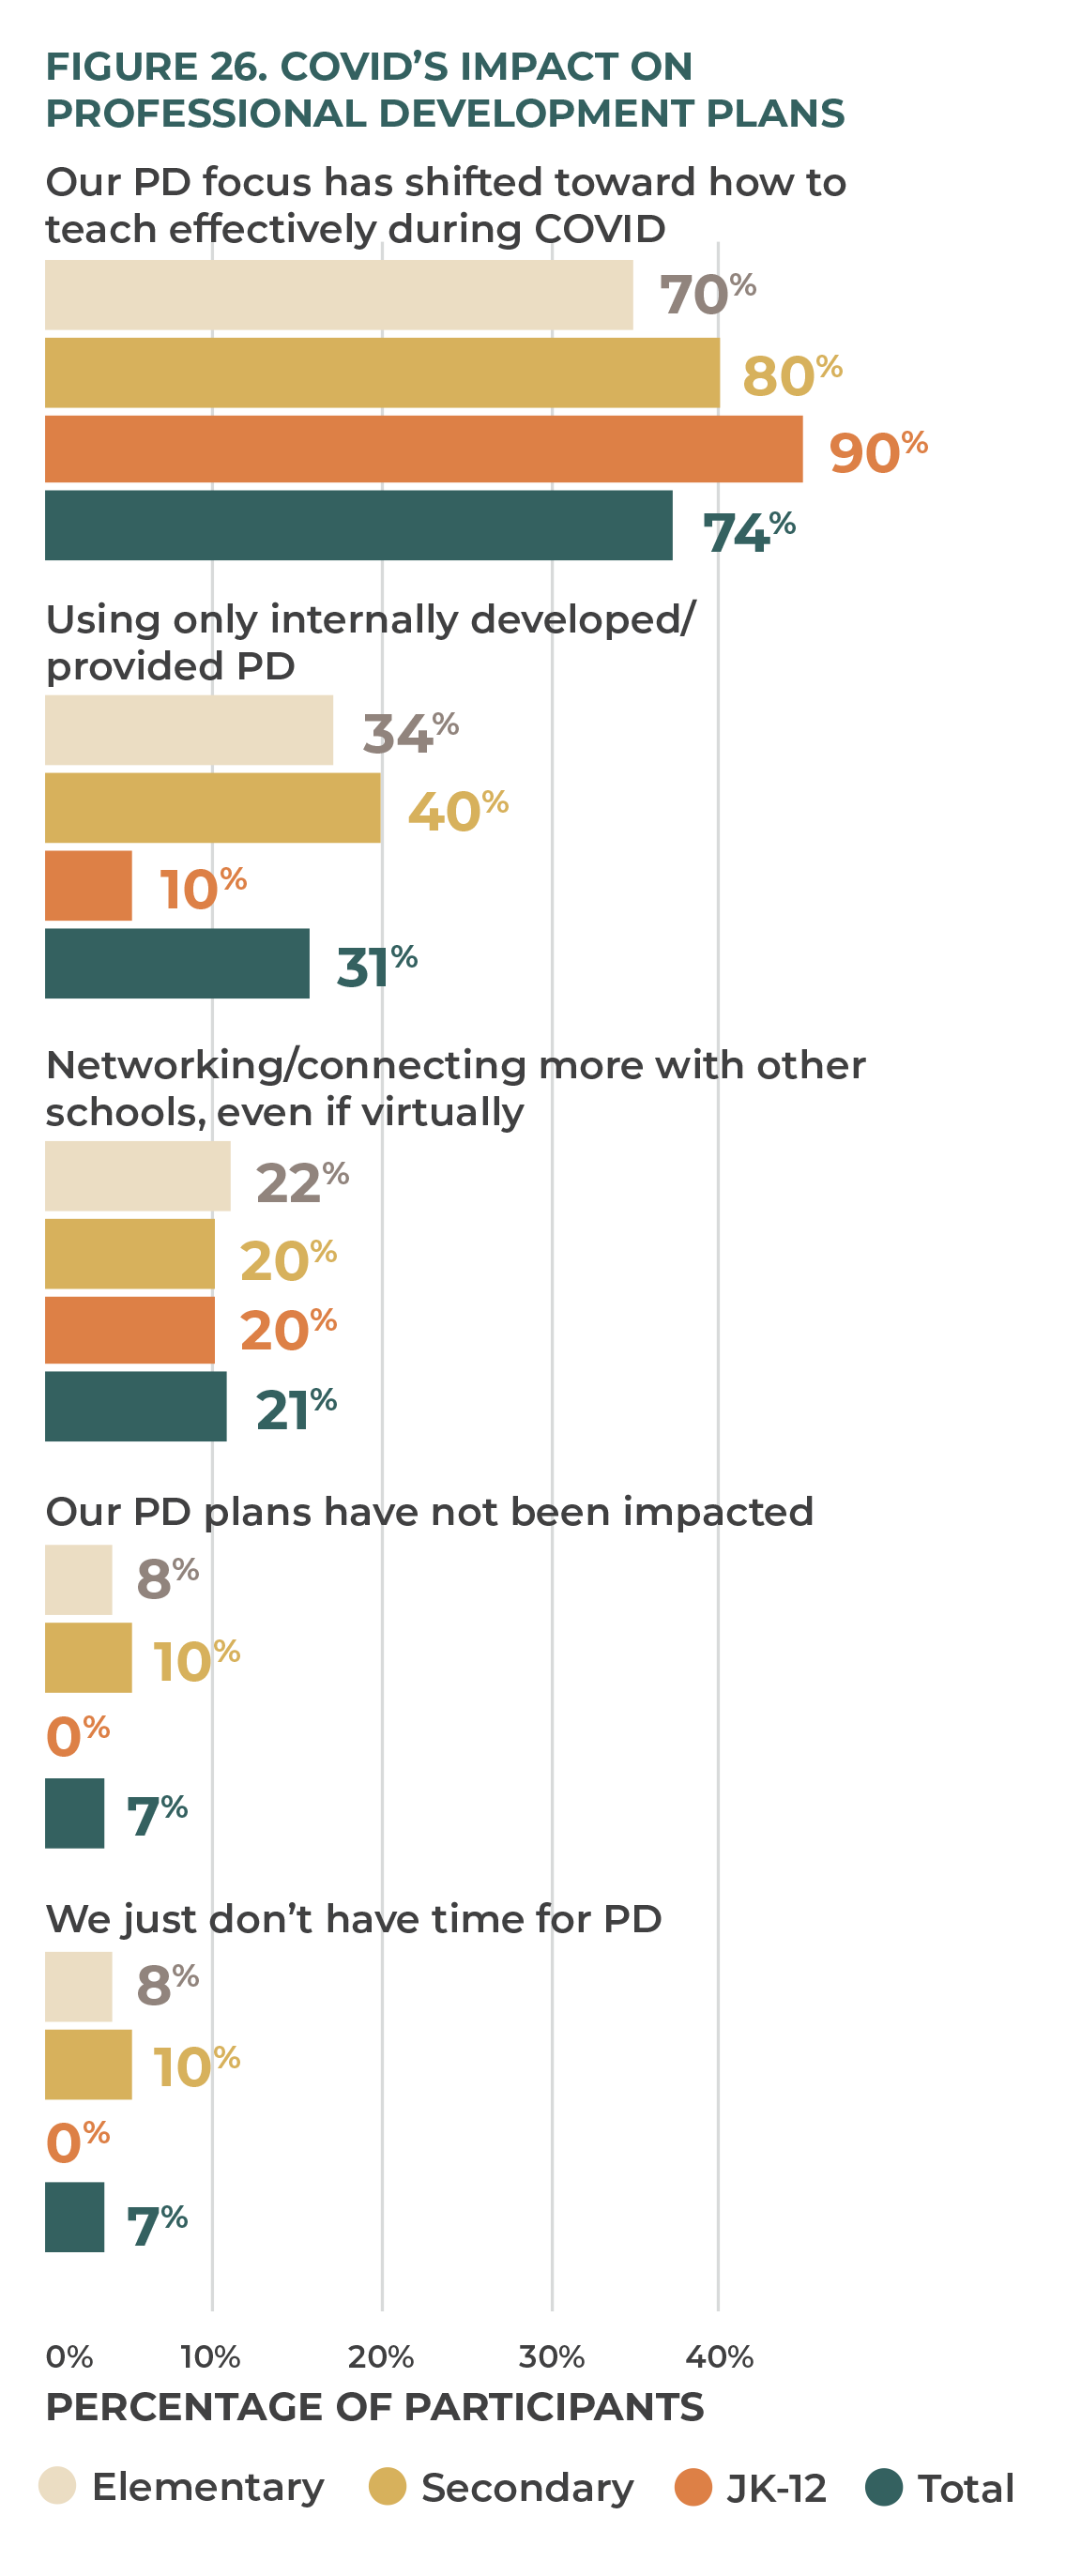
As noted above, respondents indicated that one of the positive outcomes of COVID-19 restrictions was growth in teachers’ innovation, adaptability, and learning about technology. As figures 27–29 indicate, schools did not heavily invest in professional development to create these outcomes. Half of respondents, regardless of school type, decreased their professional development budget. Nearly one-fifth reallocated this budget elsewhere (figure 25). 22 22 In figure 25, schools could select more than one option, as, for example, expenditures could be constant (or reduced) and reallocated at the same time. Thus, sums may exceed 100 percent. This may be explained by schools shifting their professional development to in-house needs in relation to remote learning. Nearly three-quarters of respondent schools (74 percent) indicated that they shifted their focus toward learning how to teach effectively during COVID-19 (figure 26).
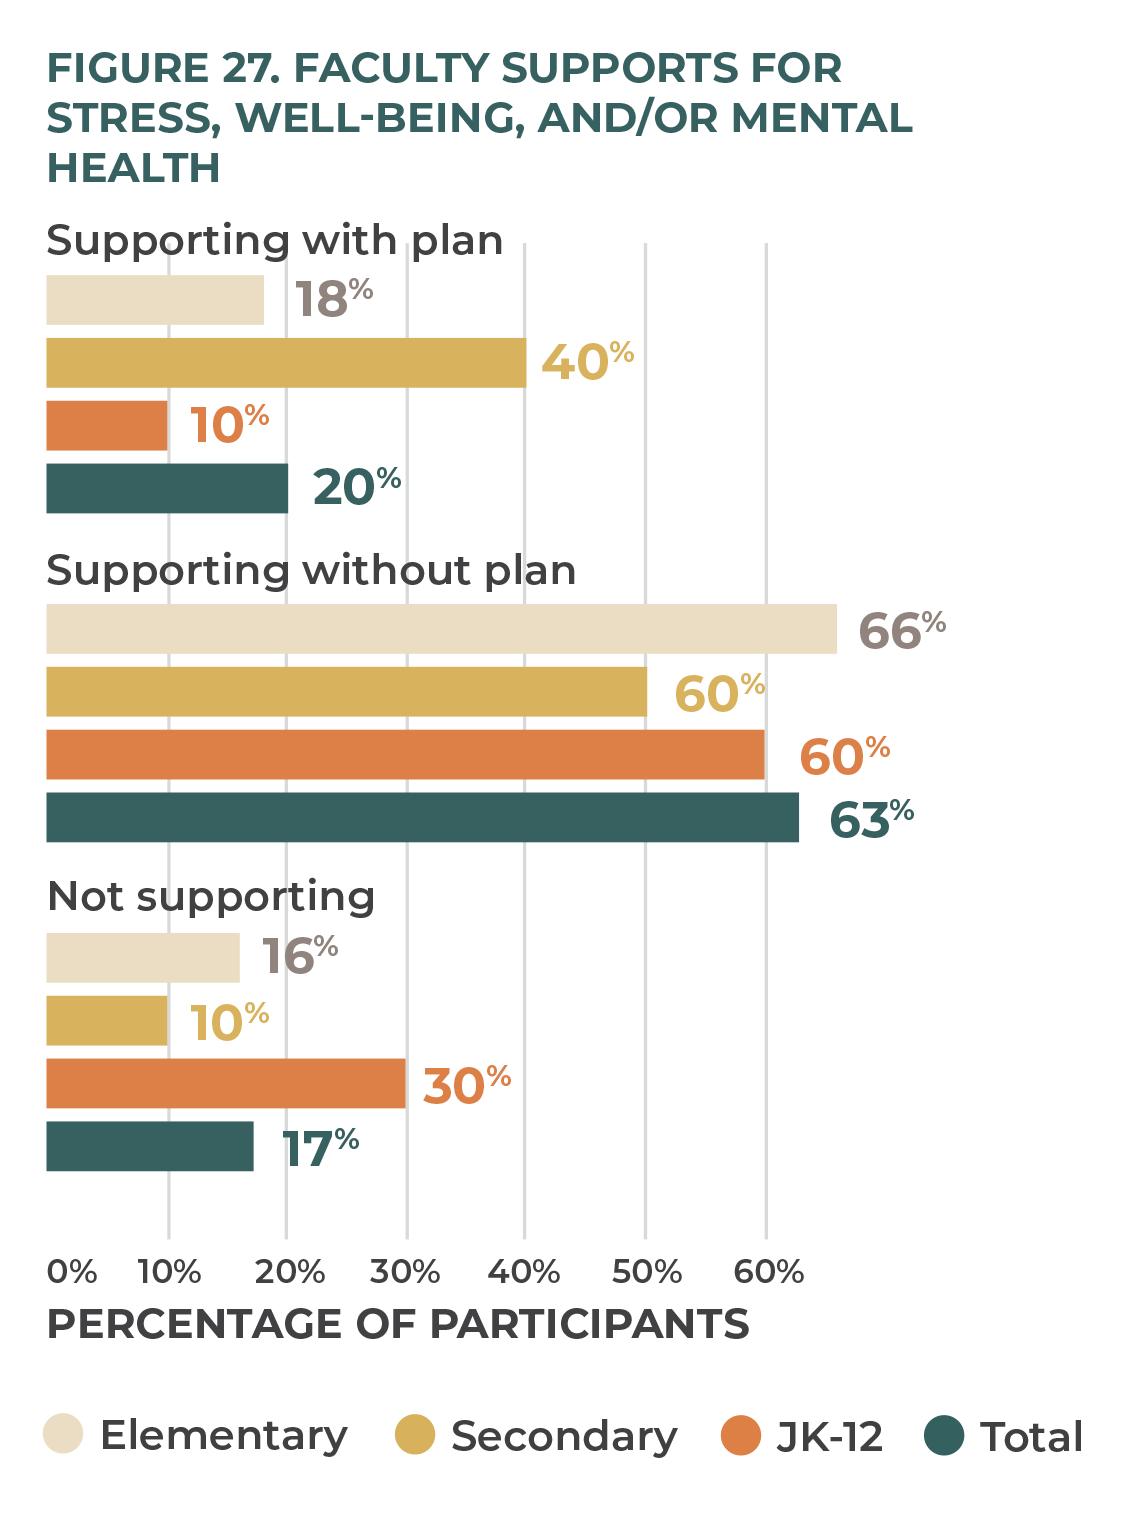
As teachers pivoted from in-person learning to remote learning and back again, many faced increased workload and stress. Respondents were asked about the extent to which they created intentional programs to support staff with stress, well-being, and mental health. Secondary schools appear to have led the way here, with 40 percent reporting that they had intentionally created programs to support staff. Overall, however, only one-fifth of schools (20 percent) reported that they had intentionally created staff-support programs (figure 27).
Included in the Ontario COVID-19 Science Advisory Table’s report was the toll that school closures had on the teaching profession:
“A highly feminized workforce, educators as a group were particularly affected by caring responsibilities for their own children at home, while continuing to work. A national survey suggests that teachers have experienced considerable stress and burnout during COVID-19. There are further reports of teacher shortages resulting from leaves and attrition from the profession in light of COVID-19 contexts. As a result of these shortages, exceptional measures such as allowing student teachers temporary teaching certificates, and in some cases, hiring non-teachers were undertaken. There may be long-term effects on the profession in terms of teacher supply.” 23 23 Ontario COVID-19 Science Advisory Table, “COVID-19 and Education Disruption in Ontario.”
“Our staff have come together to support each other in incredible ways. From the early days of the pandemic, where we had to figure out how to use Microsoft Teams, to supporting each other through mental health challenges. . . . COVID-19 has been a challenge but one that we have been able to face together as a team, and as a result it has definitely made our team stronger!”
While there is no shortage of supports for mental-health concerns available to schools, these were difficult to access during stay-at-home orders, lockdowns, and school closures. Surviving the burdens and impositions of each day, not thriving, was the focus during this challenging time. Additionally, the frequent and at times unexpected shift in government policies and regulations meant that administrators were focused on responding to these changes and informing the larger school community in a timely manner. There was not often time to walk through the changes and provide staff adequate planning or recovery time.
COVID-19 Guidance Sources
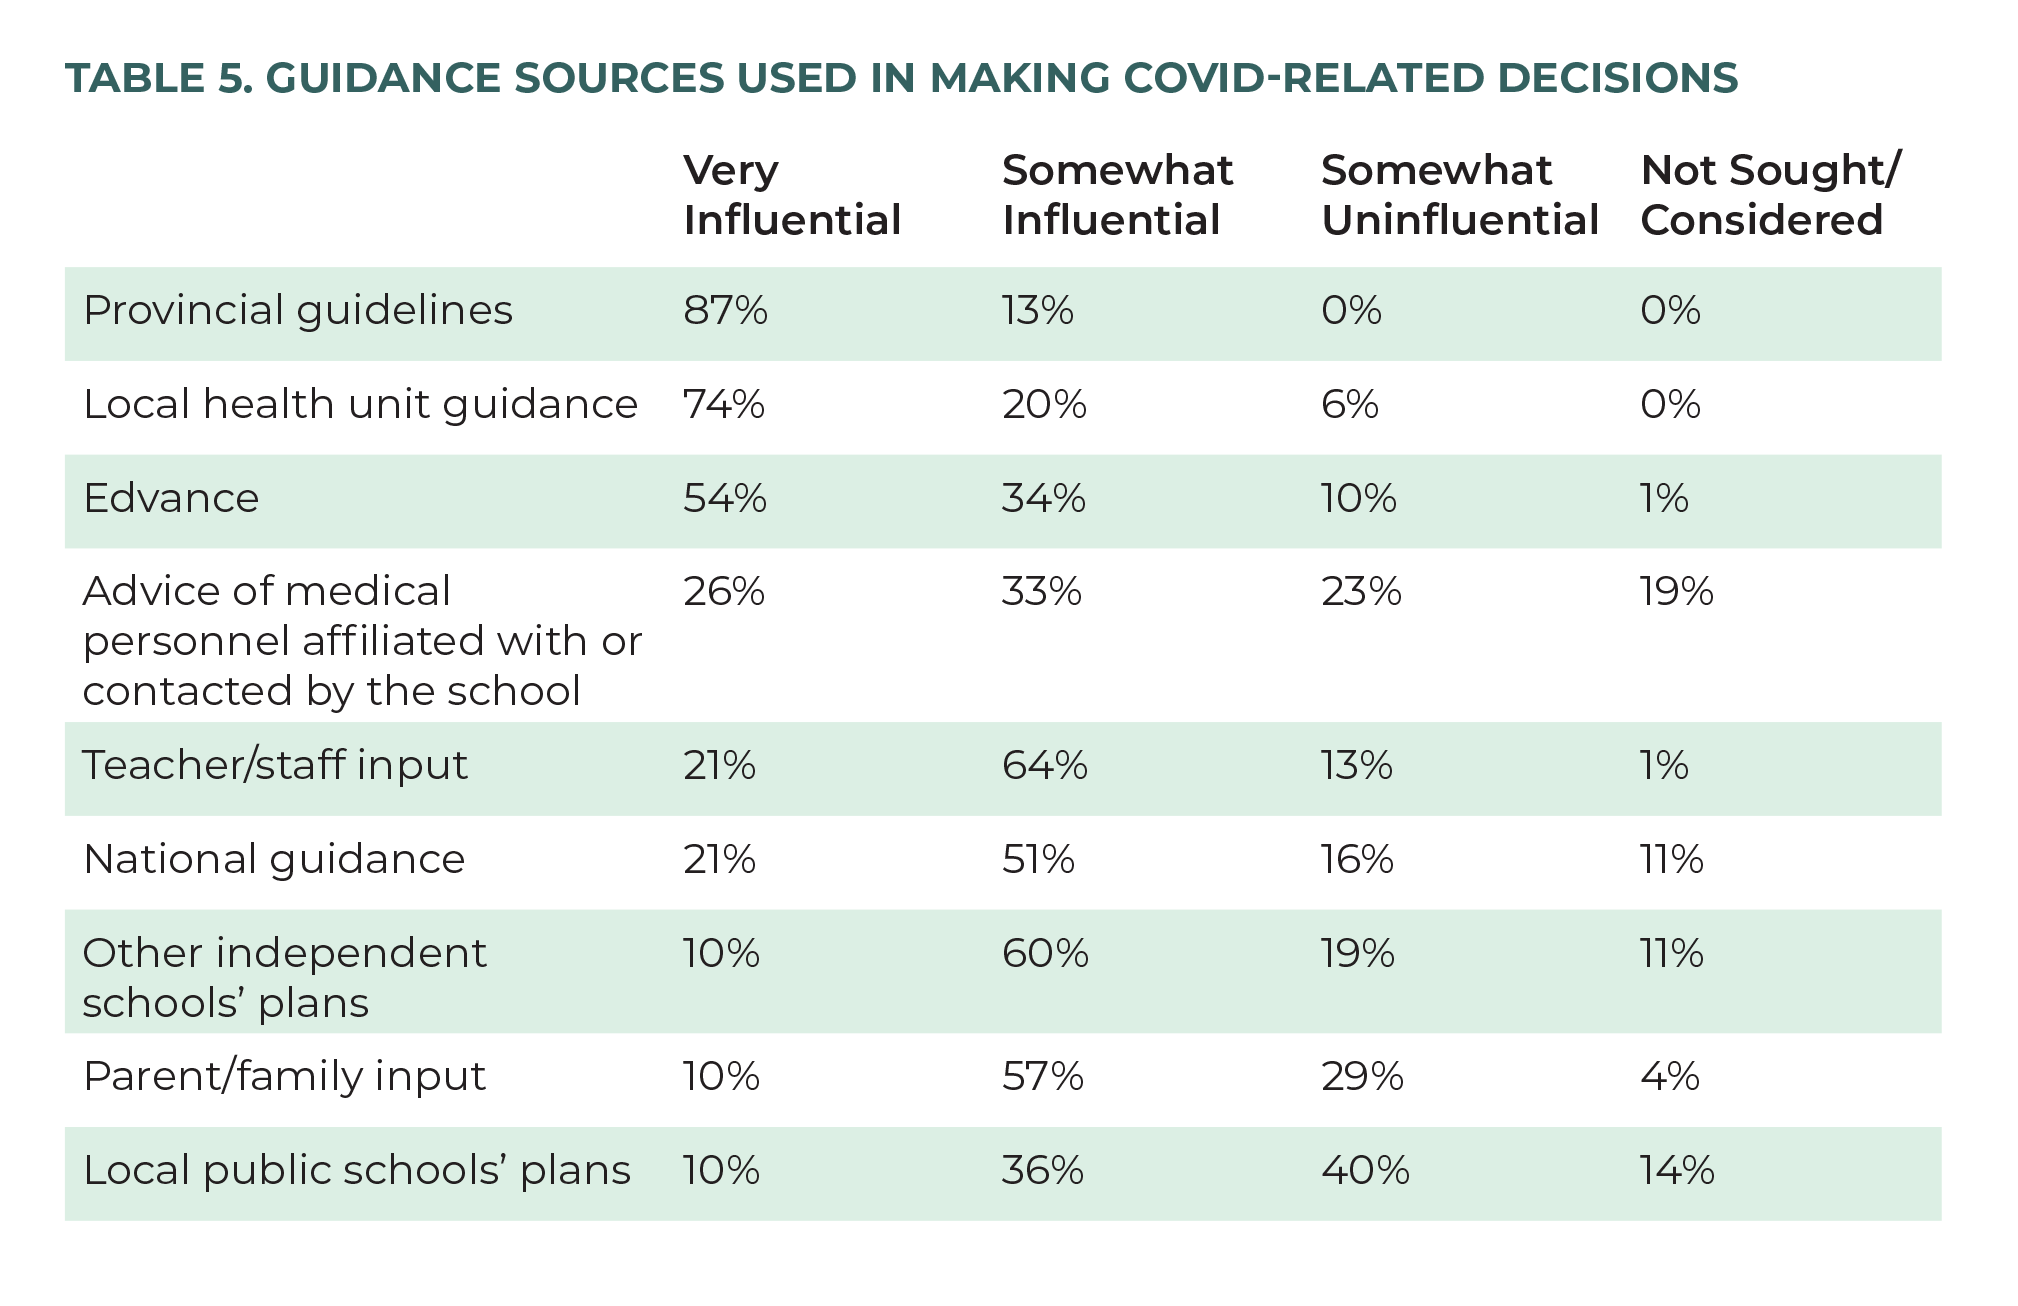
When looking for guidance and direction regarding school-related COVID-19 decisions, schools had a few preferred sources. When asked to rate a number of sources on a four-choice scale from Very Influential to Not Sought/Considered, school leaders found provincial guidelines, local health guidelines, and advice from Edvance Christian Schools Association to be the most influential (table 5). Local public school plans were the least influential source of guidance for school leaders.
Independent schools are not fully governed by the Ministry of Education in terms of day-to-day operation, so what was done in public schools did not always apply to the schools in our survey. It also created an information vacuum when the Private Schools and International Education unit within the Ministry of Education did not relay specific independent-school information until a day or two after the initial public-health announcement, by which time independent schools had often needed to proceed with important decisions, without details or clarity, in response to a government announcement to the general public.
Looking Ahead to the 2021–22 School Year
Delivery and Program
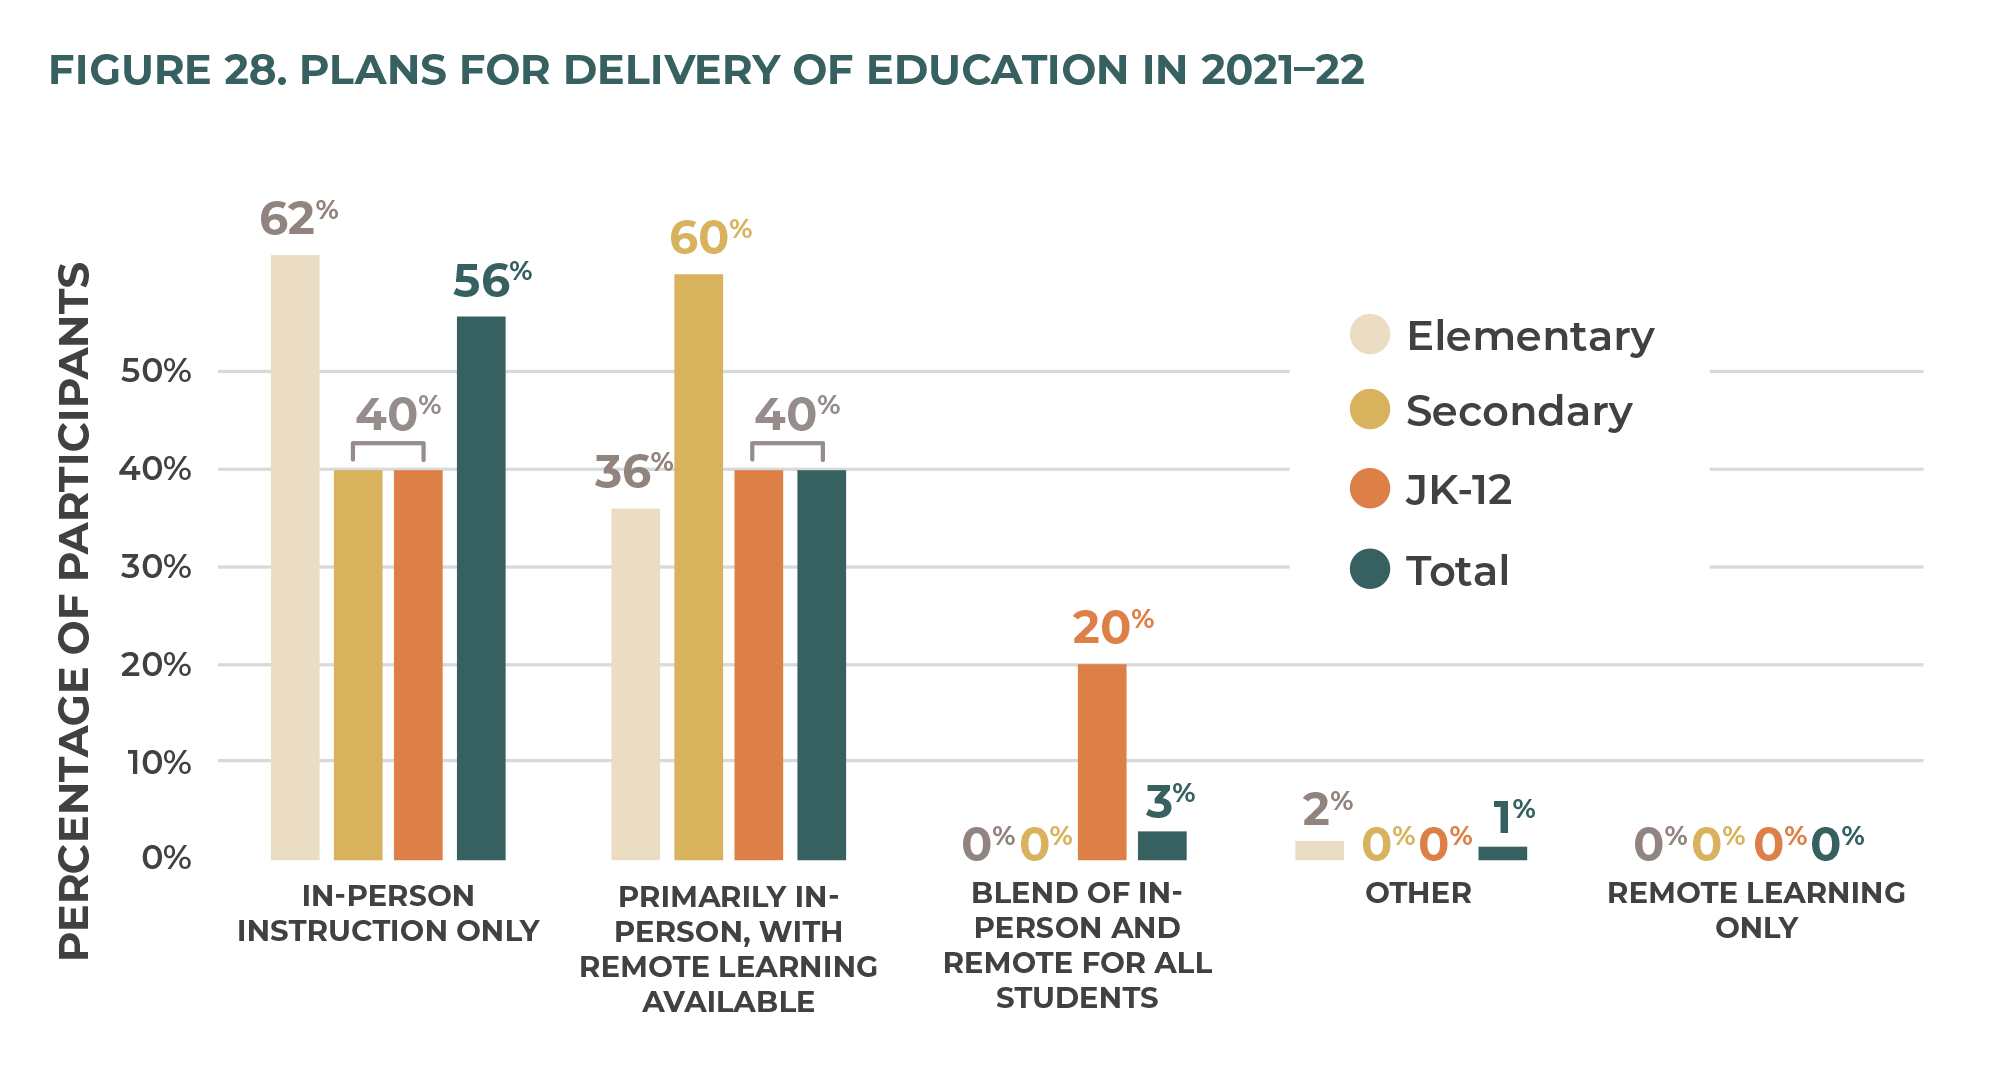
School leaders were asked to think ahead to the 2021–22 school year and describe what they believed would be the educational context and how they were planning for it. When asked about their plans for educational delivery, most schools (56 percent) were planning for in-person instruction only. When disaggregated by school type, almost two thirds of elementary schools (62 percent) were planning for in-person only, and 40 percent of secondary schools and JK–12 schools were planning this way. Some schools (40 percent) were planning for some level of remote learning, with secondary schools leading the way (60 percent). No schools were planning for remote learning only, and just three percent of schools were considering a blend of in-person and remote learning (figure 28).
Much of the planning for the 2021–22 school year is contingent, awaiting the government’s specific COVID-19 restrictions. The Ministry of Education stated in May 2021 that all schools should plan for a multiple-scenario approach to September 2021, much like they did for September 2020. 24 24 S. Jonas, “Ontario Schools to Stick with Online Learning for Now Despite Vaccines Coming for Youth,” CBC News, May 13, 2021, https://www.cbc.ca/news/canada/toronto/ontario-schools-remain-in-pandemic-mode-fornow-1.6025774. This type of ambiguity has left students, parents, teachers, and administrators feeling uncertain about the upcoming year. There is an underlying fear that the pandemic-pivot days of quick transition between remote and face-to-face learning are not over, despite currently low infection numbers, high vaccination rates, and other positive public-health metrics.
Scheduling
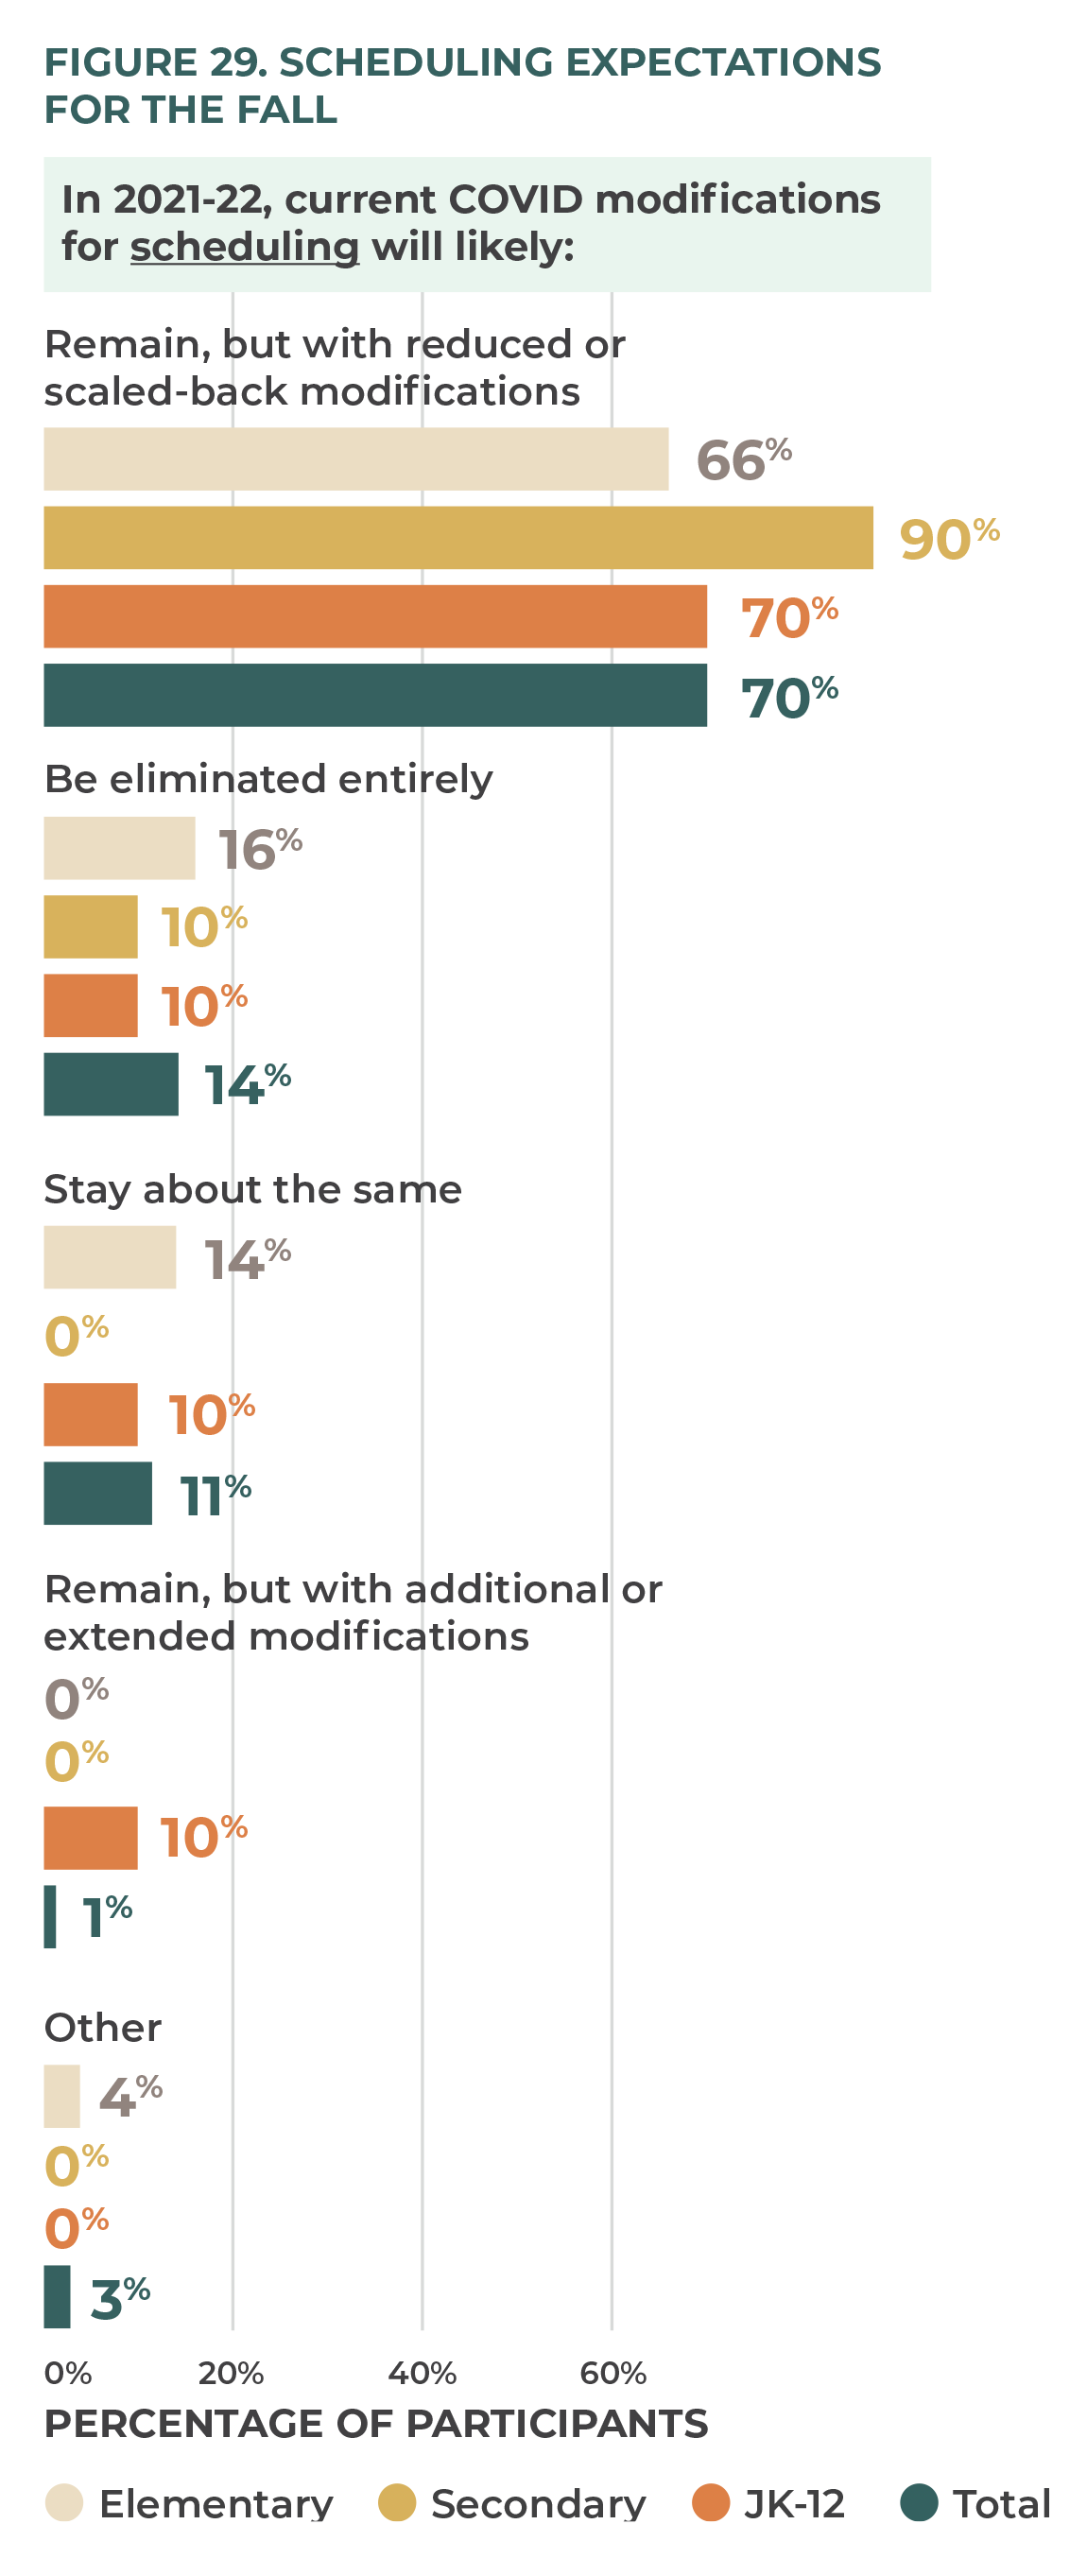
Respondents were asked to predict what level of scheduling modifications they expected to be in place in September 2021. The majority (70 percent) believed that many of the current modifications would remain but would be scaled back. Some respondents believed that modifications would be eliminated entirely (14 percent) or would stay approximately the same (11 percent) (figure 29).
Space Usage
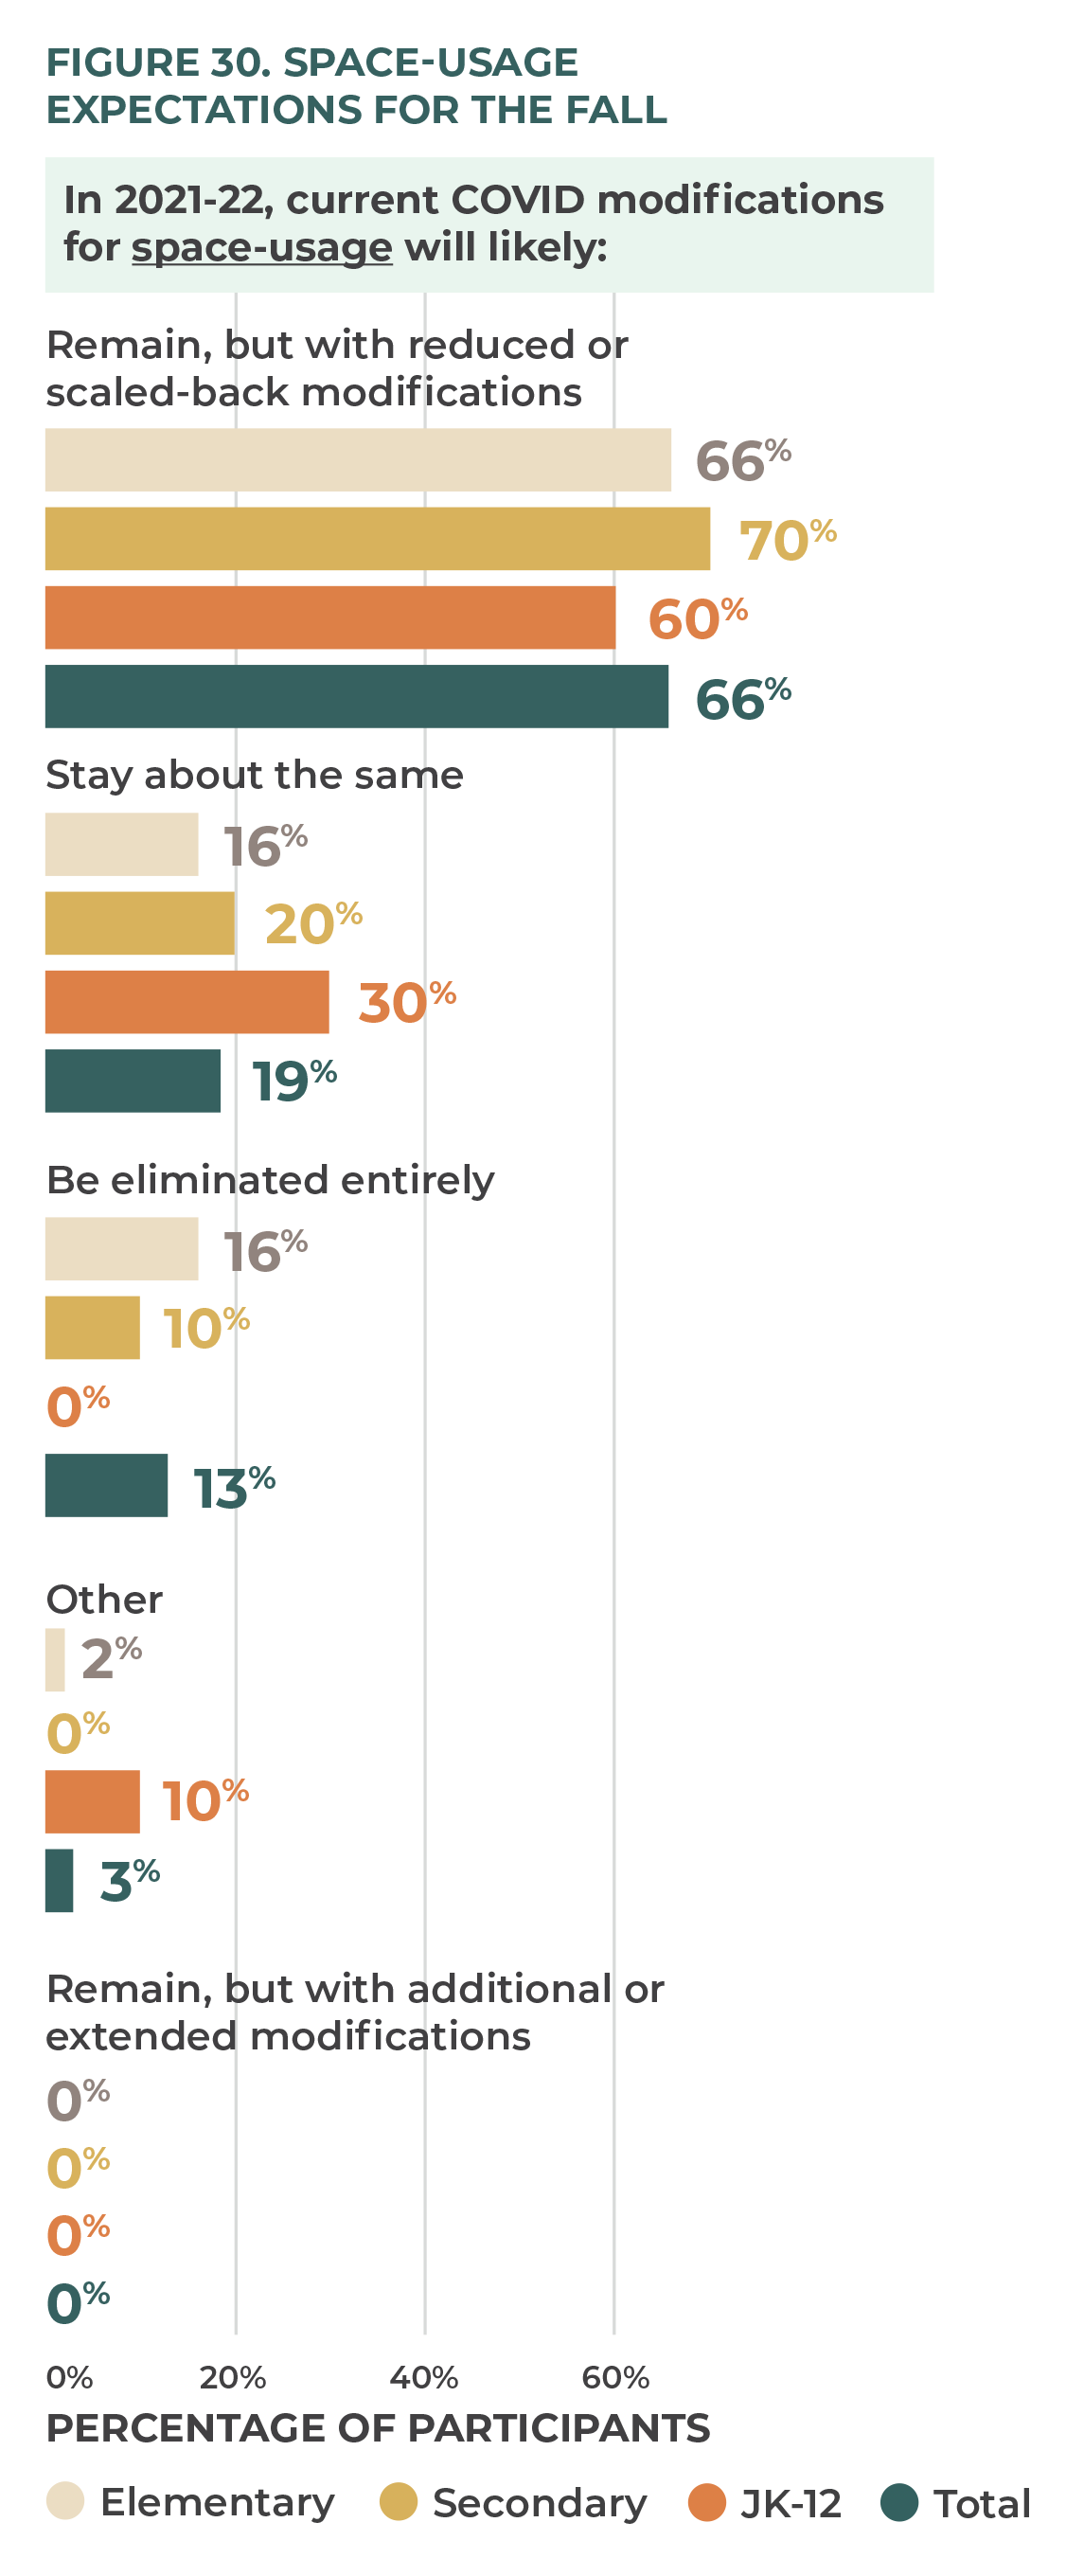
When asked about how they are planning for space usage and possible modifications needed, two-thirds of respondents (66 percent) believed that much would stay the same but with reduced modifications. Approximately one-fifth (19 percent) believed that nothing would change, and approximately one-eighth (13 percent) believed that all modifications would be eliminated entirely (figure 30).
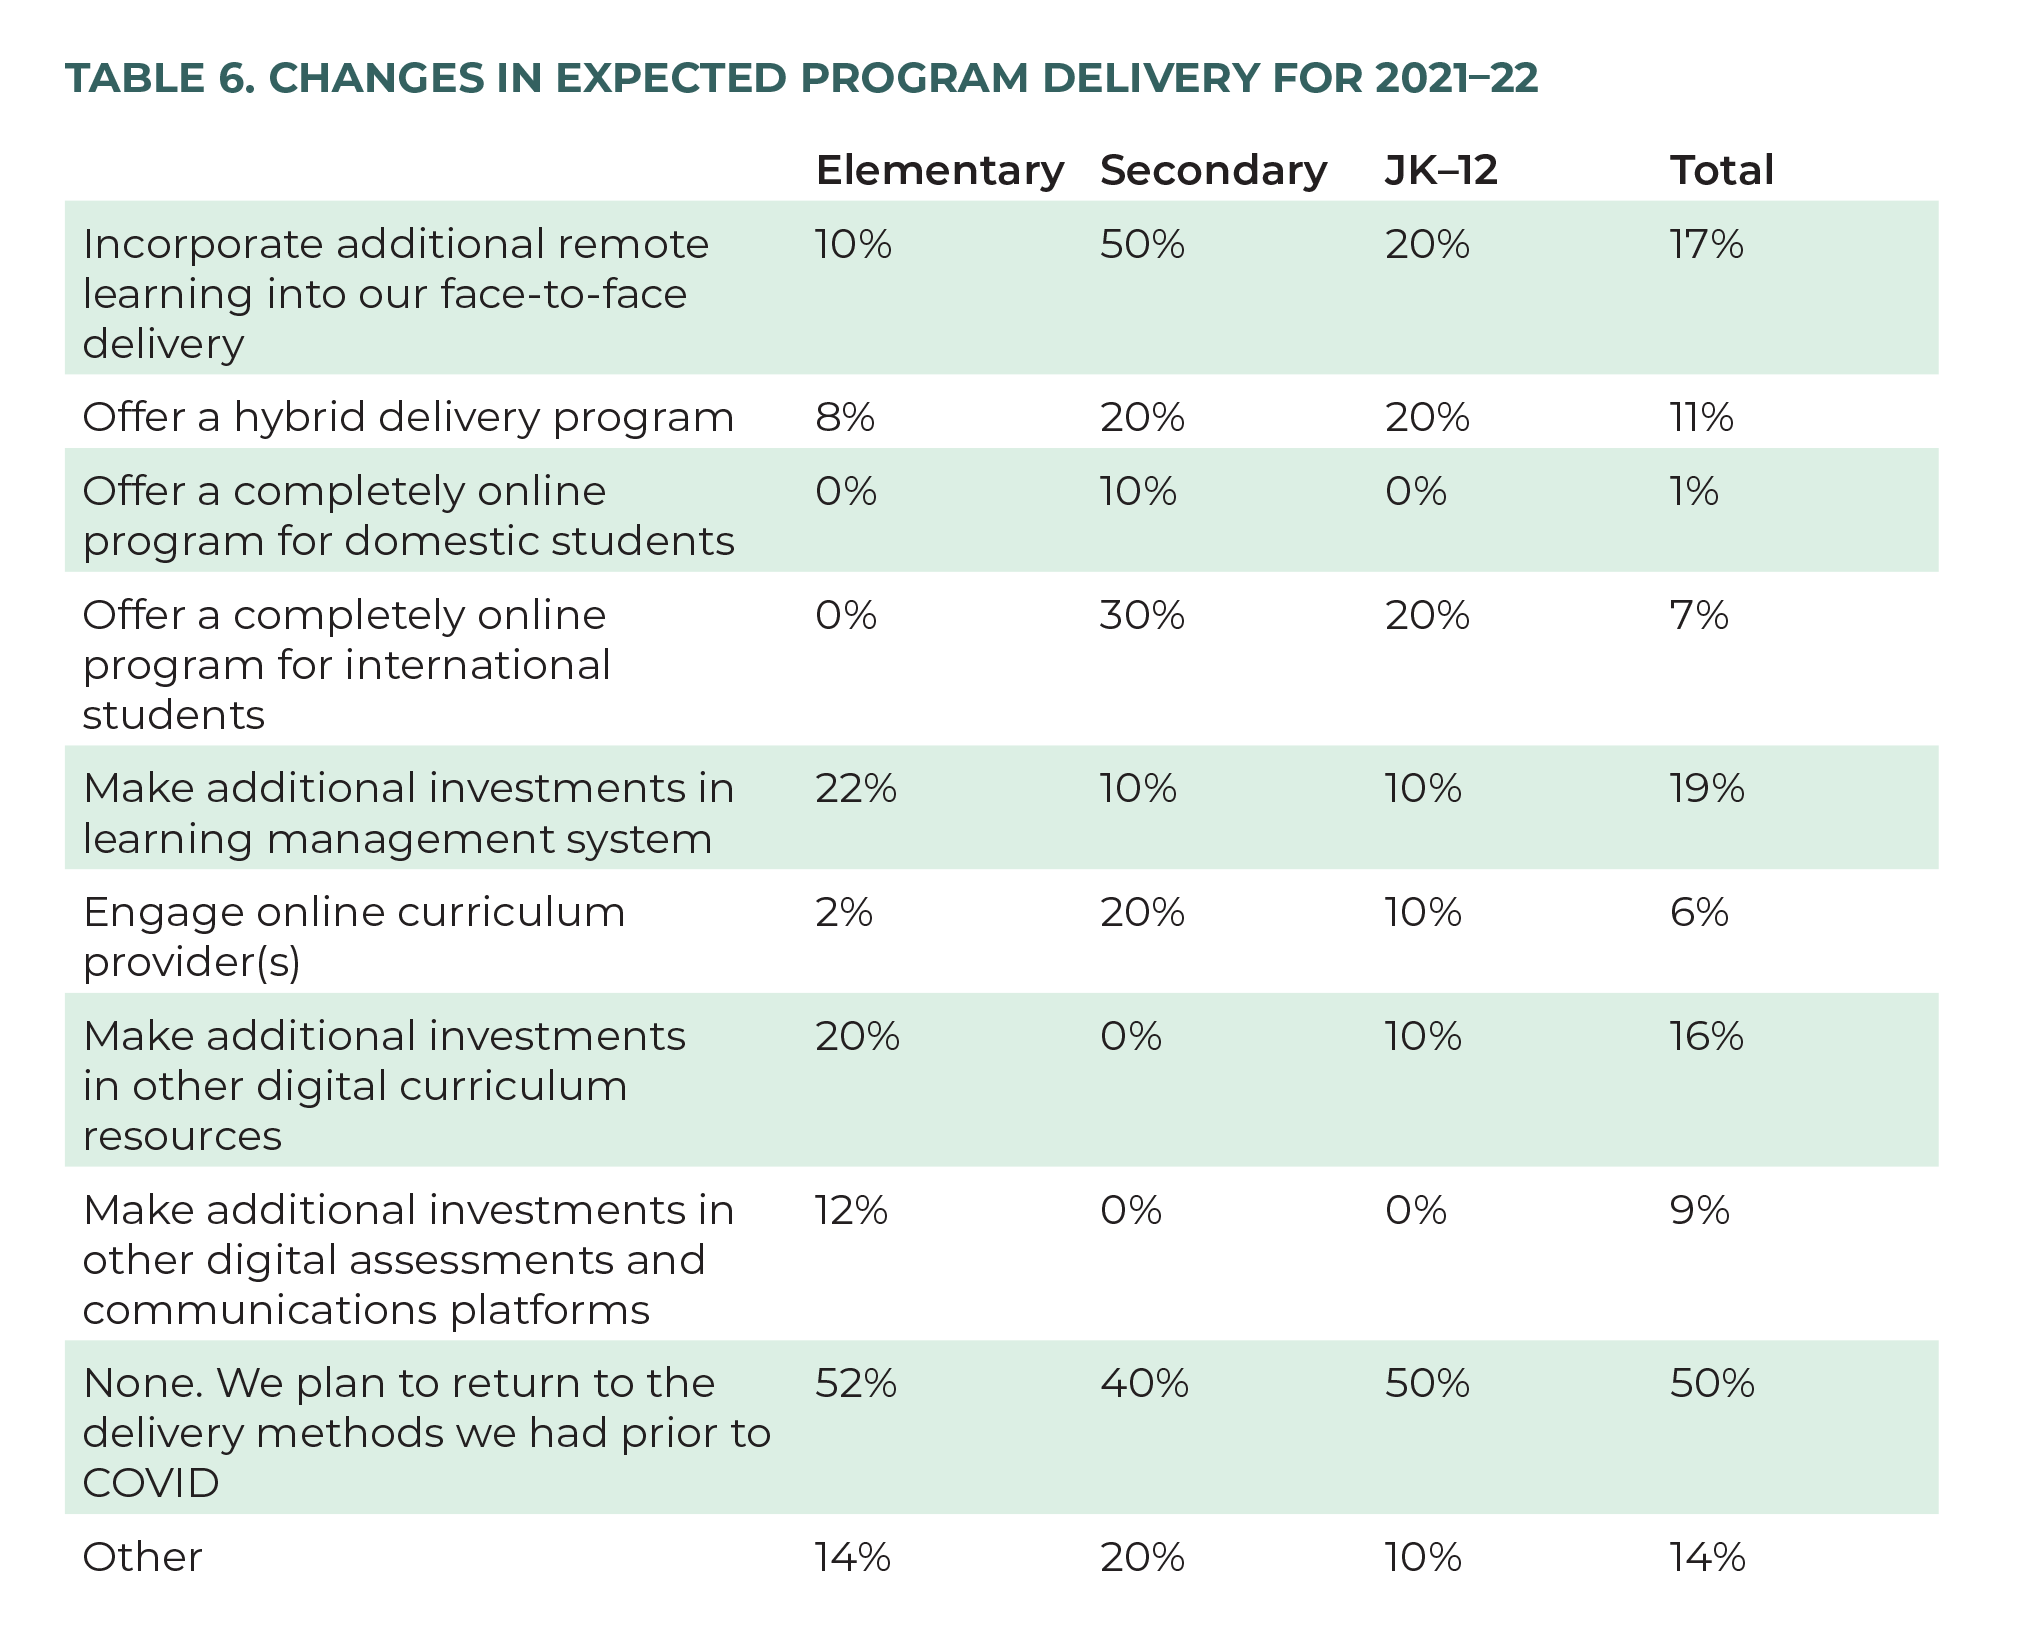
We provided a number of options for school leaders to choose from, regarding how they were considering making changes to their instructional delivery in 2021–22. Half of all respondent schools (50 percent) were not planning to make any changes and were looking to return to regular face-to-face instructional delivery. Half of secondary schools, however, reported that they were planning to incorporate additional remote learning into their regular face-to-face program. Nearly one-third of secondary schools (30 percent) reported planning for a completely remote option for their international student program (table 6).
Anticipated Enrolment
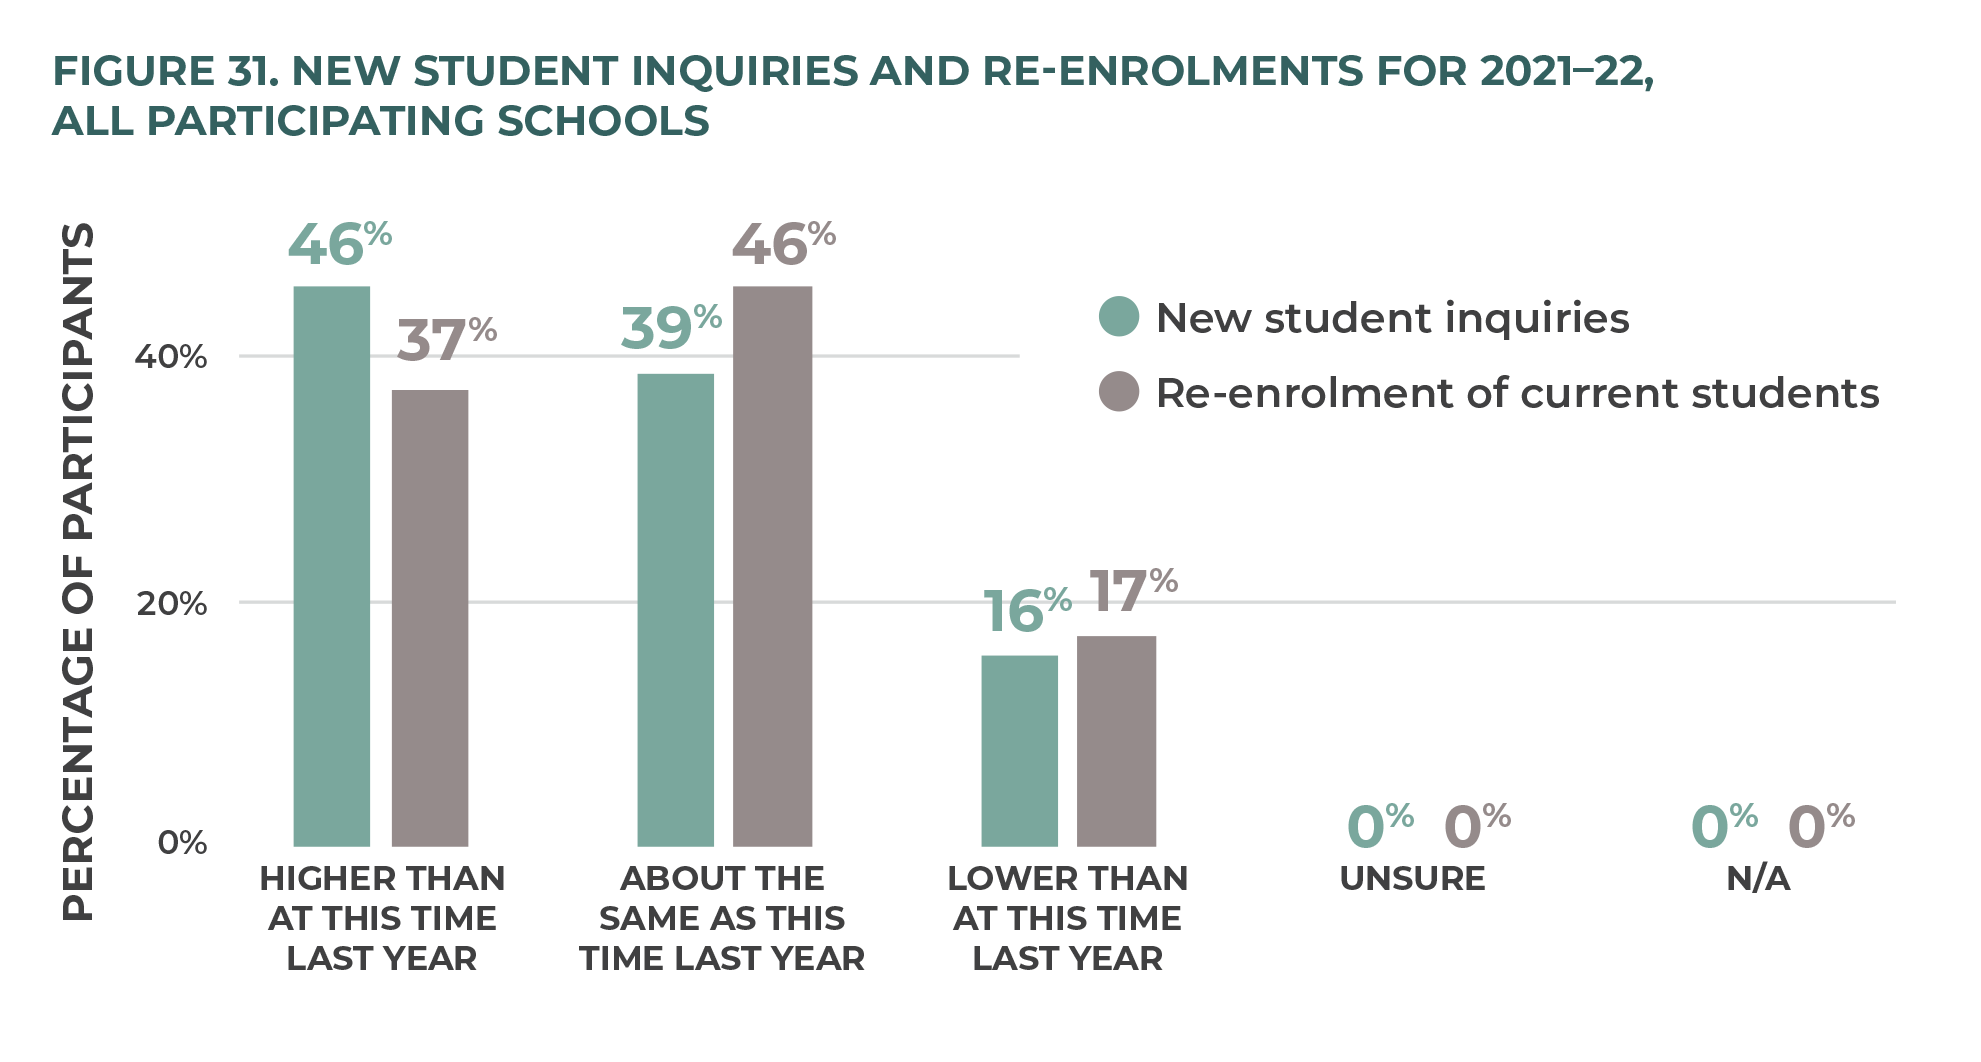
Respondents were asked to consider their present enrolment interest and projections compared to previous years. About one-sixth of schools (16 percent) indicated that their new student inquiries were lower than at the same time last year, and a near-identical 17 percent indicated that re-enrolment of current students is anticipated to be lower than at the same time in the previous year (figure 31).
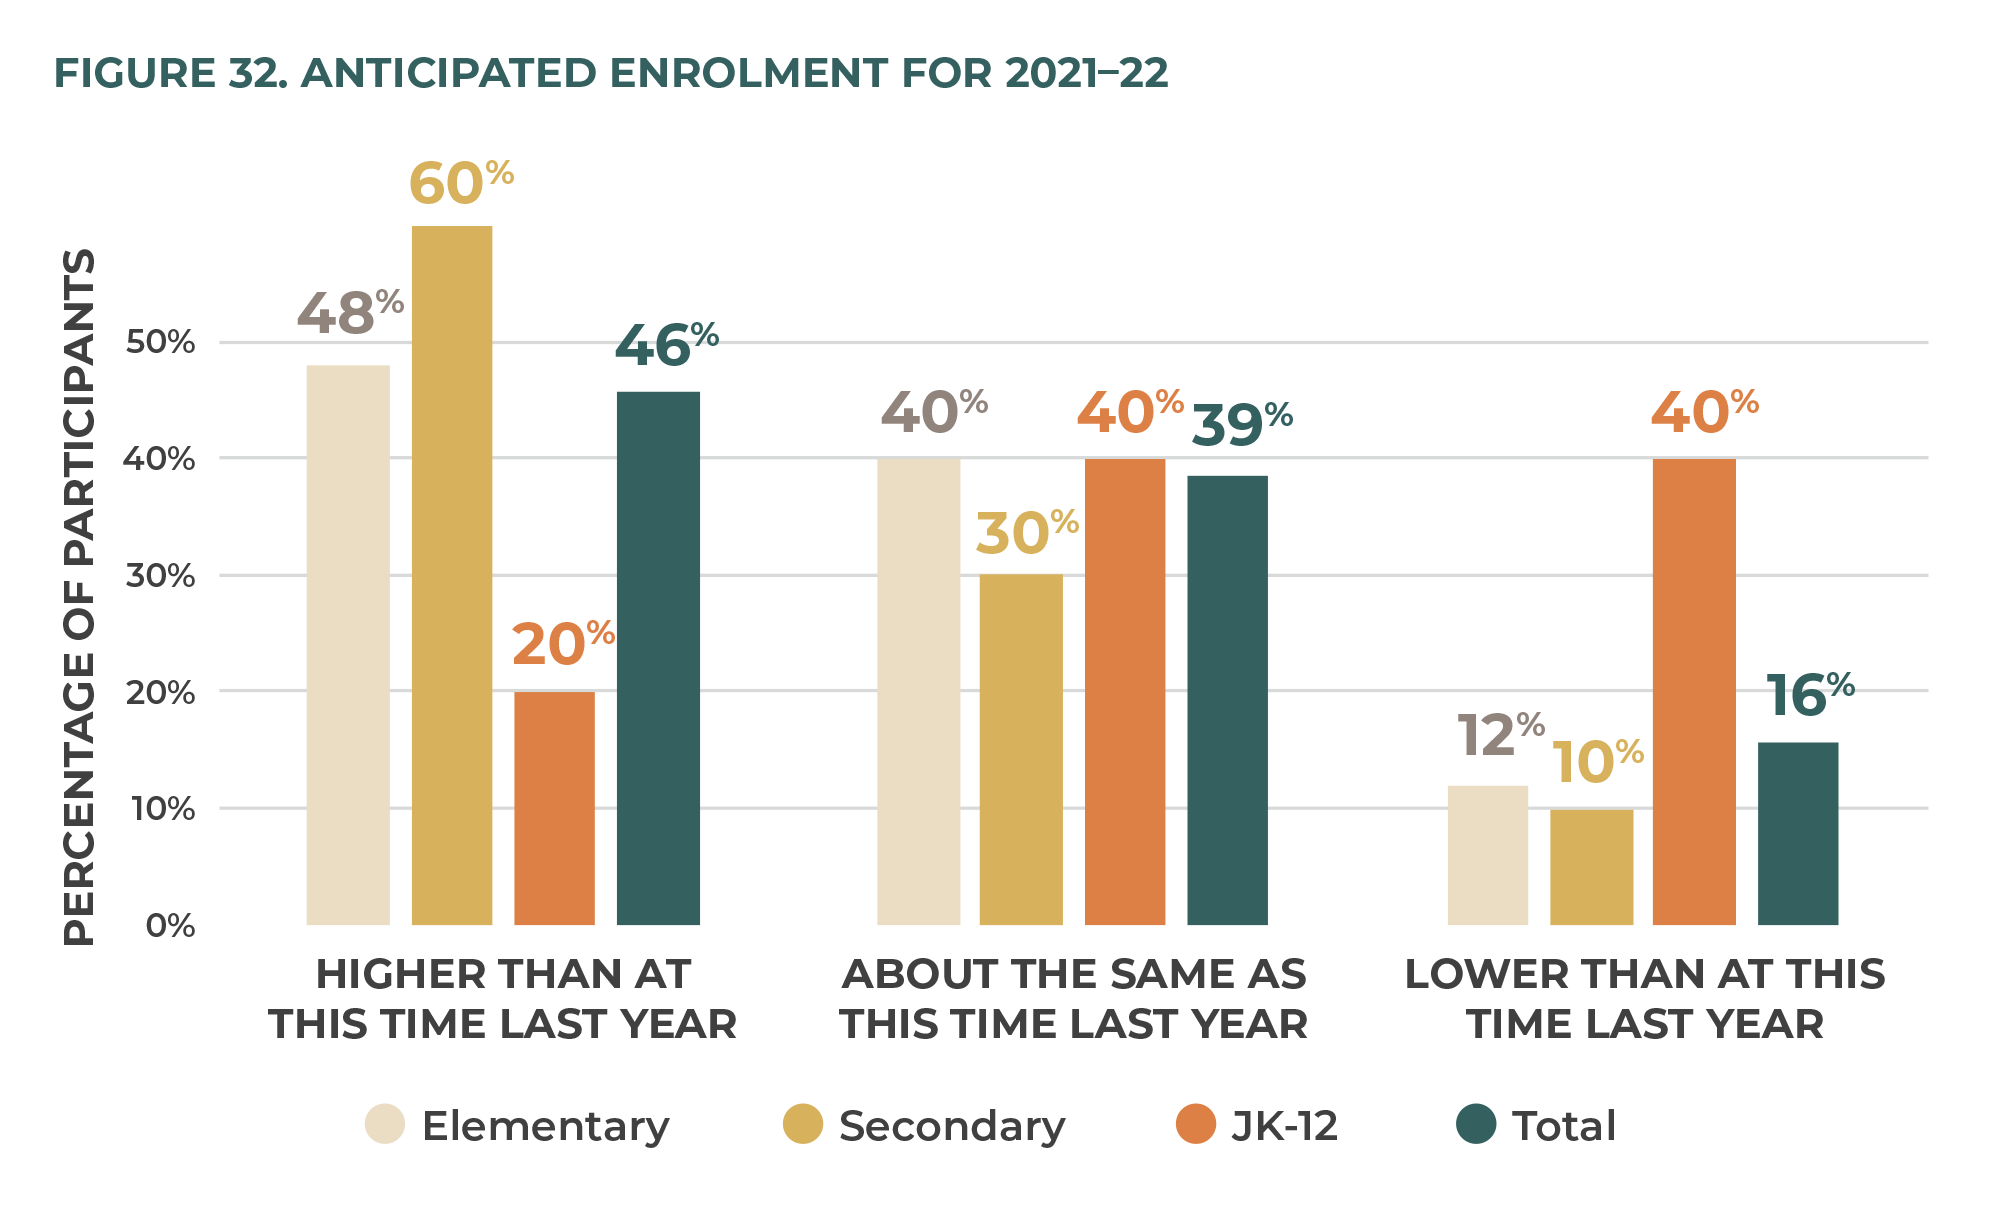
Only 10 percent of secondary schools and 12 percent of elementary schools anticipated lower enrolment in September 2021, whereas 40 percent of JK–12 schools anticipated lower enrolment in the coming school year (figure 32).
Schools showed optimism about their enrolment if education returns to face-to-face learning at the beginning of 2021–22, with 79 percent reporting that they expected their enrolment to increase in this scenario (figure 33). Overall, September 2021 enrolment is expected to increase by 7 percent (900 students, in the schools surveyed).
Planning for 2021–22
School leaders were asked to estimate the extent to which certain areas of school life might change. The only area in which respondents expected significant upward change was in nonacademic offerings such as sports and extracurriculars. Over three-quarters (76 percent) of respondents expected this area to either significantly or somewhat increase. For most other areas, respondents indicated that things would stay the same. Over one-quarter (27 percent), however, expected that international student enrolment would decrease (table 7).
Stories
Schools were offered the opportunity to share stories about how they and their community responded to the pandemic. Some of those stories have been quoted in this report. There were commonalities in the stories of generosity and adaptability.
Generosity
The independent school sector bore the cost of safely educating students and operating healthy schools during a pandemic, without the provincial government support that the public and Roman Catholic separate school sectors received. Many schools made upgrades to buildings, rented additional space, or provided technology to families that needed it. They also often hired additional staff to cover hybrid models of learning, increased sanitization, and organized additional classes to follow cohorting guidelines. This was in addition to the costs of hand sanitizer, face masks, face shields, and other forms of personal protective equipment (PPE) implemented during this time. These increases in operating costs were coupled with some schools providing tuition relief to families adversely affected financially by the various lockdowns.
Fundraising sales and events were moved online or did not happen, due to restrictions on public gatherings. Even with these challenges, 76 percent of respondents indicated that their monetary donations had either increased or remained the same as previous years, and 20 percent reported their in-kind donations continued (an additional 4 percent saw increase). Schools noted that there was a shift in this category to more in-kind services donated (e.g., plumbing, electrical, landscaping), or they took the form of donated PPE. They also reported that community members offered rental space, PPE, or other items at a significant discount, which was not accounted for in our survey but mentioned in the “good news” stories at the end. For example, “Our community came together in a powerful way to support those families who identified a financial need. We set a goal of $100,000, and the community met it by donating $103,000.”
Also noteworthy were schools’ efforts to continue their philanthropic commitments to the broader community. One principal reflected on their event, saying,
“We held a food drive (looked a bit different due to COVID-19, obviously) this year in partnership with a local food bank. When we submitted the goods to this organization, they were so encouraged and thankful, as they stated that their donations are way down as we were the only school that did a food drive that year. We overwhelmed them with our generosity, and it made us reflective regarding how our other education partners removed some elements of their school years that drastically affected their community partners.”
Adaptability
Schools faced a daunting task in September 2020. Schools were told to have three plans in place, to reflect three different scenarios that schools could face: 1) a normal school day with enhanced public health protocols, 2) cohorting and alternative day or weekly delivery, or 3) athome learning with enhanced remote delivery. In addition to the need for various reopening or transition plans, there were the expected protocols such as how to manage staffing and cohort dismissal if a case of COVID-19 was found in the school. Additionally, screening procedures and requirements changed as the school year progressed, meaning that schools had to adjust to new rules and keep their school community informed and up to date. Multiple school closures through the year, differing from region to region, and in some cases given at the end of the school day, meant that schools needed to navigate transitions exceptionally well, to have a solid plan in place covering multiple contingencies, and to do so while providing solid curricular support, creative assessment, and meaningful social connection for students. This is highlighted by one principal sharing,
“We are grateful that we have been able to pivot quickly and efficiently. Our families have appreciated that we’ve been able to offer blended learning (during in-person classes) when symptomatic students had to spend blocks of time at home. We’ve loaned close to 100 devices (iPads and Chromebooks) to our families so that we could build a synchronous learning school day model during ‘stay at home’ periods. Learning packet exchange days (Mondays) have become a highlight with our staff/leadership engaging in connecting conversations with families. The entire day is dedicated to face-to-face conversations about students and families.
It should also be mentioned that schools needed to find alternate ways to communicate with families and the broader community. Access to the school building was limited in all schools that responded to the survey. Principals indicated that weekly emails, notes home, phone calls, and virtual chapel and parent-teacher conferences, while not the normal way of communicating with families, saw some surprising benefits. List 2 shows the various ways that schools remained engaged.
This list demonstrates the variety of ways that schools were able to stay connected and the creative ways they were able to maintain their school culture and community during very challenging times.
Overall, the stories from our independent schools are ones of hope, perseverance, and civic responsibility. Schools moved forward with programs, developing new and innovative ways to teach and connect with their students. Communities came together in a time of crisis and supported those around them. Independent schools showed that they can rise to a challenge and come out stronger and with vitality.
Summary, Conclusions, and Discussion
This paper reports the findings of a May 2021 survey of school leaders in Ontario independent schools affiliated with Edvance Christian Schools Association (83 percent participation rate). Almost three-quarters of respondents were elementary schools (71 percent), and just over three-quarters (77 percent) have fewer than 300 students.
The survey finds that overall enrolments increased in the sector over the previous year. Although education was interrupted by two switches from in-person to remote learning, significant modifications were responsively made to the academic programs, to health and safety protocols, and to financial continuity within this sector. Despite the challenges of operating during a global pandemic, school leaders, educators, parents, board members, donors, and students responded together with creativity and speed—and look forward to the coming year with hope.
The analysis of the responses to questions on education delivery, community connection, and school operations combine to reveal a story of resilience, agility, malleability, care, and resourcefulness. The generosity and adaptability of the schools and their communities is in part due to the autonomous nature of independent schooling in Ontario and may hold promise for future school design and delivery in other settings (including government-operated schools). This report also briefly highlights the Ontario government’s failure to channel the allocated federal funds toward the health
and safety of all students, including students in Ontario’s independent school sector. This fact cannot be dismissed in future reviews of government policy and action during the COVID-19 pandemic.
Autonomy Leads to Resilience and Agility
Independent schools are by their very nature unique. While some, like those affiliated with Edvance, share common beliefs or values, each school has its own culture, traditions, community base, and method of operating. Independent schools have demonstrated the ability to be nimble in adapting to changes, whether these are needed to run the school more efficiently or arise from the need to adapt to changes in policy and procedure. Independent schools are able to do this because of the high level of autonomy they have.
Ontario independent schools have shown significant capacity to adjust their operations to ever-changing regulations and expectations. Throughout this survey, evidence has been uncovered that this cohort of Christian schools are not only outwardly agile and nimble to changes within the educational landscape but also intentionally structured to do so.
An example of this agility can be found in the independent sector’s response to the provincial government’s allowance of in-person, outdoor graduation ceremonies as announced in early June 2021. Many respondents indicated that they had a number of plans in place, including a plan for in-person, outdoor graduations if they were permitted to do so. This may be compared to the apparent inability or unwillingness of Ontario’s publicly funded schools to rapidly alter graduation plans. A CTV News article quoted the Ontario Principals’ Council as saying,
“We are being asked to revert and pivot again, to cancel graduation plans already in place and organize outdoor events amid social distancing restrictions. . . . It is unrealistic and disrespectful to Ontario educators to expect such a considerable shift in planning at this point in the school year.” 25 25 N. Thompson, “Principals, School Boards Question Ontario’s Plan to Host Outdoor Graduations for All,” CTV News, June 3, 2021, https://toronto.ctvnews.ca/principals-school-boards-question-ontario-s-plan-to-host-outdoorgraduations-for-all-1.5454793.
This is in direct contrast to the apparent readiness of independent schools in Ontario to change course, if permitted to do so. Thirtysix percent of respondent schools stated that their plans were “still to be determined” as they awaited direction from the provincial government and local health organizations.
Further, schools were able to determine how to implement the provincial and public health unit guidelines. They were able to make schedule changes that best suited their needs. They adapted traffic flow patterns, barriers, and entry and exit points based on what was best for the school community.
Tied in with the basic decision-making autonomy was the ability to allocate resources and funds to make their plans feasible. Public school principals have very little control about where or how money is allocated. So even when working in one geographic area or public health unit catchment, schools needed very different things to make their reopening plans a success. Some had older buildings that needed new or upgraded equipment, such as HVAC systems, while other (newer) schools struggled to make adjustments in room designations. This is a case where more school autonomy would allow schools to target the areas most in need of attention.
Learning Malleability
As they did with the Spring 2020 emergency school closures, independent schools showed an ability to transition quickly to and from inperson learning to remote learning throughout the 2020–21 school year. They also showed an ability to adapt to the unique needs of their individual learning communities. In independent schools, school leaders were able to respond to local circumstances, student needs, and age ability of students, to shape the education that worked for their school. A number of examples emerged from this study.
Whereas in the spring of 2020 independent schools exceeded provincial guidelines regarding hours of remote learning per day, the 2021 school year saw a different trend emerge. In publicly funded schools, teachers were given a mandated number of minutes per day that children were to be engaged in synchronous learning. For independent schools, our survey found that the number of hours that students were engaged in synchronous learning varied from school to school and from grade to grade. For example, whereas 3.75 hours of synchronous instruction was expected in all grades in public schools, only four out of fifty schools that delivered this type of instruction for JK and SK students in independent schools reported delivering between three to five hours per day. This may be an indication of the concern that independent schools and their educators had with regard to extended periods of time that students spend online. UNICEF, for example, warns that increased time spent online due to isolation, school closures, and stay-at-home orders may also put children at heightened risk of susceptibility to predatory online behaviour such as sexual exploitation, cyberbullying, online risk-taking behaviour, exposure to potentially harmful content (e.g., violent content, misinformation about COVID-19, targeted marketing), and inappropriate collection, use, and sharing of data. 26 26 Ontario COVID-19 Science Advisory Table, “COVID-19 and Education Disruption in Ontario.”
Another example that shows independent schools’ malleability in educational delivery can be found in the reported remote-learning tools that the schools used. Ninety-three percent of schools that delivered remote learning for JK–SK students reported that they developed packages of tangible learning materials and distributed them to students’ homes. This measure allowed for the youngest students being taught remotely in Edvance schools to have variability in their educational resources, as opposed to simply filling hours in front of a device and screen.
Mental Health and Well Being of Students, Staff, and Leaders
When asked about their areas of concern, leaders in Edvance schools overwhelmingly pointed to the effects that the school closures and remote learning had on their various stakeholders. Some of the highest levels of concern were related to student mental health and academic performance, and the stress levels, workload, and mental health of teachers and school leaders.
Certainly, the mental health of children in Ontario schools was a topic of strong public scrutiny when decisions around school closures were top of mind. This was affirmed by Children’s Mental Health Ontario in the document “Schools are Essential,” citing a report from SickKids claiming that 70 percent of children had developed worse mental health since the beginning of the pandemic. Further, “Children with no previous diagnoses are now experiencing higher rates of depression, anxiety, irritability, and inattention.” 27 27 Children’s Mental Health Ontario, “Schools are Essential,” https://cmho.org/schools-are-essential/. Not mentioned but increasingly being studied are the effects that school closures may have on academic performance, which could in turn have economic effects on individuals and the economy at large. The Ontario COVID-19 Science Advisory Table stated that “Each month of skill loss is predicted to cause (an approximately) one percent drop in lifetime earnings for affected cohorts and is estimated to decrease the national income by 0.5 percent per year, which would translate to a GDP loss for Canada of $1.6 trillion.” 28 28 T. Raymond and C. Praill, “Ontario Science Table Warns of Potential for Long-Term Effects from School Closures,” CTV News, June 5, 2021, https://ottawa.ctvnews.ca/ontario-science-table-warns-of-potential-for-longterm-effects-from-school-closures-1.5457832. In addition to the immediate mental-health ramifications of school closures, it is becoming clearer that there could be long-term economic consequences. This does not take into account the negative effects of increased screen time on children. Harvard Medical School has commented on the negative aspects of screen time, stating that “digital devices can interfere with everything from sleep to creativity.” 29 29 D.B. Ruder, “Screen Time and the Brain,” Harvard Medical School, June 19, 2019, https://hms.harvard.edu/news/screen-time-brain.
Leader respondents were also concerned for the well-being of their staff. A year in which teachers were asked to pivot numerous times from in-person to remote learning took its toll. A recent study by the Alberta Teachers’ Association and Alberta School Employee Benefit Plan found that there was an “alarming number of respondents reporting compassion fatigue, symptoms of burnout were also evident, including physical exhaustion and sensing a lack of feeling appreciated. Eighty-nine percent of respondents reported feeling low energy and almost 70 percent reported an inability to concentrate.” 30 30 A.H. Kendrick, “COVID-19: Steps to Teacher Recovery from Burnout During the Pandemic and Beyond,” Orillia Matters, January 24, 2021, https://www.orilliamatters.com/around-ontario/COVID-19-steps-to-teacherrecovery-from-burnout-during-the-pandemic-and-beyond-3257512. Leaders, perhaps with some humility, also reported being concerned for their own well-being and that of their colleagues—73 percent claimed that they were somewhat or very concerned about the level of workload placed on principals. This is in line with a survey by People for Education, in which 49 percent of principals from inperson and hybrid schools said that their levels of stress were not manageable. 31 31 D. Paglinawan, “COVID-19 Pandemic Taking a Toll on Ontario School Principals, Survey Suggests,” CP24 News, February 23, 2021, https://www.cp24.com/mobile/news/COVID-19-pandemic-taking-a-toll-on-ontarioschool-principals-survey-suggests-1.5320167?cache=almppngbro%3FclipId%3D68596.
Our survey respondents’ levels of concern for well-being did not, however, translate to increased mental-health programs in the respondent school. While 63 percent of respondents reported having some programs in place to support their staff in this way, only 20 percent reported having an intentional plan in place. It would be advisable for school boards to devise intentional ways to invest in programs to ensure their teachers and leadership have the well-being supports that are needed for the COVID exit. It would also be advisable for schools to recognize that student mental health and academic preparedness will have been affected in varying ways and to have supports ready accordingly.
Financial Resourcefulness
Once again, independent schools showed a strong ability to manage their finances in a locally wise and prudent manner, allowing them to weather the crisis and provide a program that met the needs of their families and students. When our survey was last done, school leaders were not optimistic that their
finances would be able to withstand continued school closures.
32
32
Marcus, Van Pelt, and Boven, “Pandemic Pivot.”
Participant schools did show an overall decline in student enrolment from spring 2020 to fall 2020. No schools closed, however, which is a testament to their nimbleness in financing operations—through items such as rare lay-offs, redistribution of budgets such as professional development, and creative fundraising initiatives.
Sixty percent of schools were even able to continue providing tuition assistance to their families in need. While many schools were able to access federal government-support programs such as the Canada Emergency Wage Subsidy, many were not able to access these funds until well after initial school-year budgets were created in the spring of 2020. Of note, as well, is the importance of philanthropy to this
sector. While most schools reported a decrease in fundraising dollars (such as those raised through public events), only one in five schools reported a decrease in monetary donations.
Moreover, despite the provincial government withholding federal health funds allocated for all students during the health crisis, independent schools found ways to be resourceful and innovative to get through
the crisis amid ever-changing government regulations and demands.
Need for Equitable Student Health and Safety Programs
Independent schools in Ontario are in a unique position in that they are treated as private businesses from a funding point of view but governed by the same health and safety requirements as the publicly funded school sector. All costs related to health and safety requirements and modifications were borne by individual schools and their own financing plans. For many schools, this meant running deficit budgets, raising tuition fees, fundraising additional monies, or using volunteer help.
In January 2021, Ontario Education Minister Stephen Lecce sent a letter to all Ontario schools—including independent schools—stating the following:
“To ensure our schools remain safe in January 2021 and beyond, we will continue and enhance testing in schools and allocate a new and significant investment in school safety, including in enhanced air quality, more PPE, and additional staffing and cleaning. We will do whatever it takes to ensure our kids can continue to learn.” 33 33 S. Lecce, “Letter to Parents,” Ontario Ministry of Education, January 2, 2021, https://www.ontario.ca/page/letter-ontarios-parents-ministereducation#section-2.
Continued advocacy efforts did not result in equitable health and safety funding for “our kids,” that is, all students in Ontario. One in fourteen students (150,666) 34 34 Statistics Canada, “Table 1: Number and proportion of students in elementary and secondary schools, by school type, Canada, provinces and territories, 2018/2019,” October 15, 2020, https://www150.statcan.gc.ca/n1/daily-quotidien/201015/t001a-eng.htm. —attending one in four Ontario schools—did not benefit from any provincial funding for their health and safety at the school that they attended. The authors of this paper hold that this is a discriminatory practice and that all students, regardless of where they attend school, should have access to the same funds that are earmarked for the safety of their Ontario peers. Pandemics do not discriminate.
References
Children’s Mental Health Ontario. “Schools are Essential.” https://cmho.org/schools-are-essential/.
Clemens, J., S. Parvani, and J. Emes. “Comparing the Family Income of Students in British Columbia’s Independent and Public Schools.” Fraser Institute, March 2017. https://www.fraserinstitute.org/sites/default/files/comparing-family-income-of-students-in-BCs-independent-and-public-schools.pdf.
Government of Ontario. “Reopening Ontario (A Flexible Response to COVID-19) Act, 2020, Ontario Regulation 278/21.” April 14, 2021. https://www.ontario.ca/laws/regulation/r21278.
Jonas, S. “Ontario Schools to Stick with Online Learning for Now Despite Vaccines Coming for Youth.” CBC News, May 13, 2021. https://www.cbc.ca/news/canada/toronto/ontarioschools-remain-in-pandemic-mode-for-now-1.6025774.
Kendrick, A.H. “COVID-19: Steps to Teacher Recovery from Burnout During the Pandemic and Beyond.” Orillia Matters, January 24, 2021. https://www.orilliamatters.com/around-ontario/COVID-19-steps-to-teacher-recovery-from-burnout-during-the-pandemic-and-beyond-3257512.
Lecce, S. “Letter to Parents.” Ontario Ministry of Education, January 2, 2021. https://www.ontario.ca/page/letter-ontarios-parents-minister-education#section-2.
MacLeod, A., S. Parvani, and J. Emes. “Comparing the Family Income of Students in Alberta’s Independent and Public Schools.” Fraser Institute, October 2017. https://www.fraserinstitute.org/sites/default/files/comparing-the-family-income-of-students-in-albertas-independent-and-public-schools.pdf.
Marcus, P., D. Van Pelt, and T. Boven. “Pandemic Pivot: Christian Independent Schooling During the Initial 2020 Lockdown.” Cardus, 2021. https://www.cardus.ca/research/education/reports/pandemic-pivot/.
Office of the Premier. “Ontario Announces Provincewide Shutdown to Stop Spread of COVID-19 and Save Lives.” Government of Ontario, December 21, 2020. https://news.ontario.ca/en/release/59790/ontario-announces-provincewide-shutdown-to-stop-spread-of-COVID-19-and-save-lives.
______. “Ontario Moves Schools to Remote Learning Following Spring Break.” Government of Ontario, April 12, 2021. https://news.ontario.ca/en/release/61106/ontario-moves-schoolsto-remote-learning-following-spring-break.
______. “Remote Learning to Continue across Ontario for the Remainder of School Year.”
Government of Ontario, June 2, 2021. https://news.ontario.ca/en/release/1000251/remotelearning-to-continue-across-ontario-for-the-remainder-of-school-year.
______. “Statement from Premier Ford, Minister Elliott, and Minister Lecce on the 2019 Novel
Coronavirus (COVID-19).” Government of Ontario, March 12, 2020. https://news.ontario.ca/opo/en/2020/03/title.html.
Ontario COVID-19 Science Advisory Table. “COVID-19 and Education Disruption in Ontario: Emerging Evidence on Impacts.” June 4, 2021. Updated June 16, 2021. https://doi.org/10.47326/ocsat.2021.02.34.1.0.
Ontario Ministry of Education. “Guide to Reopening Ontario’s Schools.” July 30, 2020. Updated March 2, 2021. https://www.ontario.ca/page/guide-reopening-ontarios-schools.
______. “Ontario Delays March Break in an Effort to Reduce Community Transmission of COVID-19.” February 11, 2021. https://news.ontario.ca/en/statement/60325/ontariodelays-march-break-in-an-effort-to-reduce-community-transmission-of-COVID-19.
______. “Policy/Program Memorandum No. 164.” August 13, 2020. http://www.edu.gov.on.ca/extra/eng/ppm/164.html.
______. “Schools Return to In-Person Learning.” February 11, 2021. Updated March 4, 2021. http://www.edu.gov.on.ca/eng/parents/returning-to-in-person-learning.html.
Paglinawan, D. “COVID-19 Pandemic Taking a Toll on Ontario School Principals, Survey Suggests.” CP24 News, February 23, 2021. https://www.cp24.com/mobile/news/COVID19-pandemic-taking-a-toll-on-ontario-school-principals-survey-suggests-1.5320167?cache=almppngbro%3FclipId%3D68596.
People for Education. “Missing Out: The Visible and Invisible Loss of Extracurricular Activities.”
April 18, 2021. https://peopleforeducation.ca/our-work/missing-out-the-visible-and-invisible-loss-of-extracurricular-activities/.
Raymond, T., and C. Praill. “Ontario Science Table Warns of Potential for Long-Term Effects from School Closures.” CTV News, June 5, 2021. https://ottawa.ctvnews.ca/ontario-sciencetable-warns-of-potential-for-long-term-effects-from-school-closures-1.5457832.
Ruder, D.B. “Screen Time and the Brain.” Harvard Medical School, June 19, 2019. https://hms.harvard.edu/news/screen-time-brain.
Statistics Canada. “Table 1: Number and proportion of students in elementary and secondary schools, by school type, Canada, provinces and territories, 2018/2019.” October 15, 2020.
https://www150.statcan.gc.ca/n1/daily-quotidien/201015/t001a-eng.htm.
Swaner, L.E., and M.H. Lee. “Christian Schools and COVID-19: 2020–2021 School Profile.” Colorado Springs: Association of Christian Schools International, 2020.
Thompson, N. “Principals, School Boards Question Ontario’s Plan to Host Outdoor Graduations for All.” CTV News, June 3, 2021. https://toronto.ctvnews.ca/principals-school-boardsquestion-ontario-s-plan-to-host-outdoor-graduations-for-all-1.5454793.
Van Pelt, D., D. Hunt, and J. Wolfert. “Who Chooses Ontario Independent Schools and Why?” Cardus, September 9, 2019. https://www.cardus.ca/research/education/reports/who-chooses-ontario-independent-schools-and-why/.
The appendices are in the pdf version found at the top of this page.