Table of Contents
Table of Contents
Executive Summary
Canada is one of the wealthiest and freest countries of the world. Its vast territory and plentiful resources provide nearly boundless opportunities to its citizens. Its commitment to “peace, order, and good government” offers its citizens a place to build a life, raise a family, and enjoy the fruits of their labour. Canada consistently ranks as one of the most desirable destinations of immigrants and refugees from around the world.
Yet these benefits are not shared equally by all. Ironically, those who have inhabited this land the longest—Indigenous people—are among those who least benefit from the country’s riches. The relationship between Canada and Indigenous people has been a difficult one, rooted in a complex, often tragic history.
The purpose of this paper is to consider whether the economic welfare of Indigenous people in Canada has improved in the last several years. Our goal is to examine the nature and extent of the gap between Indigenous and non-Indigenous Canadians on various economic measures. We focus on whether this gap between Indigenous people and the rest of the country has changed since the apology by the Government of Canada in 2008 for Indian Residential Schools, and if so, how.
Our findings are not encouraging. The data suggest that not much has changed in the past fourteen years with respect to employment and labour-force participation rates among Indigenous people, which are still lower than for other Canadians. Indigenous workers earn less on average than non-Indigenous workers, despite working more hours per week. Average Indigenous income and educational attainment also remain below the national average. Where improvements in employment and participation rates have occurred, they have been marginal at best and have not been shared equally across the country. However, there have been hopeful signs, particularly in promising gains in Indigenous educational attainment. While these developments have not always translated to meaningful improvements in employment rates, they may hold the keys to future prosperity.
The persistence of economic disparities is troubling and raises important questions for all Canadians, especially policy-makers who ought to be working to close the gap. There are hopeful signs of progress in Indigenous people’s small and regional employment gains, but it is clear that much work remains if Canada is to achieve real reconciliation in economic matters.
Introduction
Several steps toward reconciliation have been taken in recent years, including the establishment of the Truth and Reconciliation Commission in 2007, the Harper government’s apology for the Indian Residential Schools in 2008, the Truth and Reconciliation Commission’s findings and Calls to Action in 2015, and the Calls for Justice of the National Inquiry into Missing and Murdered Indigenous Women and Girls in 2019. But apologies and calls to action are no substitute for real action and tangible results.
Economic reconciliation has been touted as an important aspect of the reconciliation project. Much of Canadian public policy toward reconciliation has focused on or stemmed from the Calls to Action of the Truth and Reconciliation Commission. While the Calls to Action are predominantly focused on non-economic matters, there are a handful that address the economic well-being of Indigenous people. Two Calls to Action under the Education category draw attention to the employment and income disparities that Indigenous communities experience:
- We call upon the federal government to develop with Aboriginal groups a joint strategy to eliminate educational and employment gaps between Aboriginal and non-Aboriginal Canadians. 1 1 Truth and Reconciliation Commission of Canada, “Truth and Reconciliation Commission of Canada: Calls to Action,” 2015, 1–2, https://ehprnh2mwo3.exactdn.com/wp-content/uploads/2021/01/Calls_to_Action_English2.pdf. The Indigenous Skills and Employment Training Program, which was developed in consultation with Indigenous partners, received $2 billion over five years and around $400 million per year ongoing in the 2018 federal budget. For more details on this program and for information on federal investments in Indigenous education, see Government of Canada, “Delivering on Truth and Reconciliation Commission Calls to Action: Education,” Crown-Indigenous Relations and Northern Affairs Canada, https://www.rcaanc-cirnac.gc.ca/eng/1524495412051/1557511602225.
- We call upon the federal government to prepare and publish annual reports comparing funding for the education of First Nations children on and off reserves, as well as educational and income attainments of Aboriginal peoples in Canada compared with non-Aboriginal people. 2 2 Truth and Reconciliation Commission, “Calls to Action,” 2. Part of the mandate of Indigenous Services Canada is to deliver an annual report to Parliament that “[describes] the socio-economic gaps between First Nations, Inuit, and Métis individuals and other Canadians and the measures taken by the department to reduce those gaps.” Indigenous Services Canada, “Annual Report to Parliament 2020,” 2020, https://www.sac-isc.gc.ca/eng/1602010609492/1602010631711.
Apart from Call to Action number 55, which includes a reference to the collection of data related to Call to Action number 7, the only other recommendation to address directly economic well-being falls under number 92, “Business and Reconciliation,” which is directed to the corporate sector:
- We call upon the corporate sector in Canada to adopt the United Nations Declaration on the Rights of Indigenous Peoples as a reconciliation framework and to apply its principles, norms, and standards to corporate policy and core operational activities involving Indigenous peoples and their lands and resources. This would include, but not be limited to, the following: . . . Ensure that Aboriginal peoples have equitable access to jobs, training, and education opportunities in the corporate sector, and that Aboriginal communities gain long-term sustainable benefits from economic development projects. 3 3 Truth and Reconciliation Commission, “Calls to Action,” 10.
The Calls to Action also urge both state and non-state actors to implement the United Nations Declaration on the Rights of Indigenous Peoples. Canada fully endorsed the Declaration in 2016; legislation to implement it was introduced in Parliament in December 2020 and was passed into law in June 2021. 4 4 Government of Canada, “Implementing the United Nations Declaration on the Rights of Indigenous Peoples Act,” Department of Justice, https://www.justice.gc.ca/eng/declaration/index.html. Among the Declaration’s articles is a statement that “Indigenous individuals have the right not to be subjected to any discriminatory conditions of labour and, inter alia, employment or salary.” 5 5 United Nations, “United Nations Declaration on the Rights of Indigenous Peoples,” Resolution 61/295 (2007), https://undocs.org/A/RES/61/295.
Taken together, the Calls to Action provide a backdrop for considering the importance of tangible economic progress for Indigenous people. In December 2015, Prime Minister Justin Trudeau expressed Canada’s commitment to implementing all of the Truth and Reconciliation Commission’s recommendations. 6 6 Prime Minister of Canada, “Statement by the Prime Minister on Release of the Final Report of the Truth and Reconciliation Commission, December 15, 2015, https://www.rcaanc-cirnac.gc.ca/eng/1524494530110/1557511412801. But have these apologies and promises translated into effective action in improving their economic well-being of Indigenous people? This paper attempts to answer this question through an analysis of official statistics.
As we show in this paper, the data suggest that this progress has been slow at best. This is concerning not only for economic progress but for progress in social outcomes as well. Past research has shown that stronger economic outcomes lead to better social outcomes, including physical health, mental health, and overall life satisfaction. 7 7 B. Dijkema and M. Gunderson, “Work Is About More than Money,” Cardus, 2019, https://www.cardus.ca/research/work-economics/reports/work-is-about-more-than-money/. The lack of progress so far highlights the urgency to provide Indigenous people with genuine opportunities to participate in the economic life of this country.
There are nevertheless hopeful signs for Indigenous communities, particularly in improvements in levels of educational attainment. While these have not fully translated into substantial improvements in labour-force characteristics, these developments may yet bring forth new opportunities.
We do not pretend to have the solutions, and we recognize that the economic progress of Indigenous communities is a matter that requires continued dialogue between Indigenous and non-Indigenous Canadians. Nevertheless, we start from the premise that apologies must be followed through with measurable action and accountability. It is our hope that the economic metrics outlined in this paper will shine a light on the importance of economic policies and increase pressure on policy-makers to be held accountable for achieving meaningful results.
Methodology
This paper takes up the question of economic reconciliation by examining the economic well-being of Indigenous people and how it has changed since Prime Minister Stephen Harper’s apology in 2008 on behalf of the government of Canada with respect to its role in Indian Residential Schools.
We examine employment indicators, including unemployment, labour-force participation, and employment rates; weekly wages and hours; distribution of workers across industries; income; and education. In most cases, particularly those that involve data from the Labour Force Survey, our comparisons involve the years 2008, 2019, and 2020. The data from 2019, the last year before the onset of the COVID-19 pandemic and the ensuing unprecedented labour market disruptions, are the most recent useful data for comparing long-term, pre-pandemic trends. The data from 2020 offer a glimpse into the initial effects of the pandemic. Both are useful perspectives and both are analyzed here, but we treat the 2020 data with caution when comparing with 2008 because of the impact of the pandemic. For those datasets that involve the census of population, our comparisons are between the years 2006 and 2016, the available censuses closest to our comparison points. Unless otherwise indicated, the Statistics Canada data used in this paper are for adults aged twenty-five to fifty-four.
Most of the data used in this paper are taken from Statistics Canada publications and as such use the same definitions and categories. In some cases, we have used the term “Indigenous” instead of “Aboriginal” where Statistics Canada uses them interchangeably. In some instances, statistics about Inuit persons are not available from Statistics Canada owing to overly small sample sizes. Wherever these data are available from Statistics Canada, we have included them.
A final, crucial note about the data: Statistics Canada’s Labour Force Survey excludes “persons living on reserves and other Indigenous settlements in the provinces, as well as those living in the territories.” 8 8 See Statistics Canada, “Table 14-10-0359-01: Labour Force Characteristics by Indigenous Group and Educational Attainment,” note 1, https://doi.org/10.25318/1410035901-eng. Throughout this report, we have indicated this problem by using the language of “First Nations off reserve” to refer to the narrower population that are included in the Labour Force Survey. This is a significant problem in the official statistics of Canada and a major blind spot for analysts and policy-makers. Furthermore, Statistics Canada notes that some of the data we examine in this paper suffer from “incomplete enumeration of certain Indian reserves and Indian settlements in the Census of Population.” 9 9 See Statistics Canada, 2016 Census of Population, Statistics Canada Catalogue Number 98-400-X2016174, note 1, https://www12.statcan.gc.ca/census-recensement/2016/dp-pd/dt-td/Rp-eng.cfm?LANG=E&APATH=3&DETAIL=0&DIM=0&FL=A&FREE=0&GC=0&GID=0&GK=0&GRP=1&PID=111814&PRID=10&PTYPE=109445&S=0&SHOWALL=0&SUB=0&Temporal=2017&THEME=122&VID=0&VNAMEE=&VNAMEF=. With these caveats in mind, we analyze and present the official statistics that are available to us.
The Economic Well-Being of Indigenous People
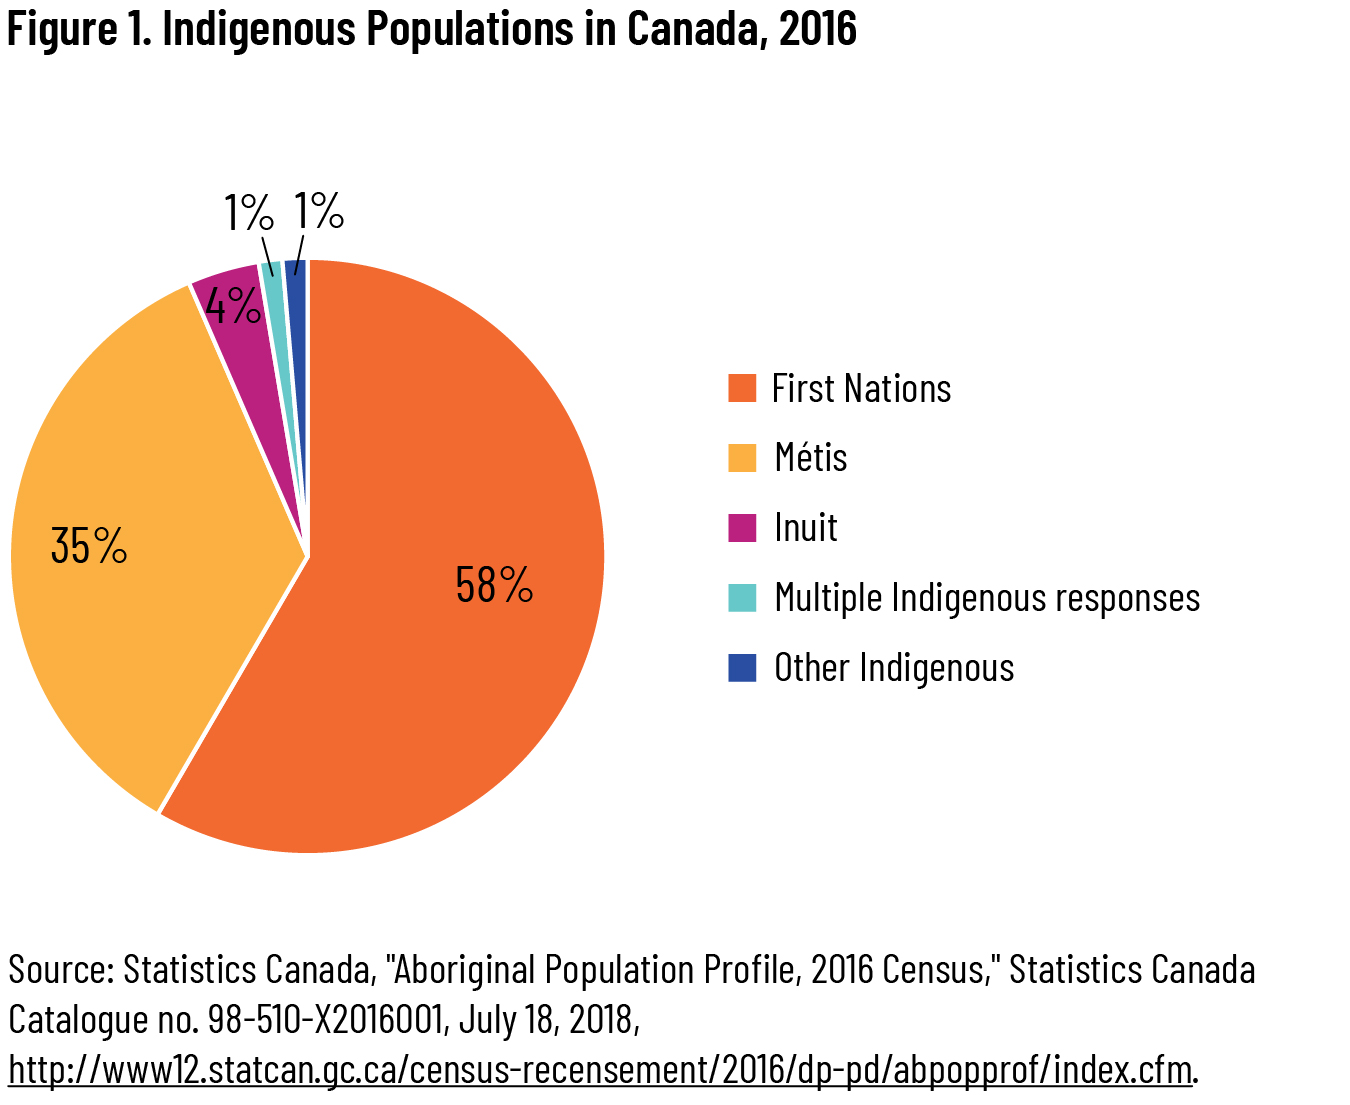
Indigenous people make up about 5 percent of Canada’s population, with over 1.67 million Canadians self-identifying as Indigenous on the 2016 census. This figure represents an increase of more than 40 percent since 2006, four times more than the population growth of Canada as a whole. The rapid growth of the Indigenous population is driven by both natural growth (increased life expectancy, relatively high fertility rates) and an increase in the number of Canadians newly identifying themselves on the census as Indigenous. 10 10 Statistics Canada, “First Nations People, Métis and Inuit in Canada: Diverse and Growing Populations,” March 20, 2018, https://www150.statcan.gc.ca/n1/pub/89-659-x/89-659-x2018001-eng.htm.
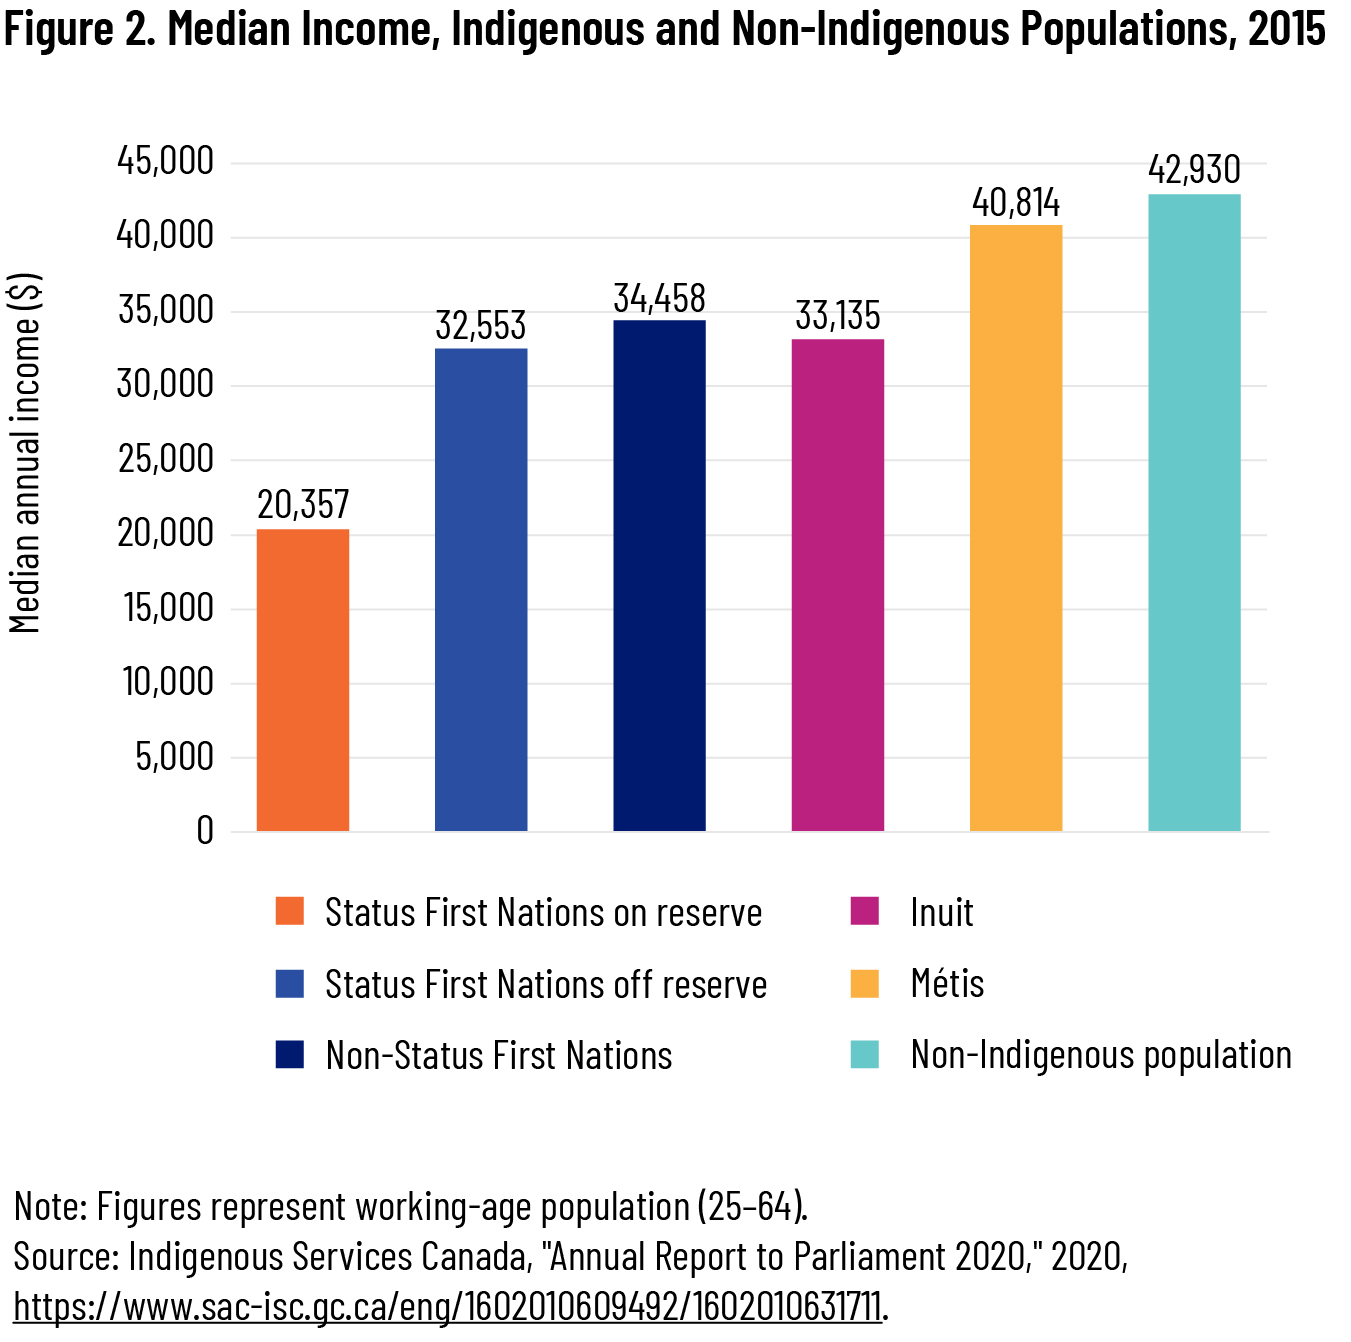
As the Truth and Reconciliation Commission’s Calls to Action indicate, Indigenous people experience worse economic outcomes than the rest of the country across a range of measures. In addition to employment disparities, which we review in detail below, there are income disparities between Indigenous and non-Indigenous populations. In 2015, the gap is smallest for Métis, whose median income is 95 percent of the median income of non-Indigenous Canadians. First Nations living off reserve and Inuit, meanwhile, earn between three-quarters and four-fifths (76 to 80 percent) of the non-Indigenous median. The income gap is largest for First Nations living on reserve, whose median income is less than half (47 percent) that of their non-Indigenous counterparts (see figure 2).
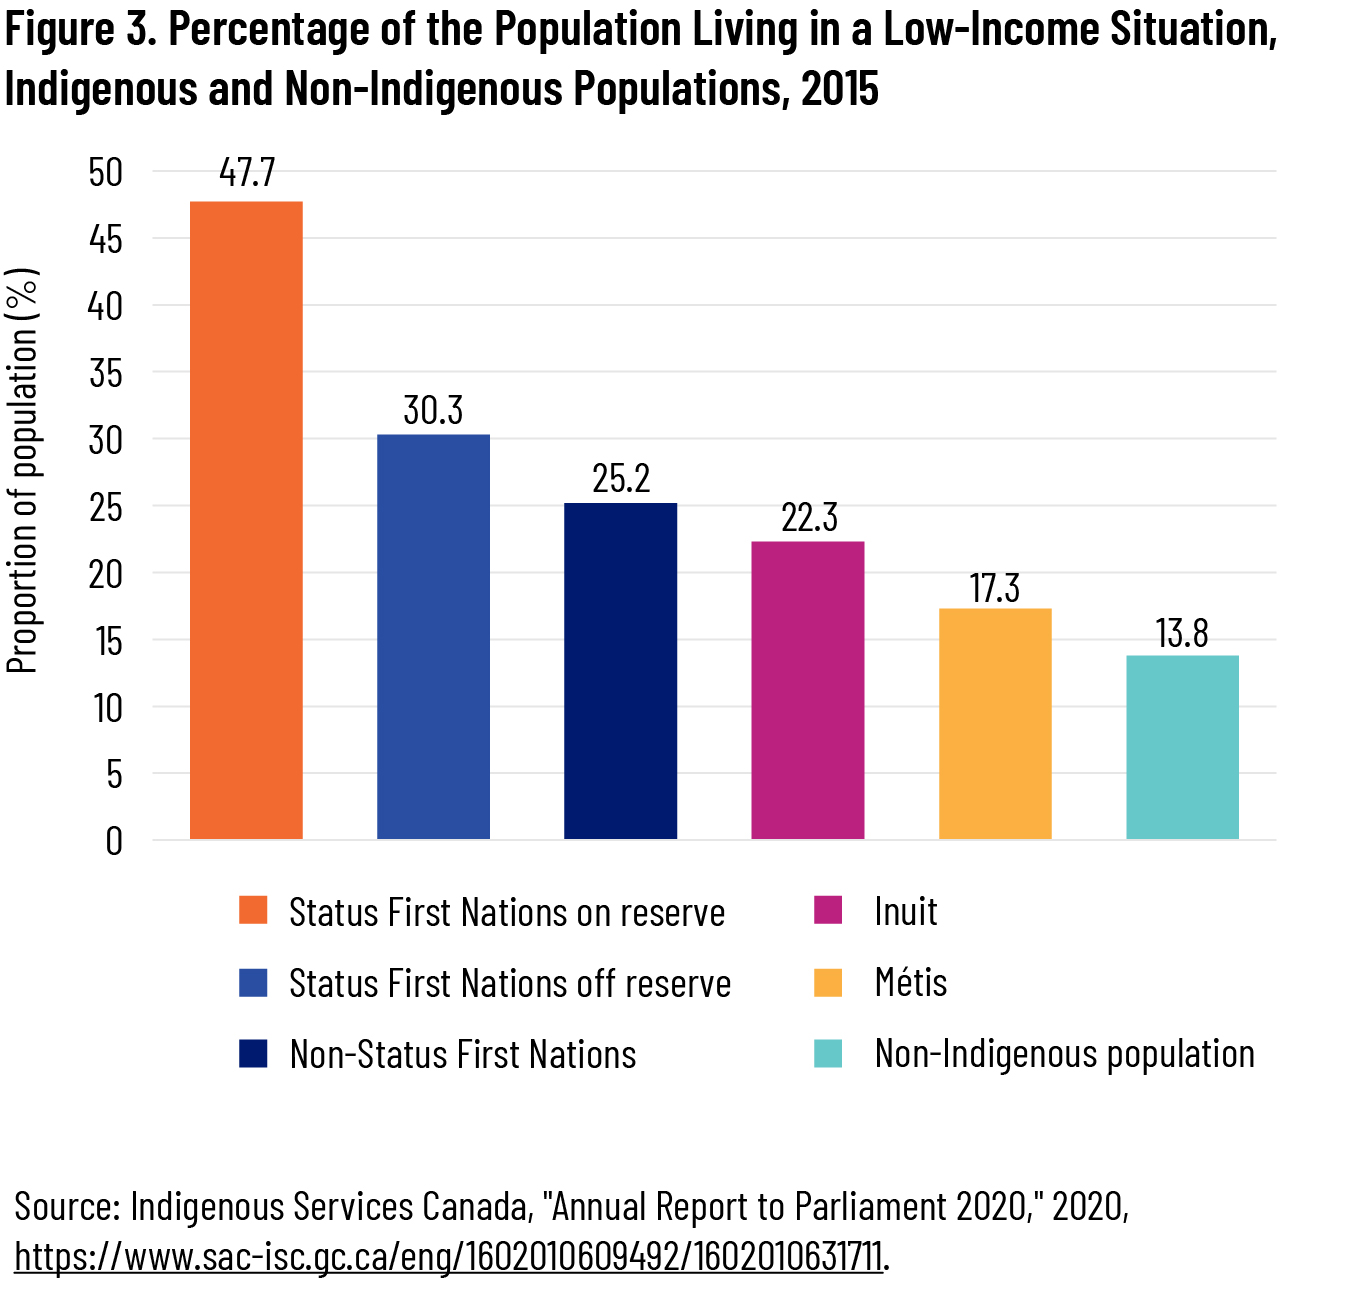
On average, Indigenous people derive a higher proportion of their incomes from government transfers, and a greater proportion of them have government transfers as their main source of income. 11 11 National Indigenous Economic Development Board, “Indigenous Economic Progress Report 2019,” June 2019, 25, http://www.naedb-cndea.com/wp-content/uploads/2019/06/NIEDB-2019-Indigenous-Economic-Progress-Report.pdf. Compared to non-Indigenous Canadians, the risk of living in a low-income situation[ 12 12 Indigenous Services Canada uses Statistics Canada’s low-income measure, defined as household after-tax income being less than half of the national median household income, adjusted for household size. in 2015 rises by 25 percent for Métis, 62 percent for Inuit, 83 percent for non-Status First Nations, 120 percent for Status First Nations living off reserve, and 246 percent for Status First Nations living on reserve (see figure 3).
Labour-Market Participation and Unemployment
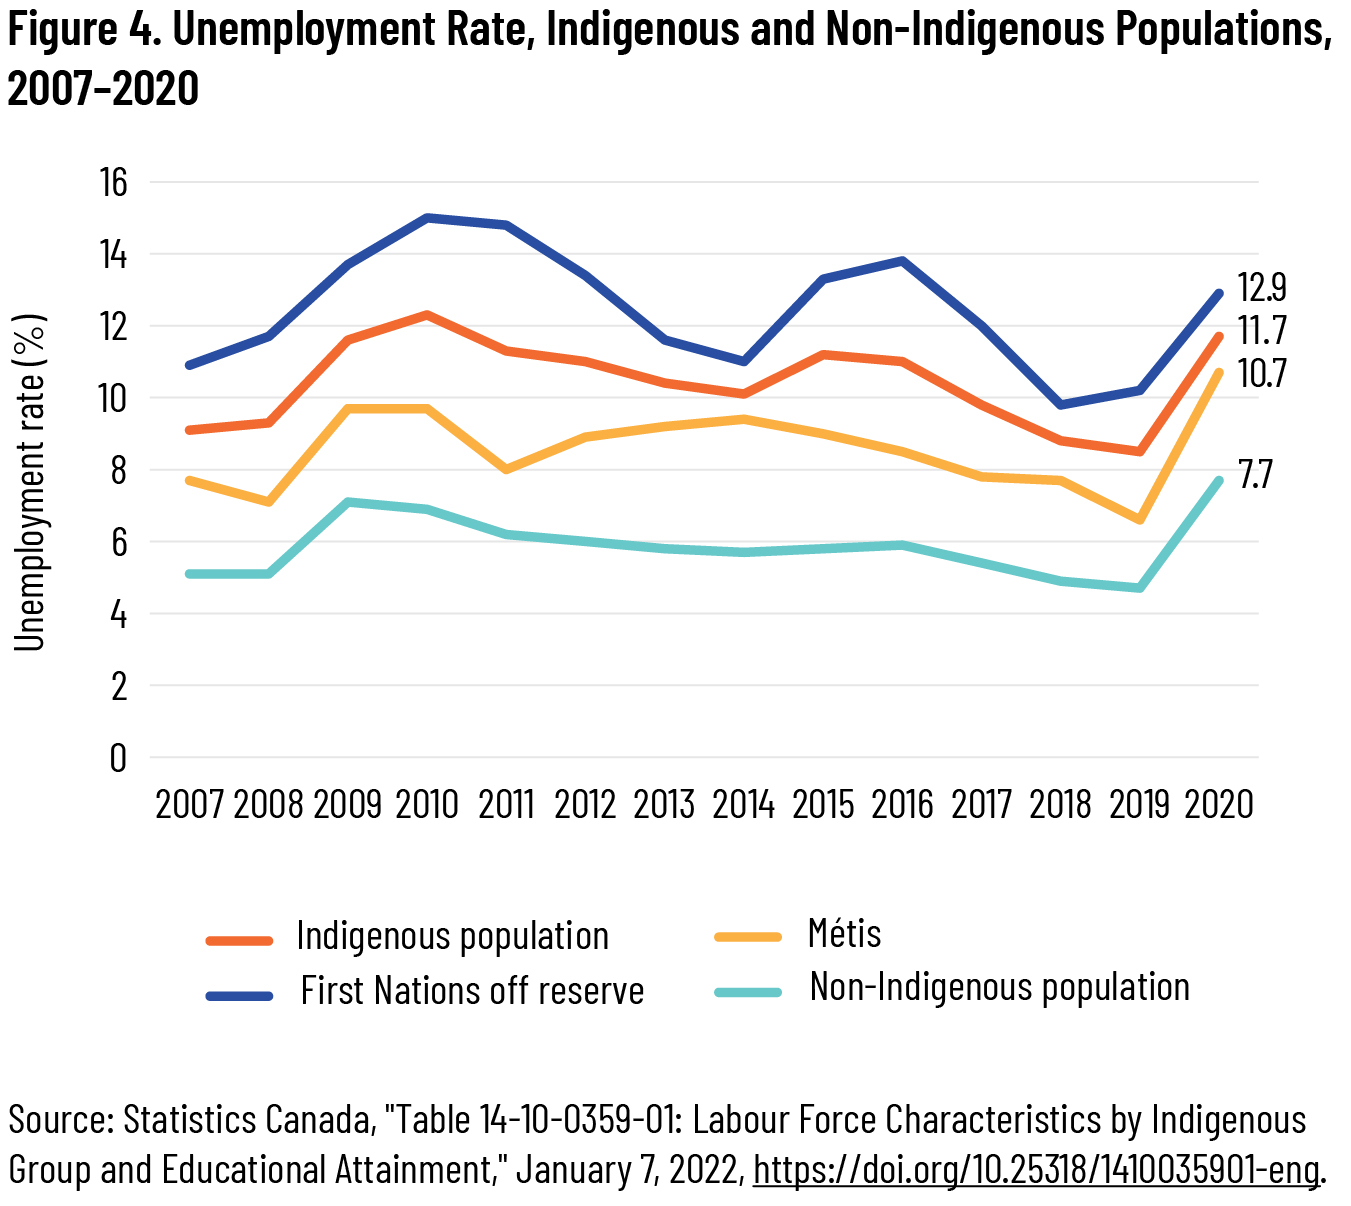
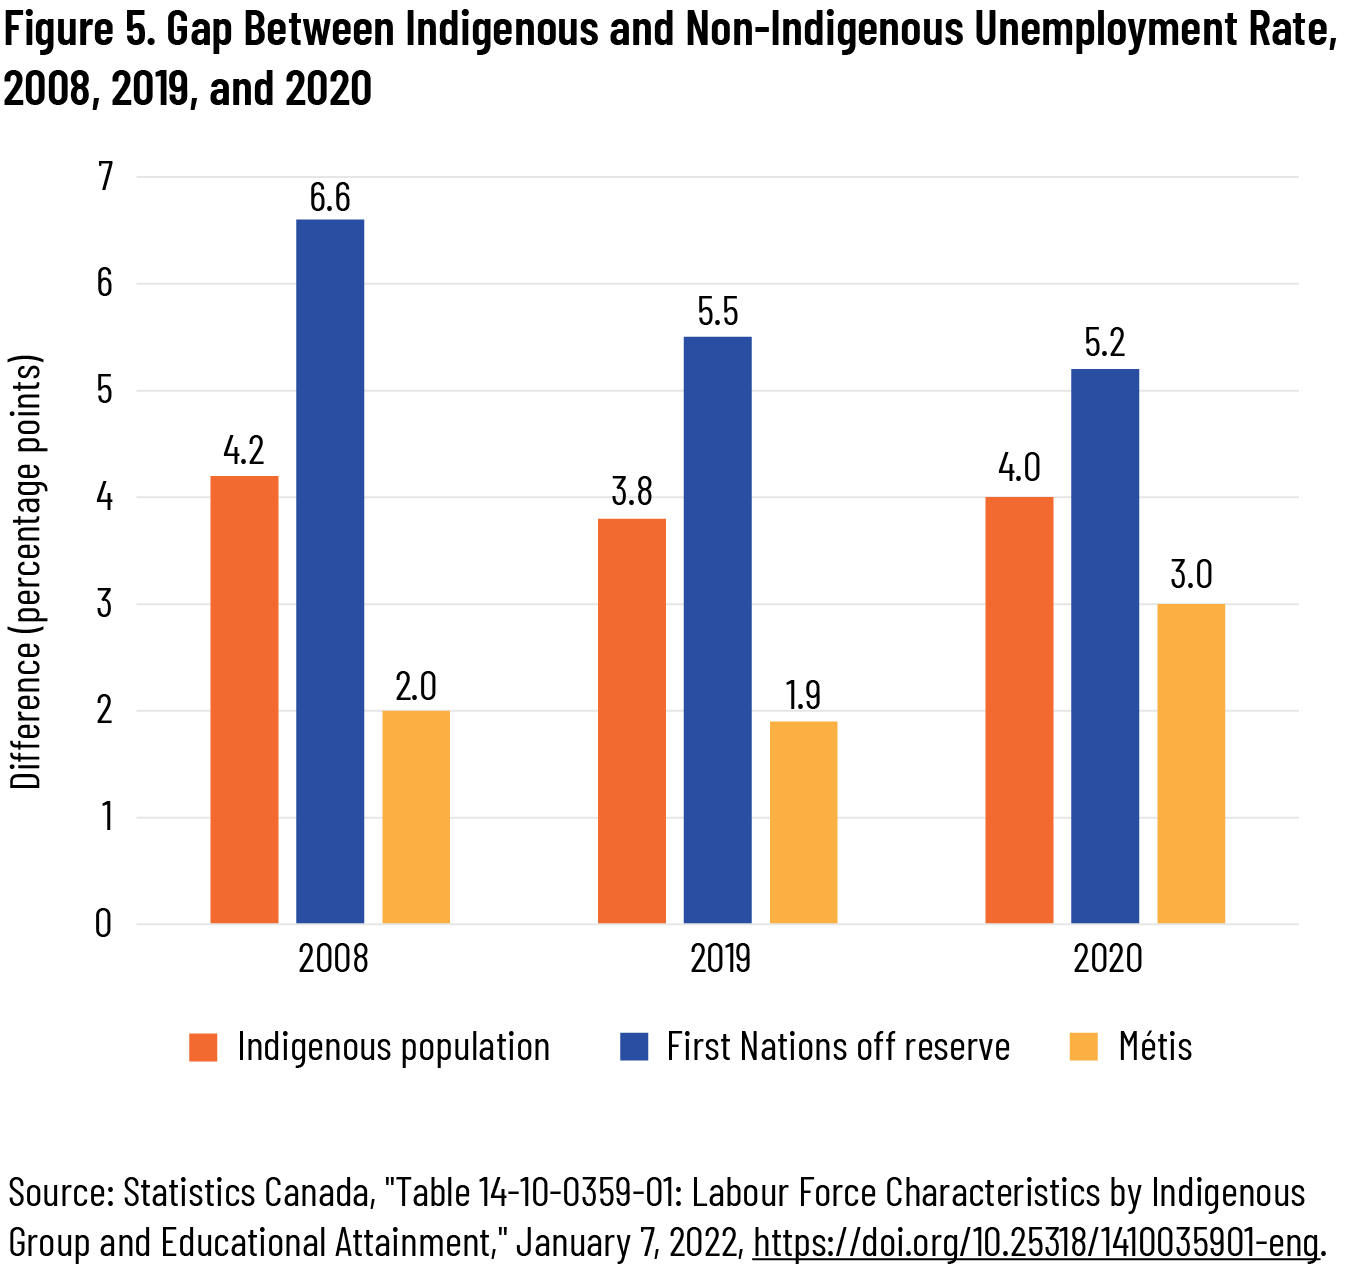
The unemployment rate measures the number of unemployed adults within the labour force—that is, those who are not currently working but are looking for work. The Indigenous unemployment rate in 2008 (9.3 percent) was nearly twice that of non-Indigenous Canadians (5.1 percent). By 2019, the unemployment rate for Indigenous people had been inching downward from its 2010 and 2015 peaks (12.3 percent and 11.2 percent, respectively) but was still at 8.5 percent, within one percentage point of the 2008 rate and almost four points higher than the non-Indigenous unemployment rate. In 2020, while unemployment rates spiked for all populations because of the COVID-19 pandemic and related public-health restrictions, the gap between Indigenous and non-Indigenous employment changed very little. For the Indigenous population, the unemployment gap in both 2019 and 2020 was less than half a percentage point smaller than the 2008 gap (see figures 4 and 5).
Another common indicator of employment inclusion is the labour-force participation rate, which measures the proportion of the adult population who are working and those who are unemployed but looking for work. An individual who is neither working nor looking for work, on the other hand, is considered outside the labour force and is not included in the participation rate. It provides a useful measure of how engaged a population is in the labour market.
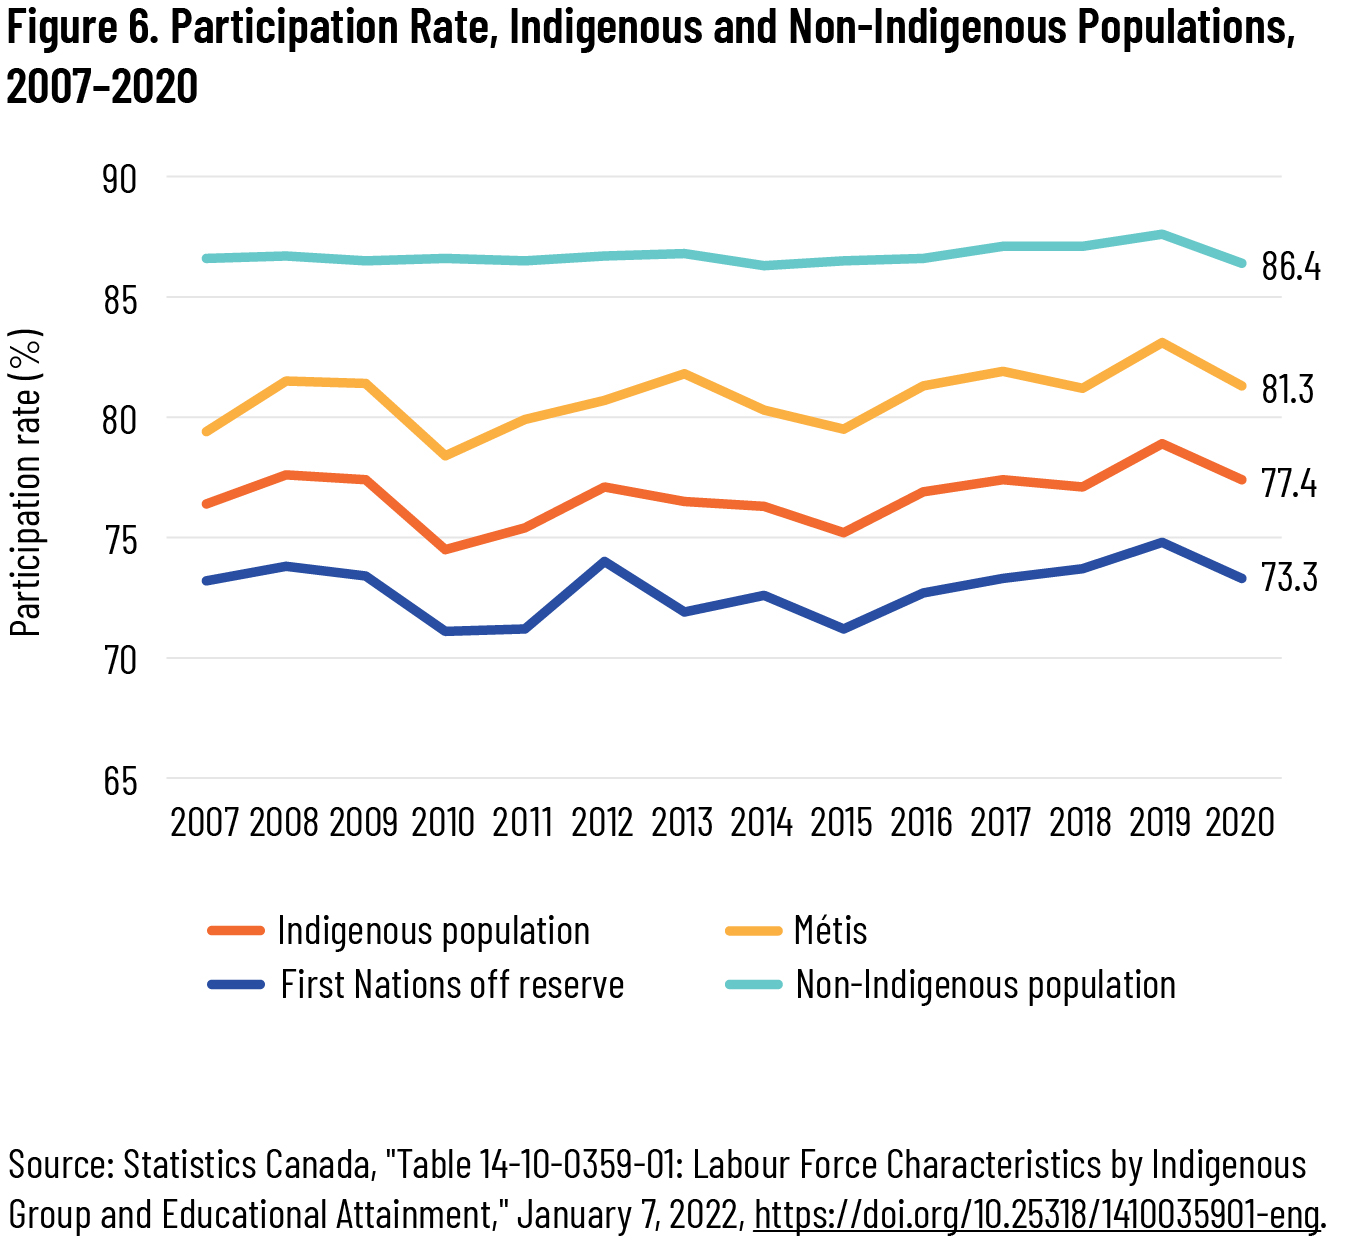
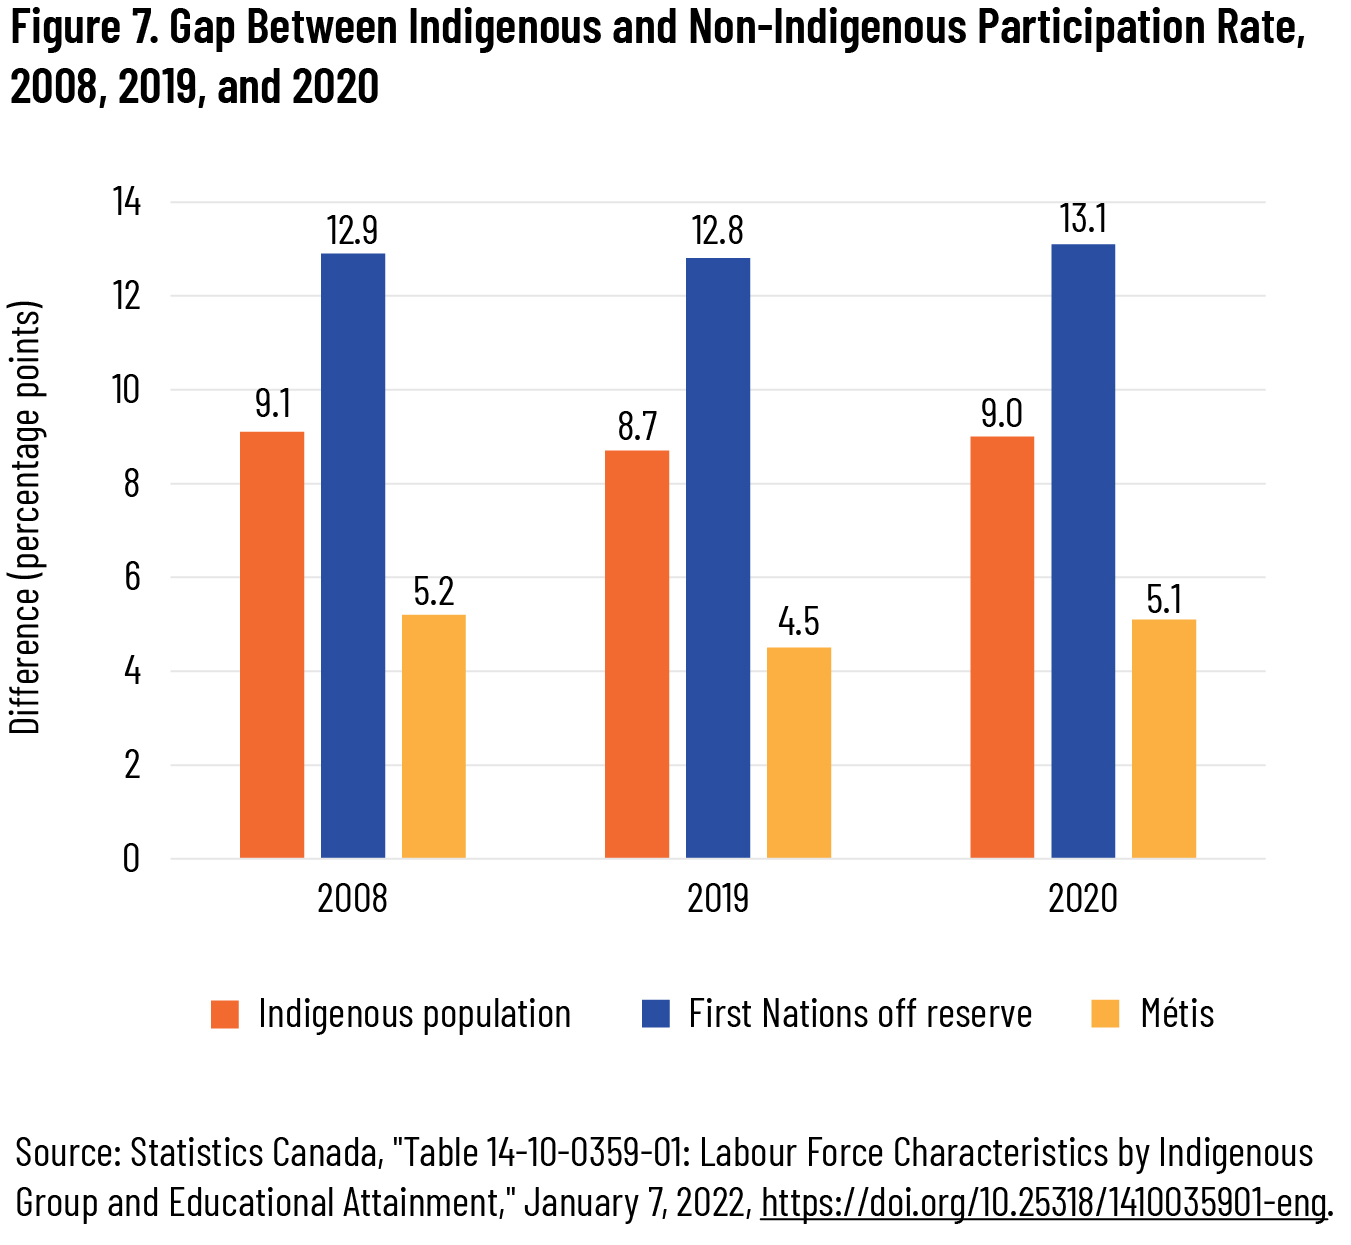
Over the past decade, the Indigenous participation rate rose and fell, but managed to climb from 77.6 percent in 2008 to 78.9 percent in 2019. However, the pandemic wiped out these modest gains, bringing the 2020 participation rate back down to 77.4 percent. The participation rate for the non-Indigenous population, meanwhile, held steady, around 86.5 percent, between 2008 and 2020. This means that in 2020 Indigenous people participate in the labour force at a rate around nine percentage points lower than non-Indigenous people. The participation gap was narrowing slightly by 2019 but widened again during the pandemic. This gap was smaller for Métis (5.1 points in 2020) and larger for First Nations living off reserve (13.1 points in 2020) (see figures 6 and 7). It is not clear why the Indigenous participation rate dropped more than the non-Indigenous participation rate in 2020 and raises important questions that could be the subject of future inquiry. For example, does this speak to the nature of the work in which Indigenous people tend to be engaged? Were Indigenous communities more vulnerable to the effects of COVID-19 and its attendant lockdowns?
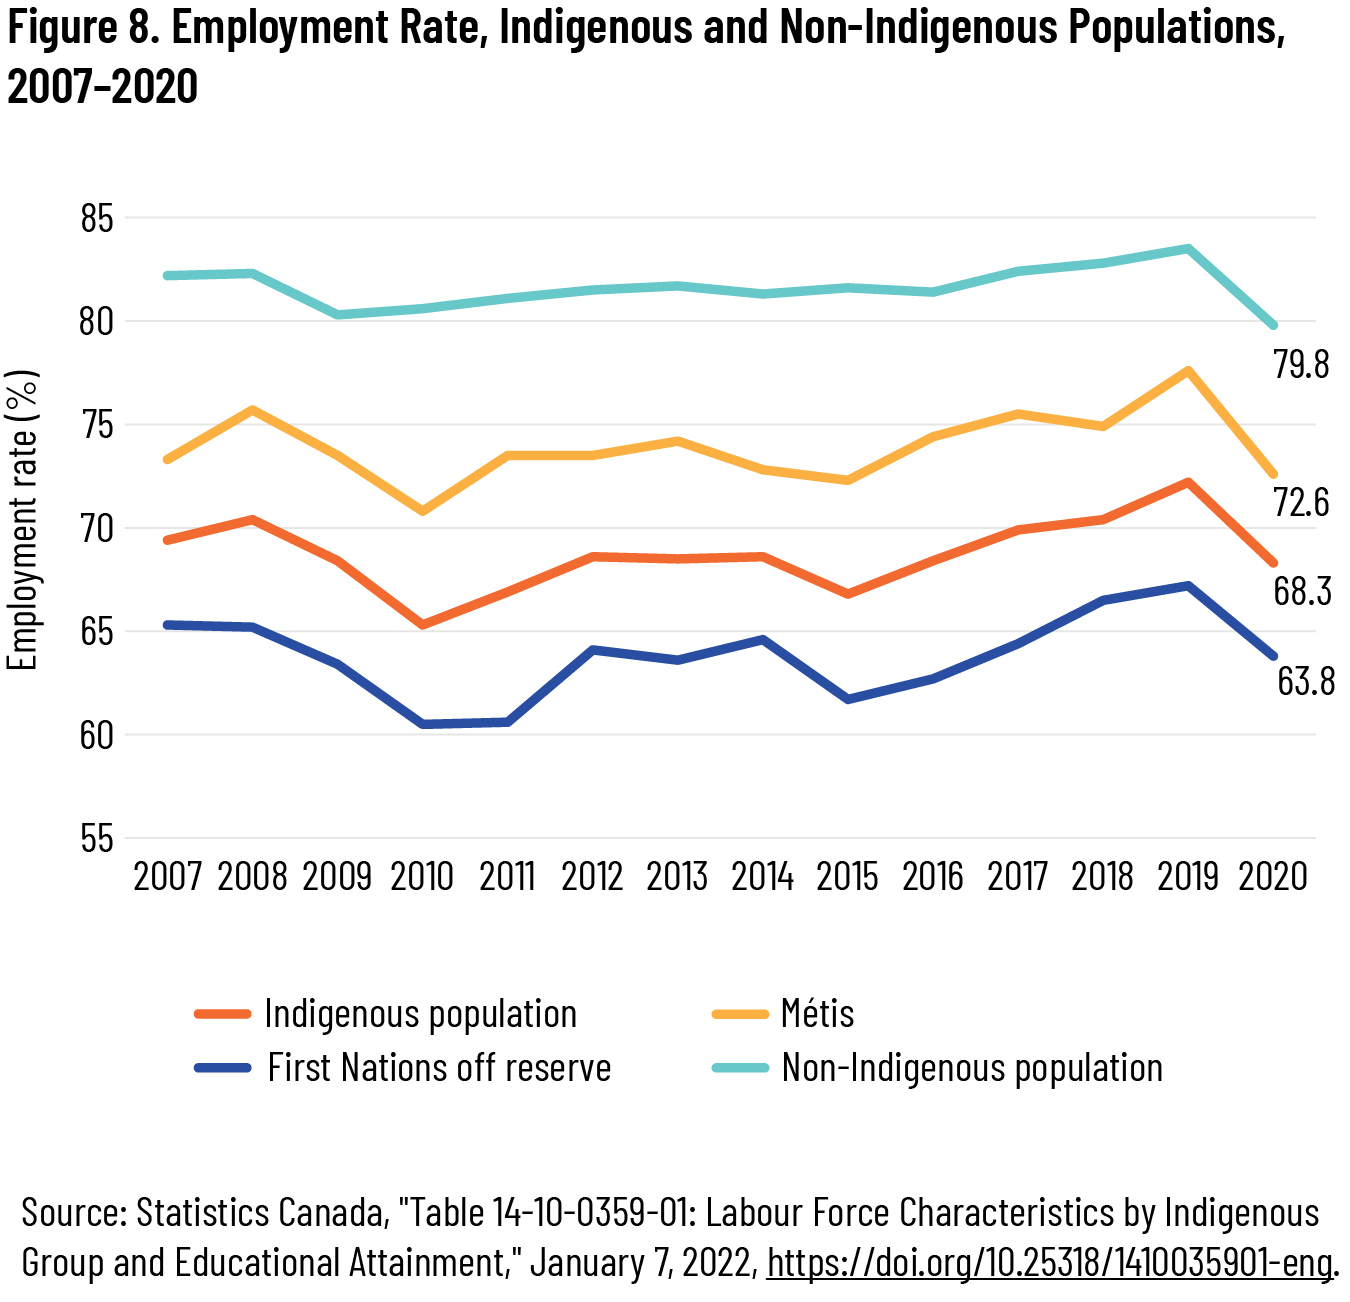
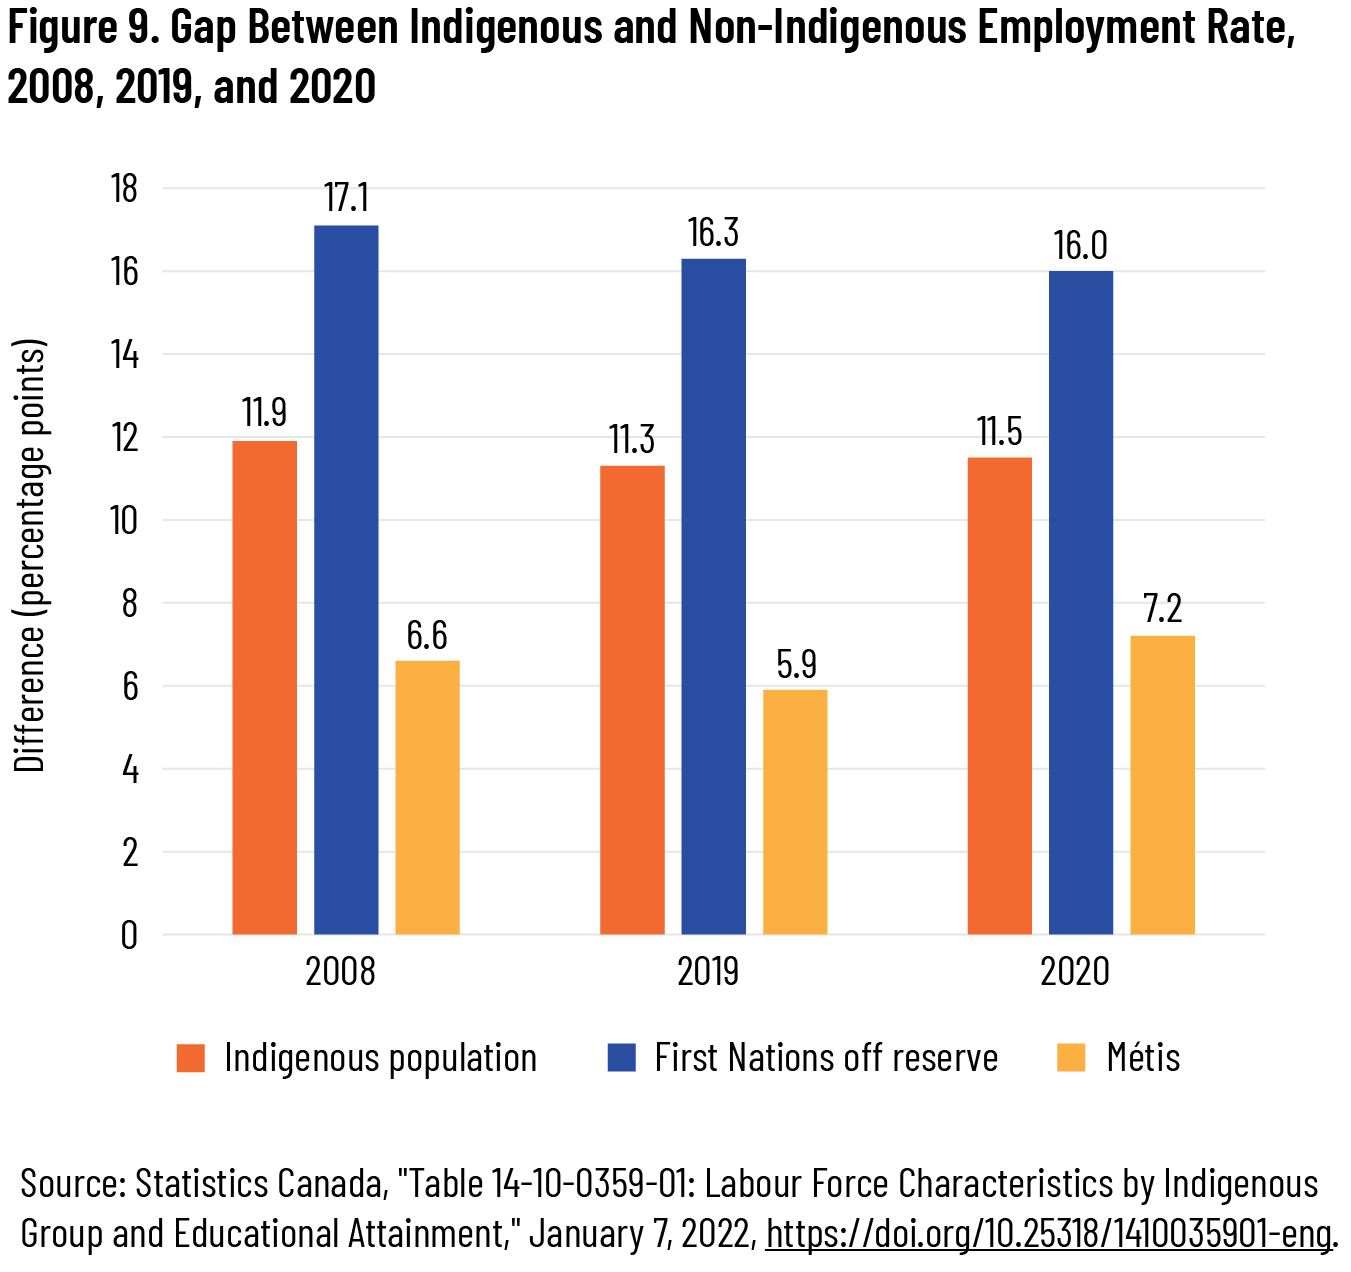
The employment rate, meanwhile, measures the percentage of the adult population that is currently employed. In 2020, the gap between the Indigenous and non-Indigenous employment rate was 11.5 percentage points, a marginal improvement over the gap of 11.9 points in 2008. It should be noted that there is a fair amount of variability between 2008 and 2020, with the 2020 figure representing an improvement over 2010 and 2015, when the gap was around 15 points. The pandemic had relatively little effect on the employment disparity between Indigenous and non-Indigenous Canadians: though the employment gap grew by 1.3 percentage points for Métis between 2019 and 2020, it grew by only 0.2 points for the total Indigenous population over the same period. However, the pandemic did wipe out most of the gains that the Indigenous employment rate had made over the past five years: 72.2 percent of Indigenous people in Canada were employed in 2019, nearly two points higher than 2008 and 5.4 points higher than 2015. By 2020, however, the Indigenous employment rate had fallen to 68.3 percent, about two points lower than 2008 (see figures 8 and 9).
Each of these three indicators—unemployment rate, participation rate, and employment rate—confirms that Indigenous people experience worse labour-market outcomes on average compared to other people in Canada. In some cases, improvements between 2008 and 2019 were marginal at best, and the pandemic-related labour-market disruptions of 2020 erased or even reversed these gains. Moreover, the gap between Indigenous and non-Indigenous Canadians has not budged substantially nor consistently decreased since 2008: on all three measures, Indigenous people are scarcely closer to the rest of the country than they were when the Canadian government made its official apology.
Unemployment, Participation, and Employment Rates by Region
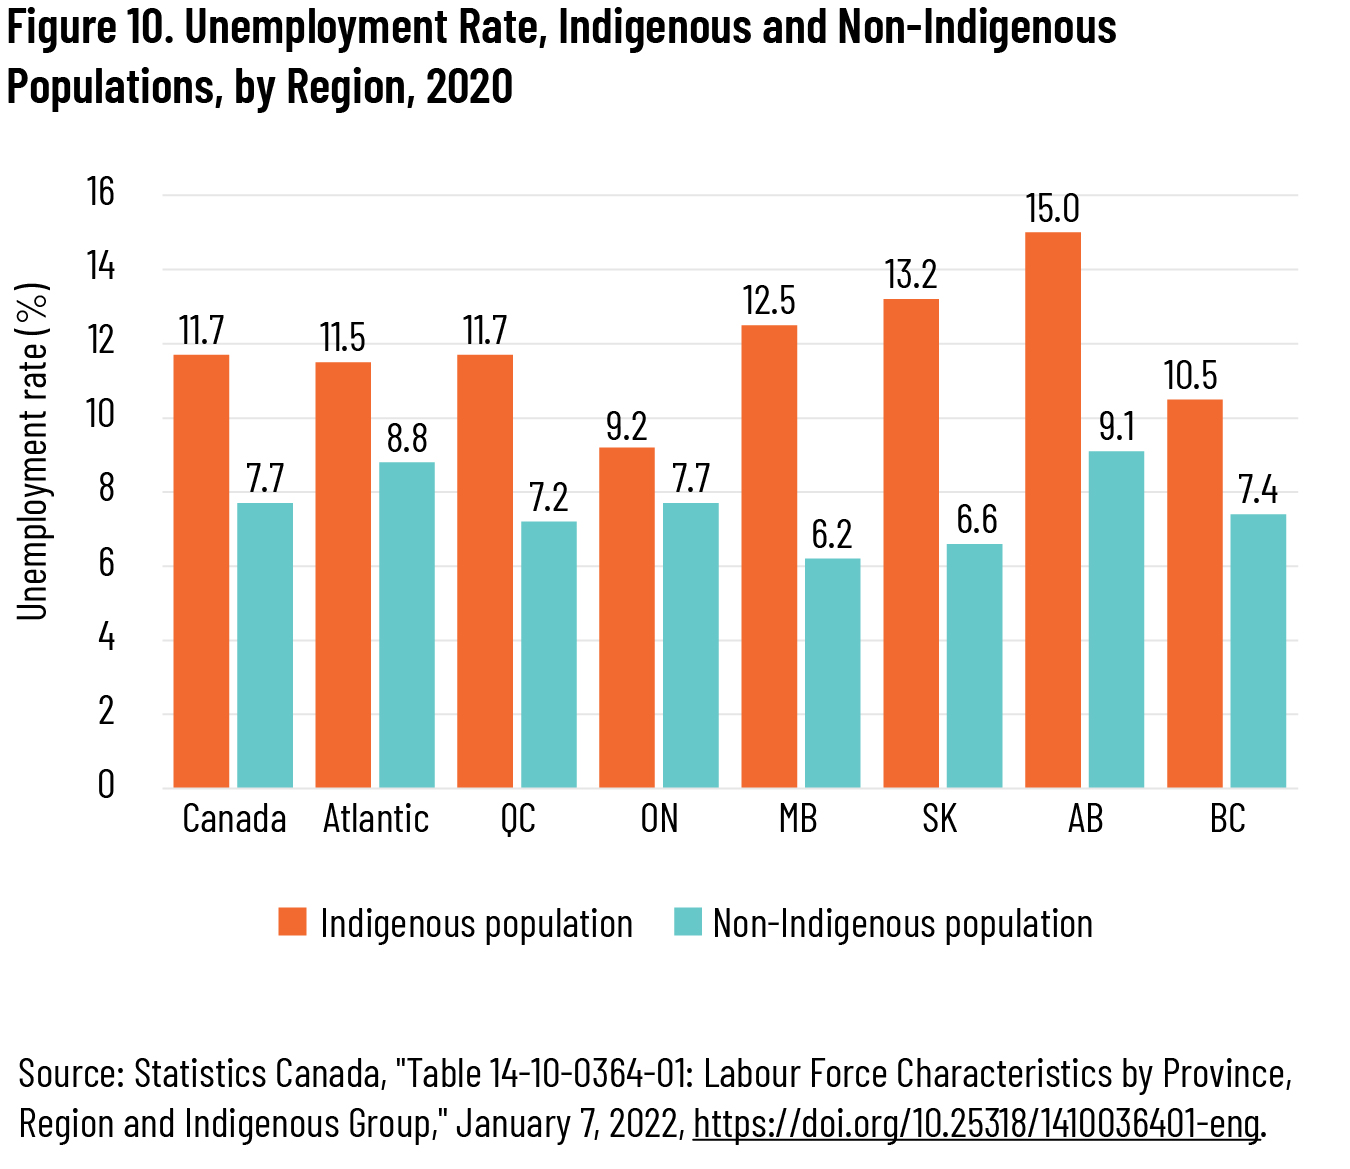
We also examined unemployment, participation, and employment rates by region. In 2020, the unemployment rate for Indigenous people was highest in Alberta (15.0 percent) and lowest in Ontario (9.2 percent). 13 13 While 2020 is an unusual year for employment, the purpose of this section is to compare across geography, not across different time periods. Below, we compare the results from 2008, 2019, and 2020 to consider the longer-term trends, as well as the employment effects of the COVID-19 pandemic. While the unemployment rate is higher for Indigenous people in every region of Canada than for non-Indigenous people, the size of the unemployment gap varies. In 2020, this gap was smallest in Ontario, at just 1.5 percentage points. At the other end of the spectrum were the prairie provinces: the unemployment rate for Indigenous people in Saskatchewan, Manitoba, and Alberta was higher than the non-Indigenous rate by 6.6, 6.3, and 5.9 points respectively (see figure 10).
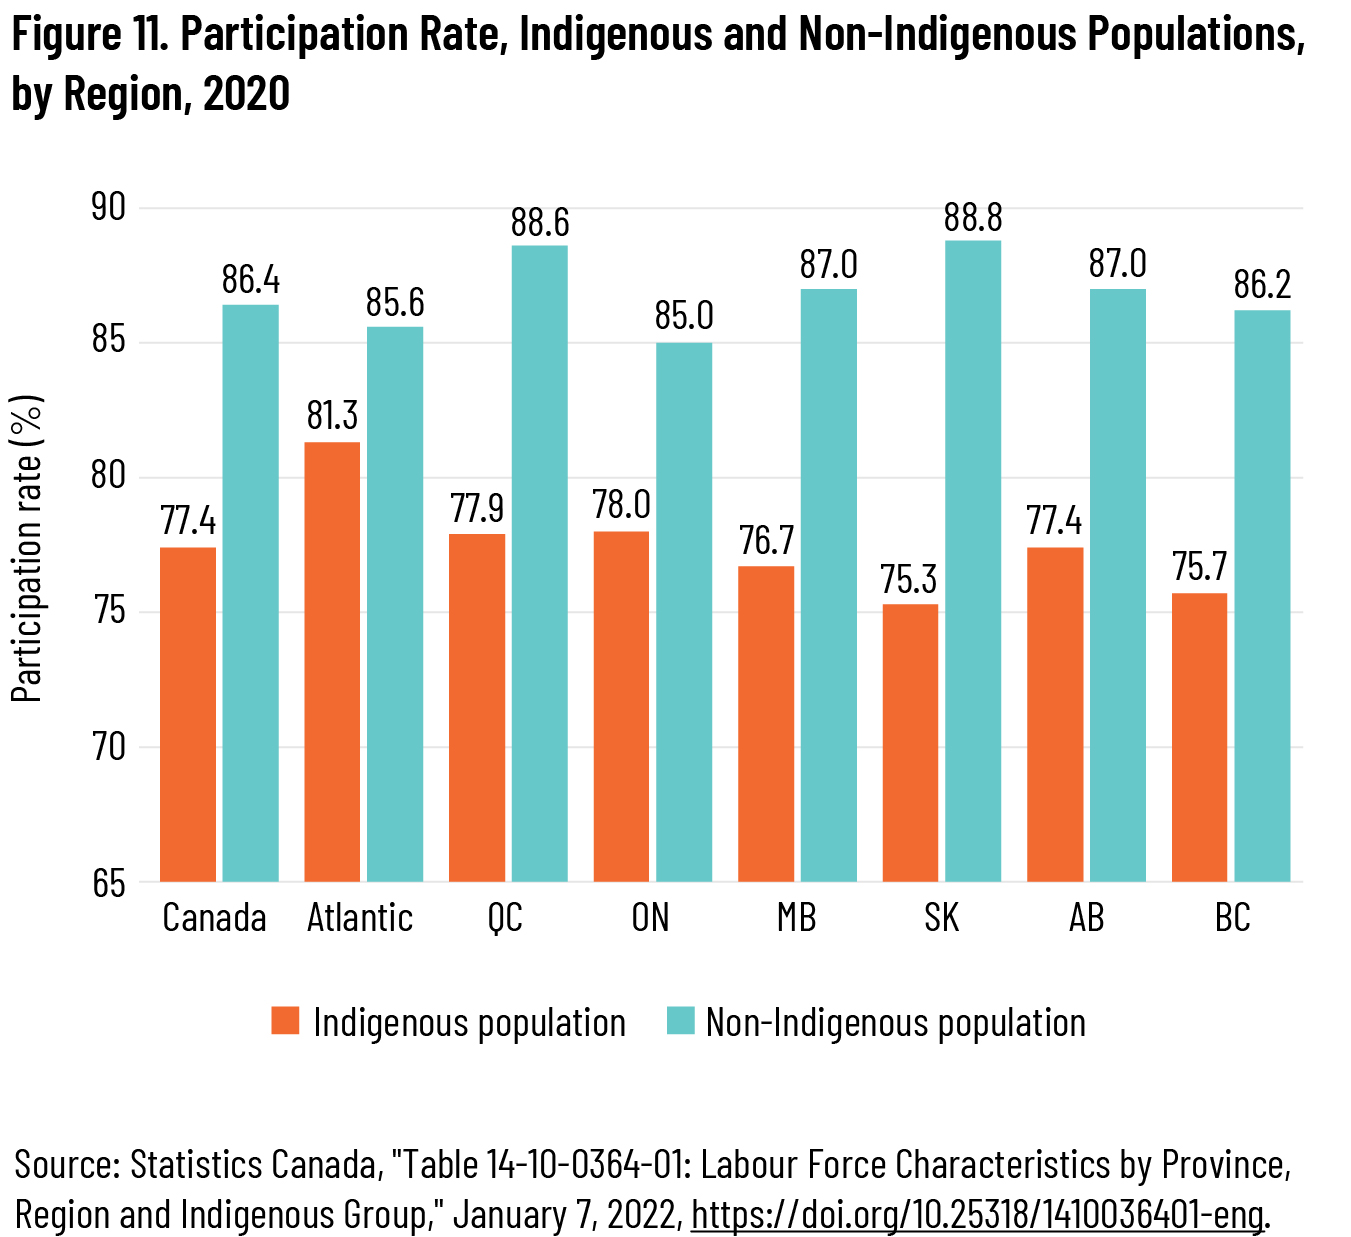
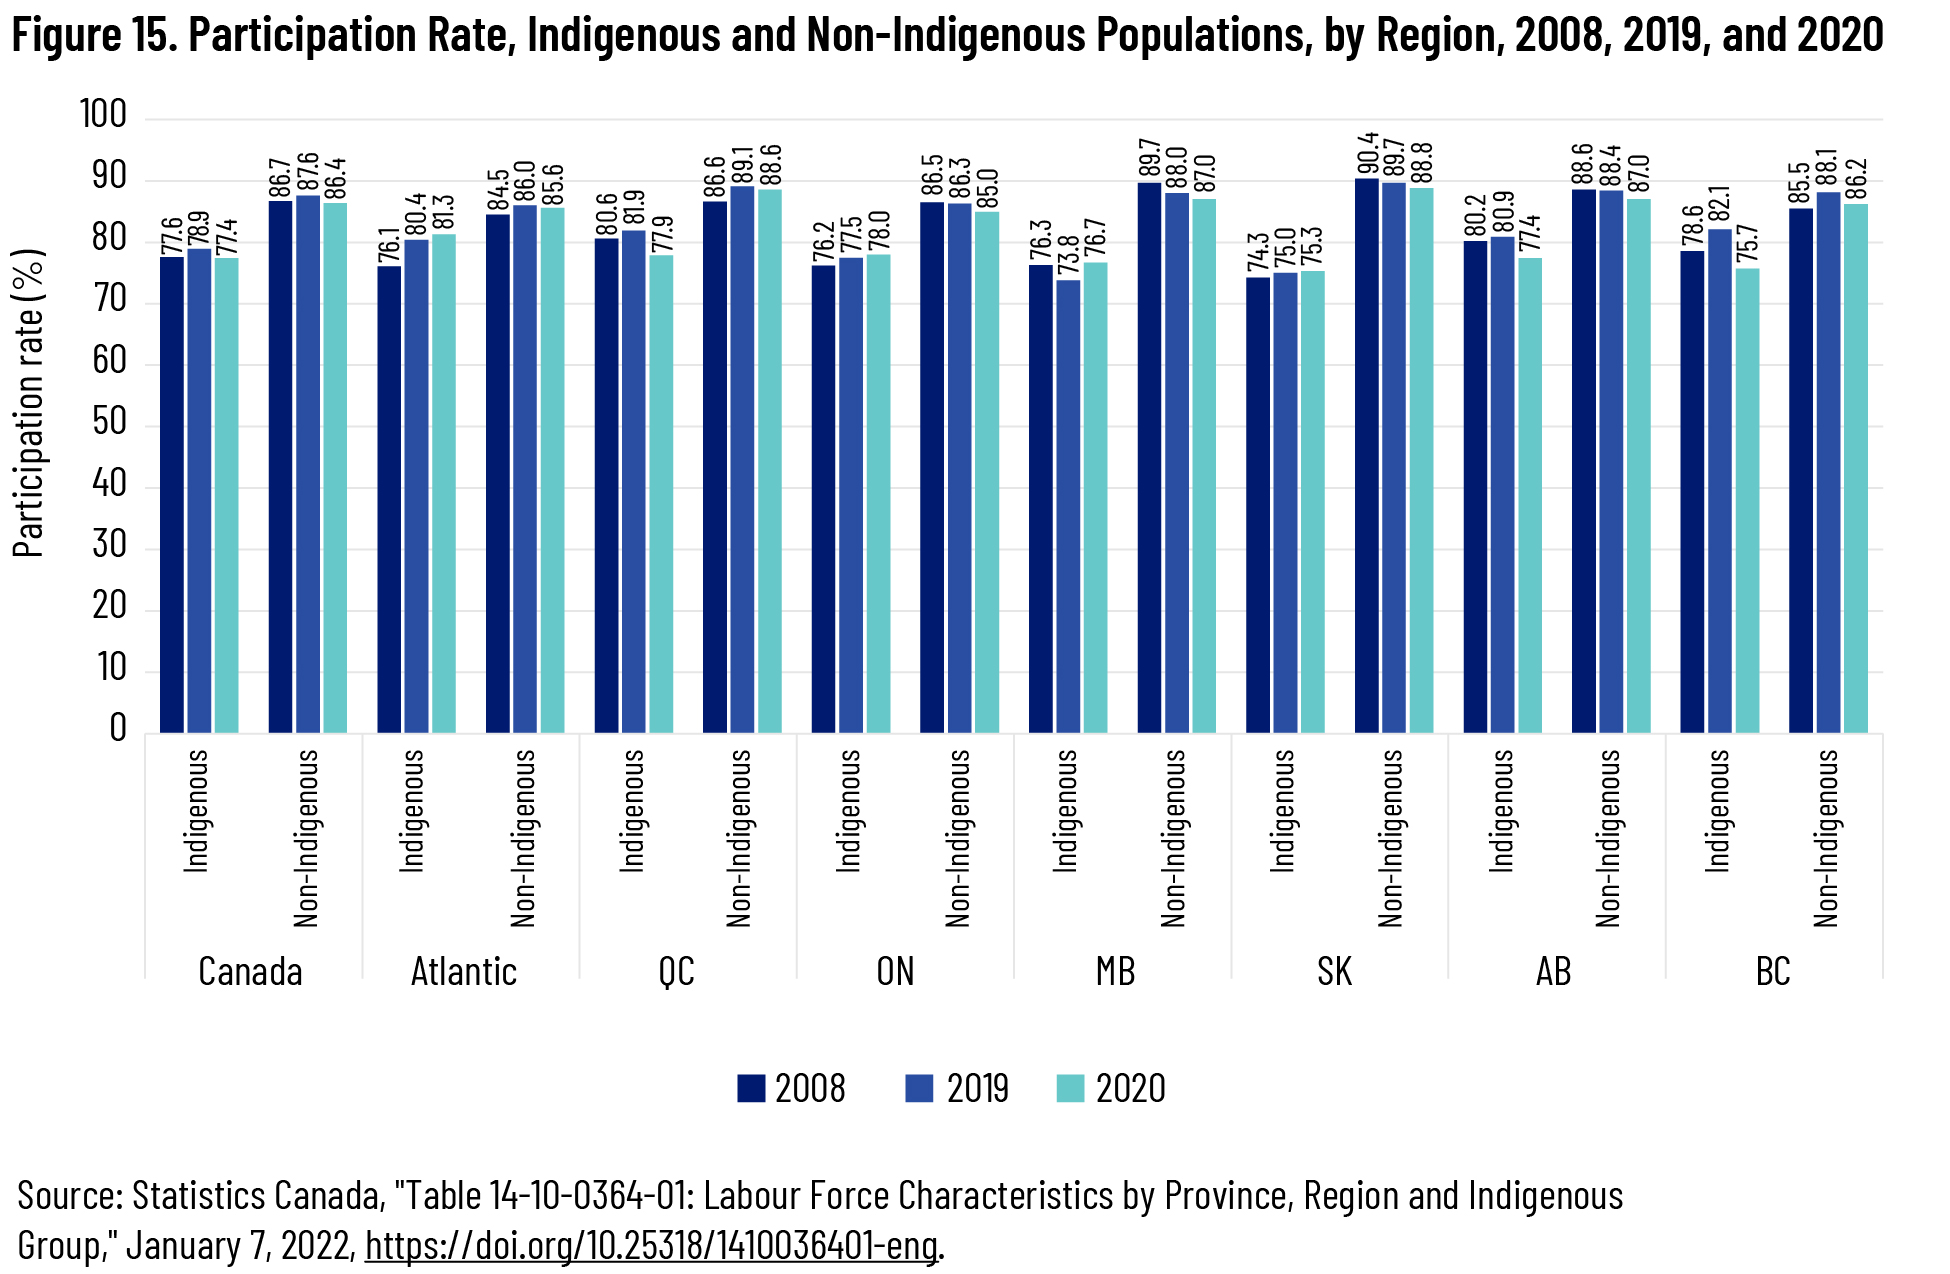
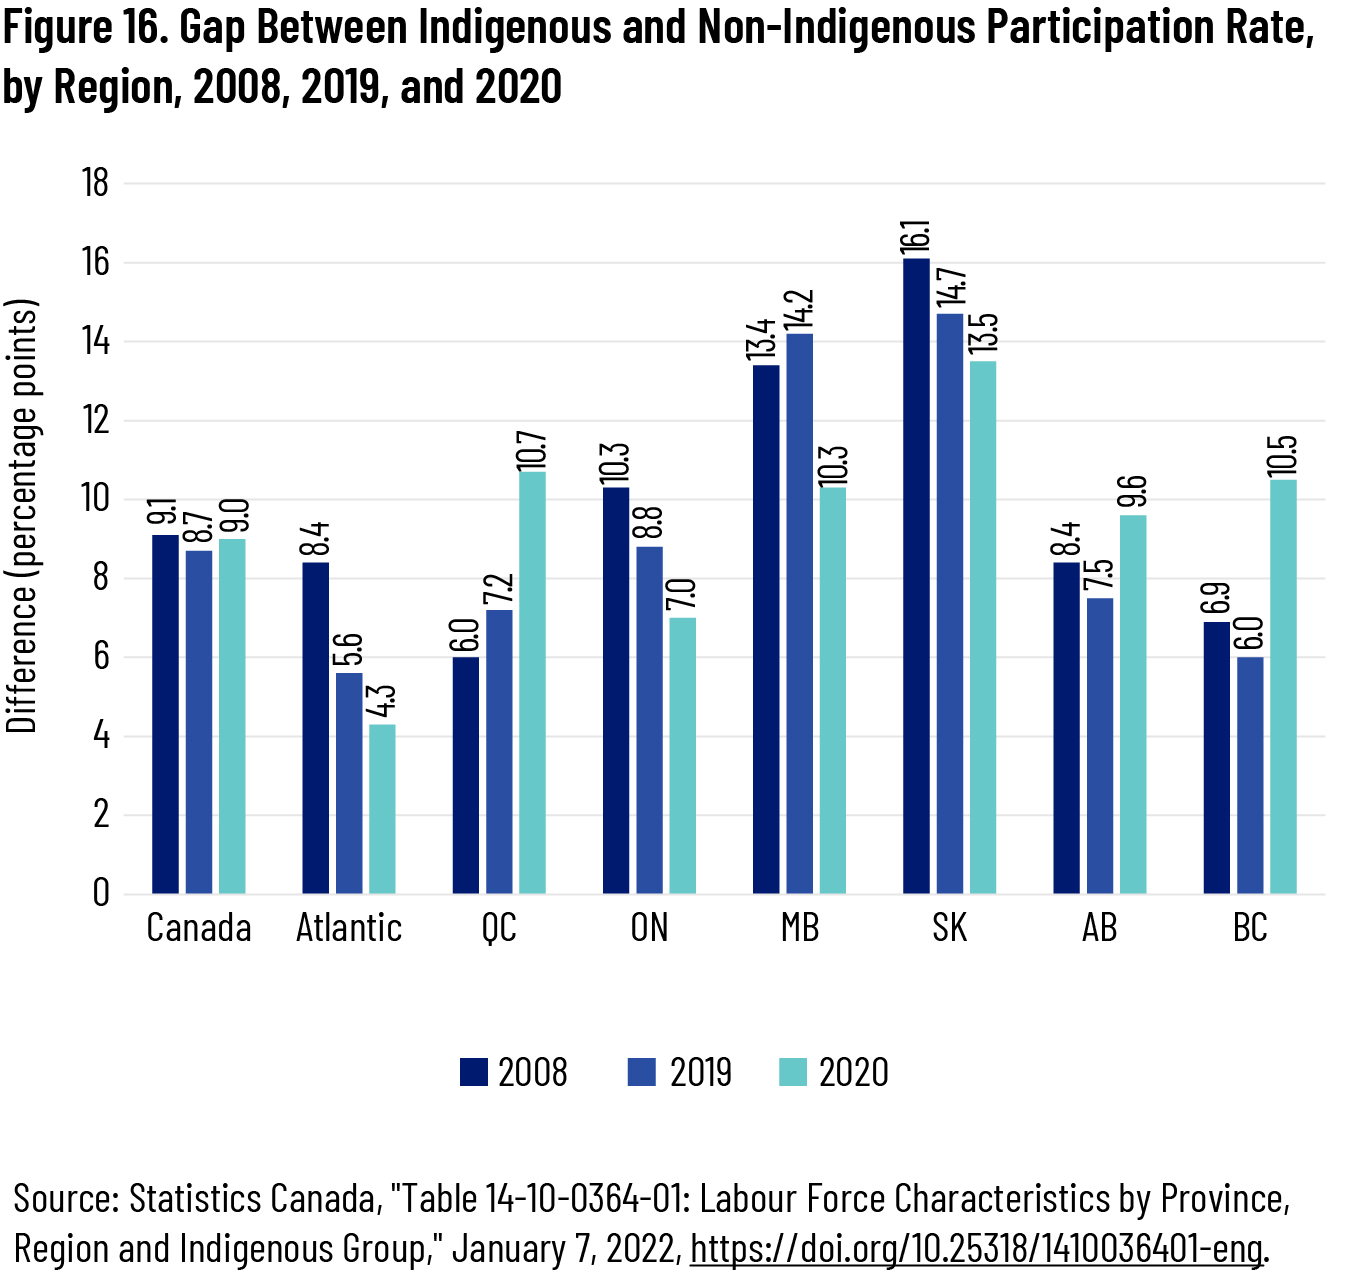
The Indigenous participation rate was highest in the Atlantic provinces (81.3 percent), which also had the smallest gap between the Indigenous and non-Indigenous population (4.3 points, less than half the national gap). Ontario came in second on both counts, with an Indigenous participation rate of 78 percent and a gap of seven points. Only Ontario and the Atlantic provinces had smaller gaps than the national gap. At the other end was Saskatchewan, which had both the lowest Indigenous participation rate (75.3 percent) and the largest gap (13.5 points) (see figure 11).
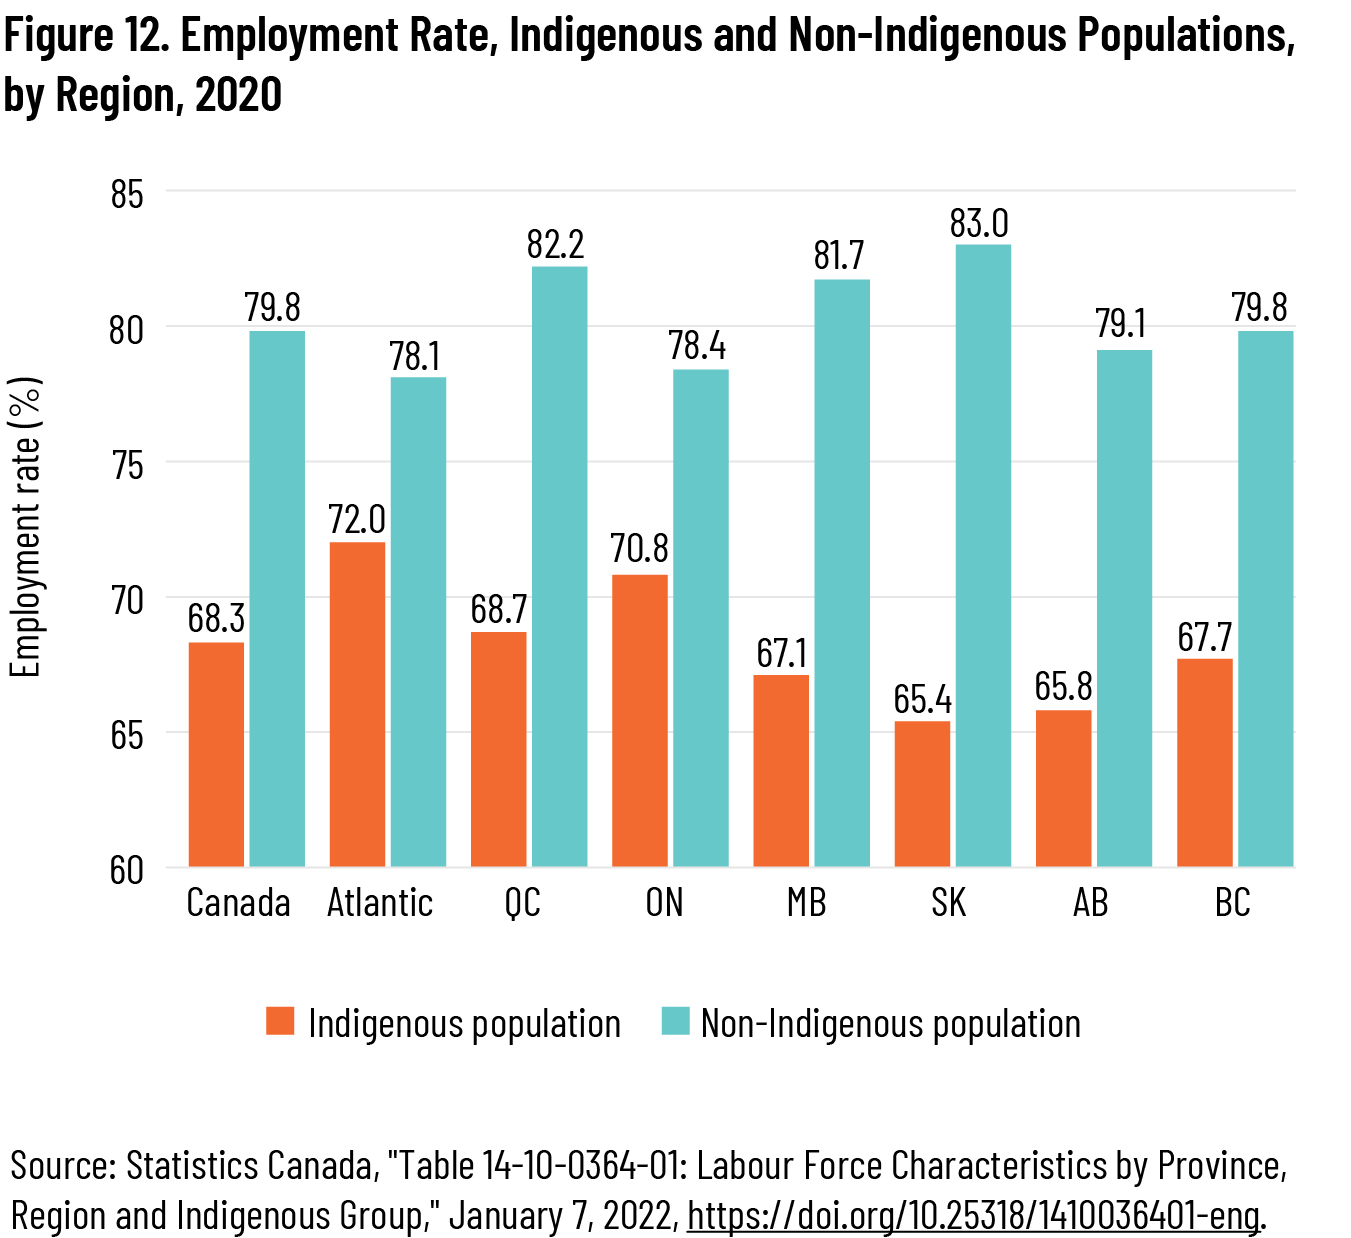
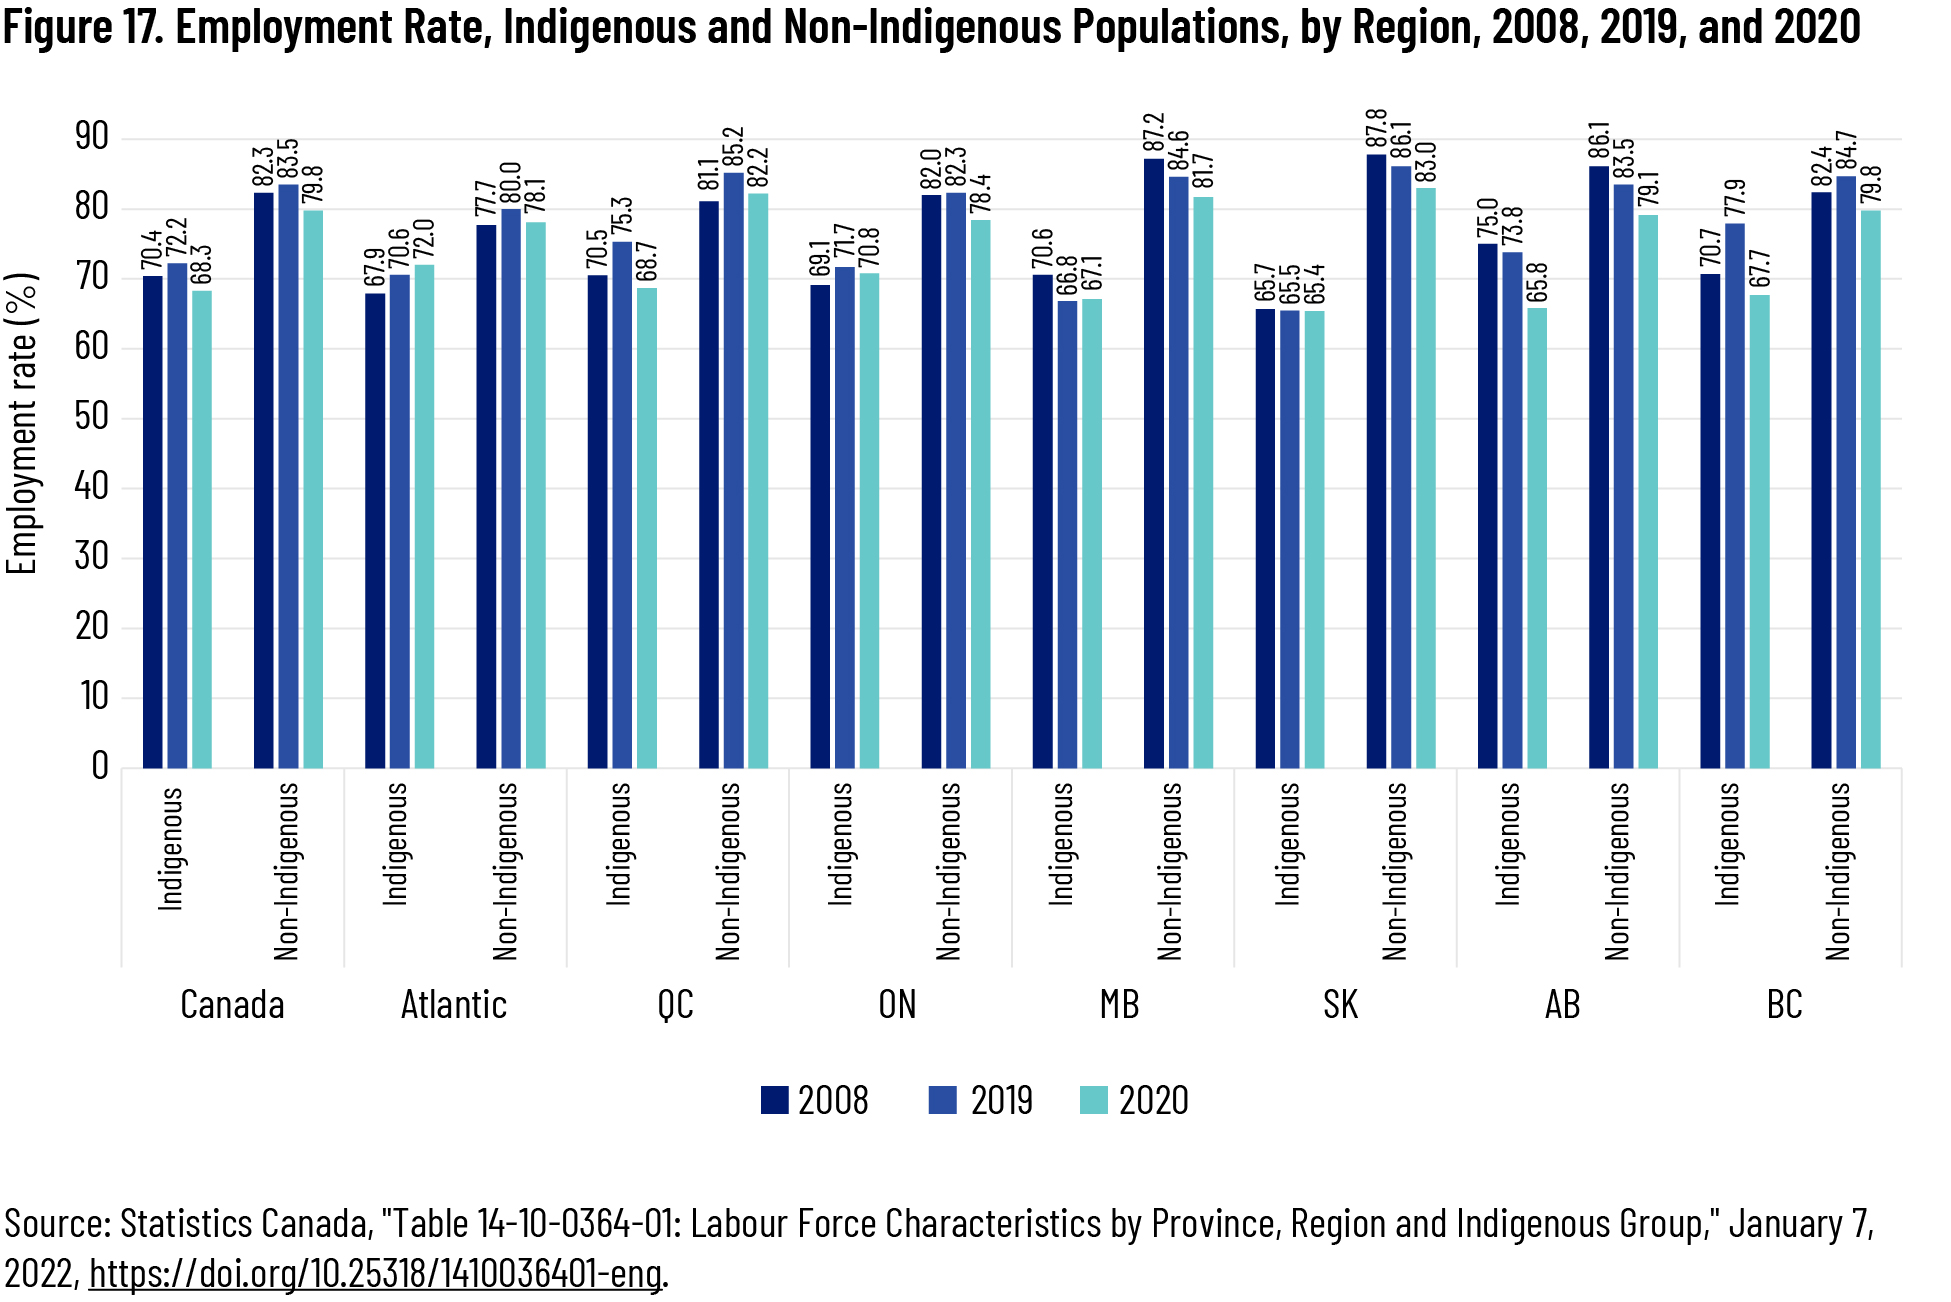
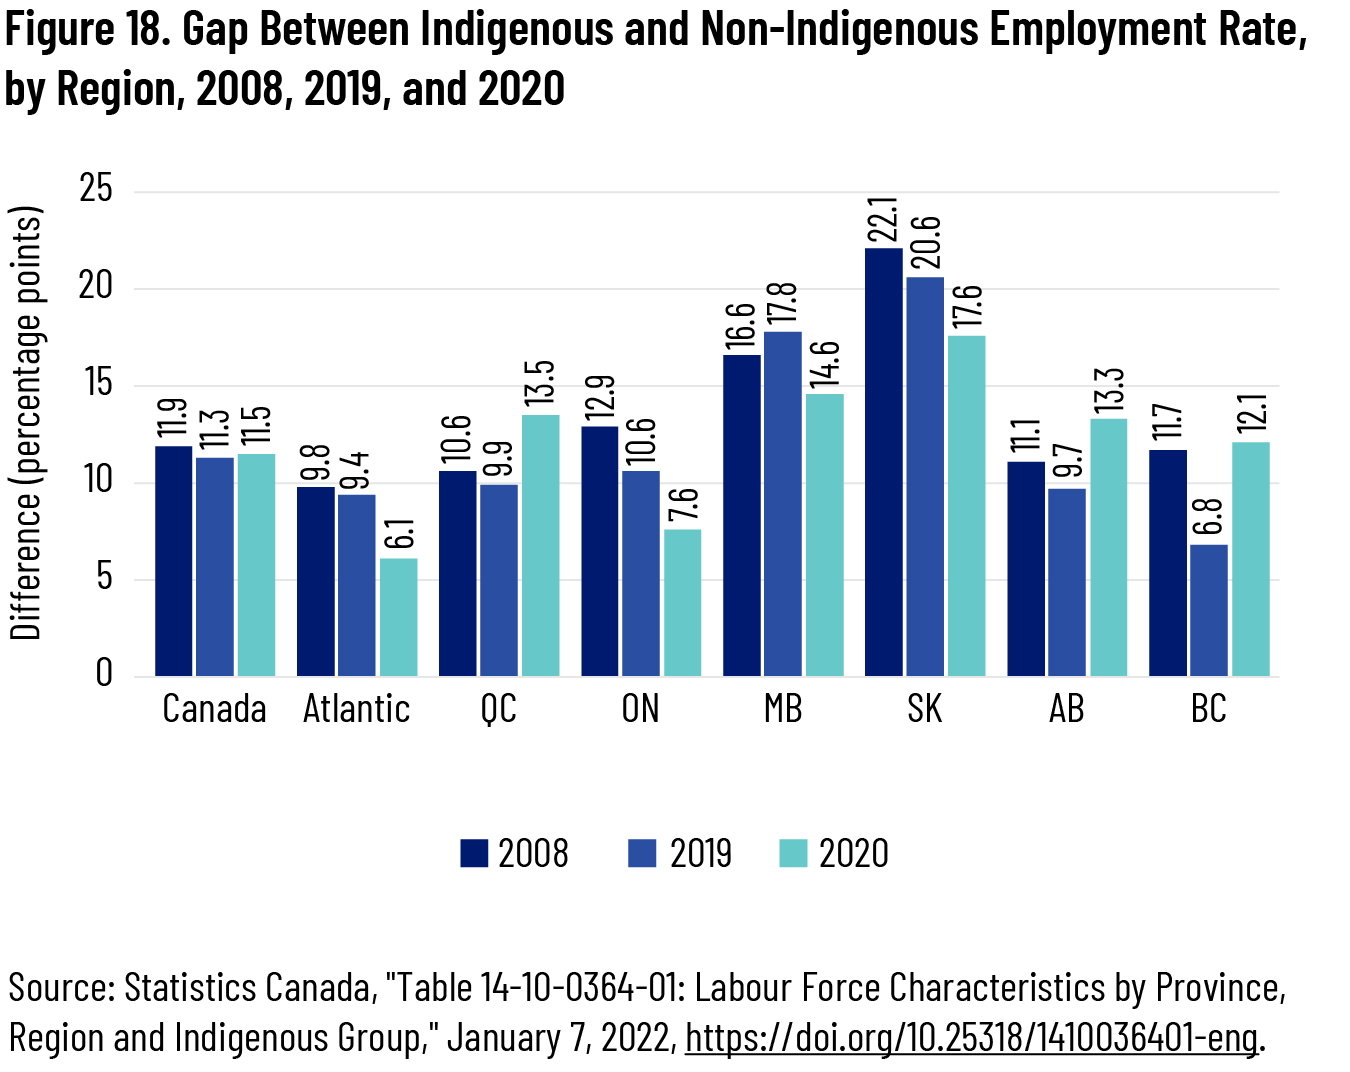
The gap between the Indigenous and non-Indigenous employment rates was smallest in Ontario and the Atlantic provinces (7.6 and 6.1 points, respectively). These regions had both the highest employment rates for Indigenous residents (70.8 percent in Ontario, 72.0 percent in the Atlantic provinces) and the lowest employment rates for non-Indigenous residents (78.4 percent and 78.1 percent). Saskatchewan was again at the other extreme, with a 65.4 percent Indigenous employment rate—a full 17.6 points lower than the non-Indigenous rate (see figure 12).
Indigenous people experience labour-market disadvantages in all parts of the country, but the difference between Indigenous communities and the rest of the population varies by geography. When considering all three labour-market indicators, employment outcomes for Indigenous people are currently best, and closest to those of non-Indigenous people, in Ontario. As a result, Ontario has a positive effect on the national Indigenous rates and a large effect because of its population. By contrast, Saskatchewan is the region where Indigenous people experience the worst employment outcomes relative to the non-Indigenous population.
Change in Unemployment, Participation, and Employment Rates by Region
In this section, we compare the changes in the labour-force characteristics and the gaps between Indigenous and non-Indigenous people for these measurements in 2008, 2019, and 2020. As with the data above, while the 2020 data reflects the unusual circumstances of the COVID-19 pandemic, it nonetheless paints an important picture of how the Indigenous population fared during that year. The 2019 data are offered as the most recent “normal” year.
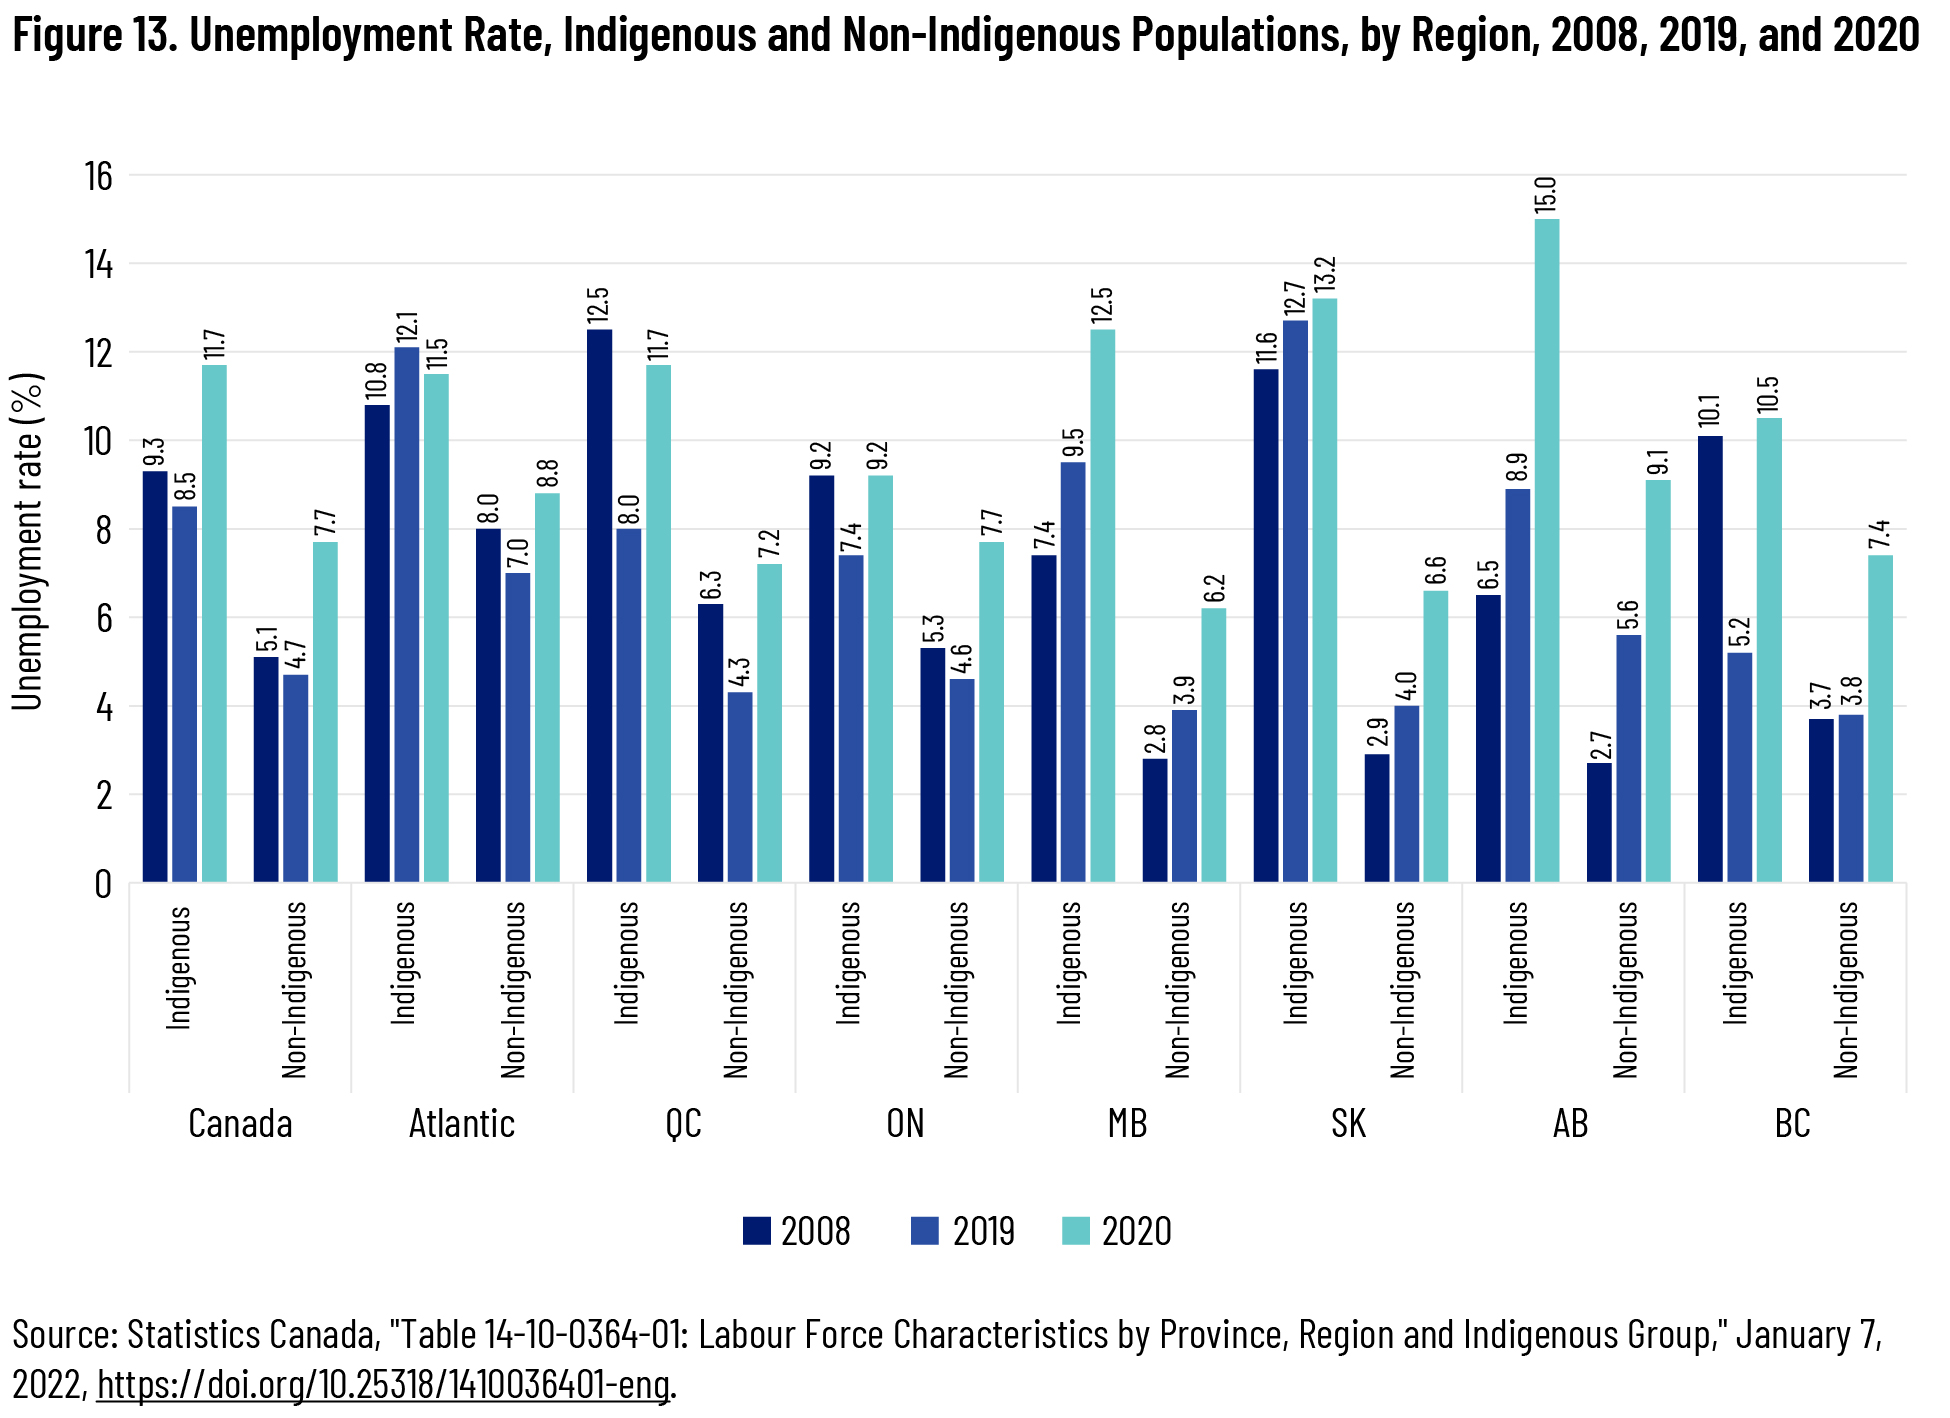
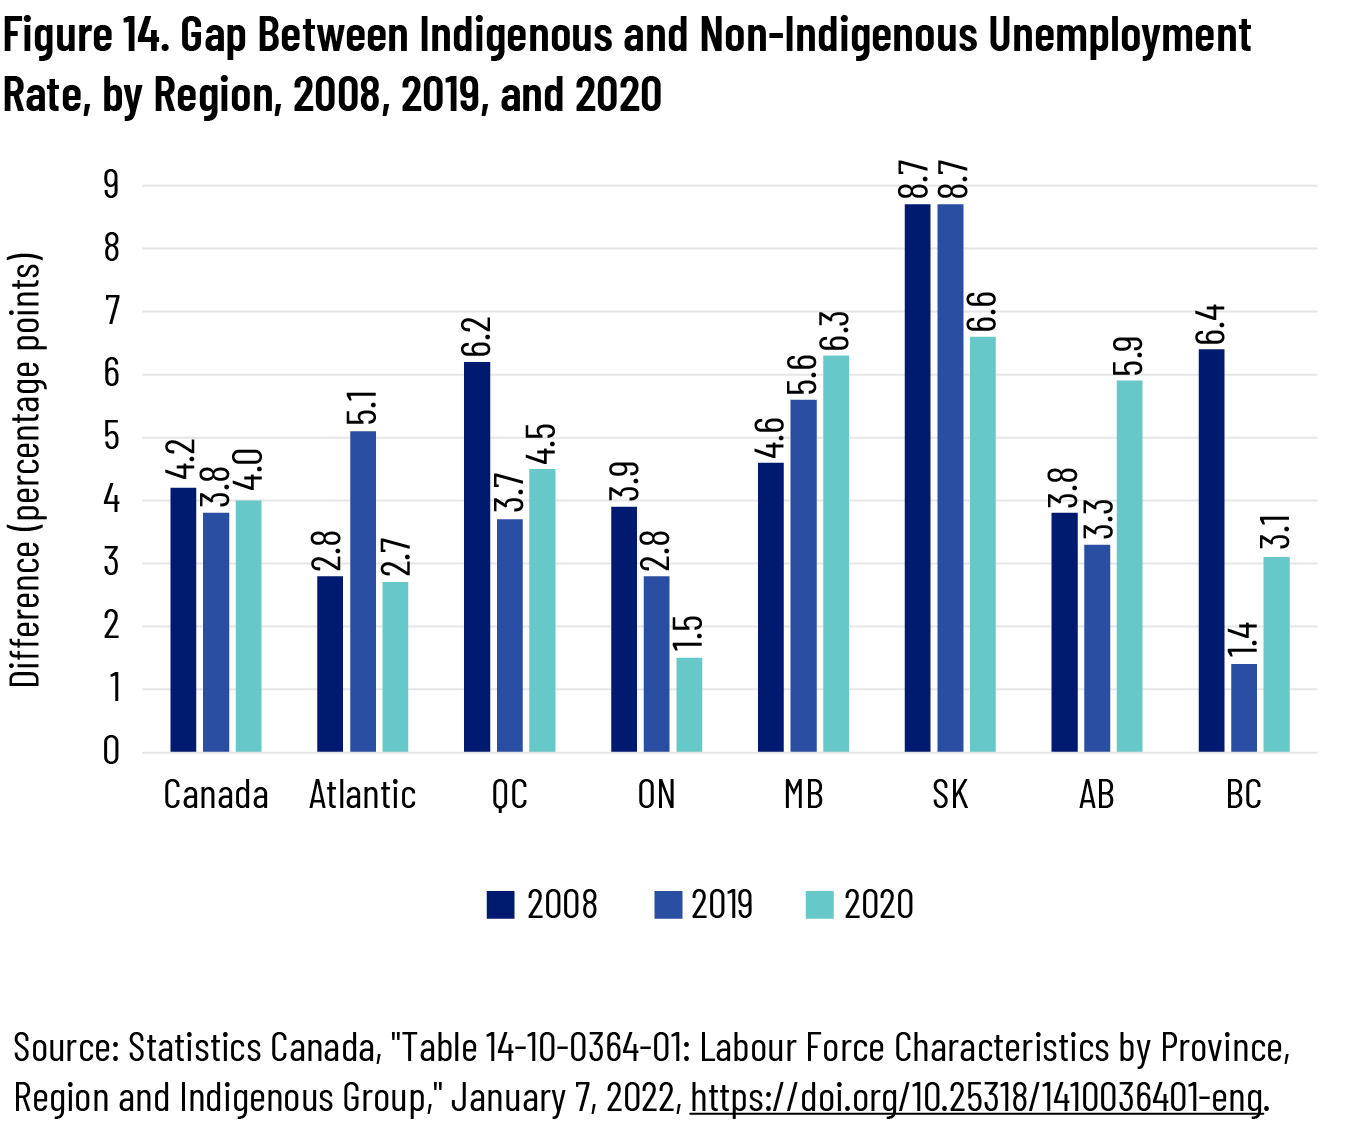
The national unemployment gap was essentially the same in 2019 and 2020 as it was in 2008, but there was more variation at the provincial level. Some provinces—Quebec, British Columbia, Saskatchewan, and Ontario—managed to narrow the gap by 2020, though the former two provinces showed an uptick in the gap during 2020. In Manitoba, the gap between the Indigenous and non-Indigenous unemployment rates grew, while in Alberta the gap narrowed slightly by 2019 but grew in 2020. The Atlantic provinces saw a large increase in the unemployment gap by 2019, but it fell to slightly below its previous level in 2020 (see figures 13 and 14).
As with the unemployment rate, the gap between the Indigenous and non-Indigenous participation rate for all of Canada was nearly identical in 2008, 2019, and 2020, but this hides substantial variation at the provincial level. In Ontario, Saskatchewan, and the Atlantic provinces, the Indigenous participation rate was closer to the non-Indigenous rate in 2019 and 2020 than it was in 2008. The opposite was true for Quebec, where the gap was wider in 2019 and 2020 compared to 2008. In Alberta and British Columbia, the gap was narrower in 2019, but widened in 2020, suggesting that the impact of the pandemic on Indigenous communities may have caused a turn for the worse in these provinces. The opposite was true in Manitoba, where the gap saw a net increase by 2019 but fell in 2020 (see figures 15 and 16).
The employment rate followed a similar pattern. At the national level, the large gap between Indigenous and non-Indigenous Canadians saw a net reduction of only about half a percentage point by 2019 and 2020. With the exception of Manitoba, every region saw a net narrowing of the employment gap between 2008 and 2019. However, Indigenous employment rates fell sharply in 2020 in Quebec, Alberta, and British Columbia—much more sharply than they did for non-Indigenous people in the same provinces—making the gap even higher in 2020 than it was in 2008. The gap in 2020 was smaller than in 2019 in Atlantic Canada, Ontario, Manitoba, and Saskatchewan (see figures 17 and 18).
At the national level, there has been relatively little change in the labour-market characteristics of Indigenous people since 2008, both in absolute terms and relative to the non-Indigenous population, but the picture varies in different parts of the country. In some regions, the gap between Indigenous and non-Indigenous communities narrowed somewhat, on a net basis, between 2008 and 2019. Several provinces saw the gap on certain measures narrow substantially. However, the variable progress in some places was offset by a widening of the gap in others during the same period. In addition, 2020 substantially increased the gap between Indigenous and non-Indigenous people in some areas—particularly Quebec, Alberta, and British Columbia—which suggests that Indigenous people may be more vulnerable to labour-market downturns or more vulnerable to the economic effects of COVID-19 than the rest of the population.
Wages and Hours
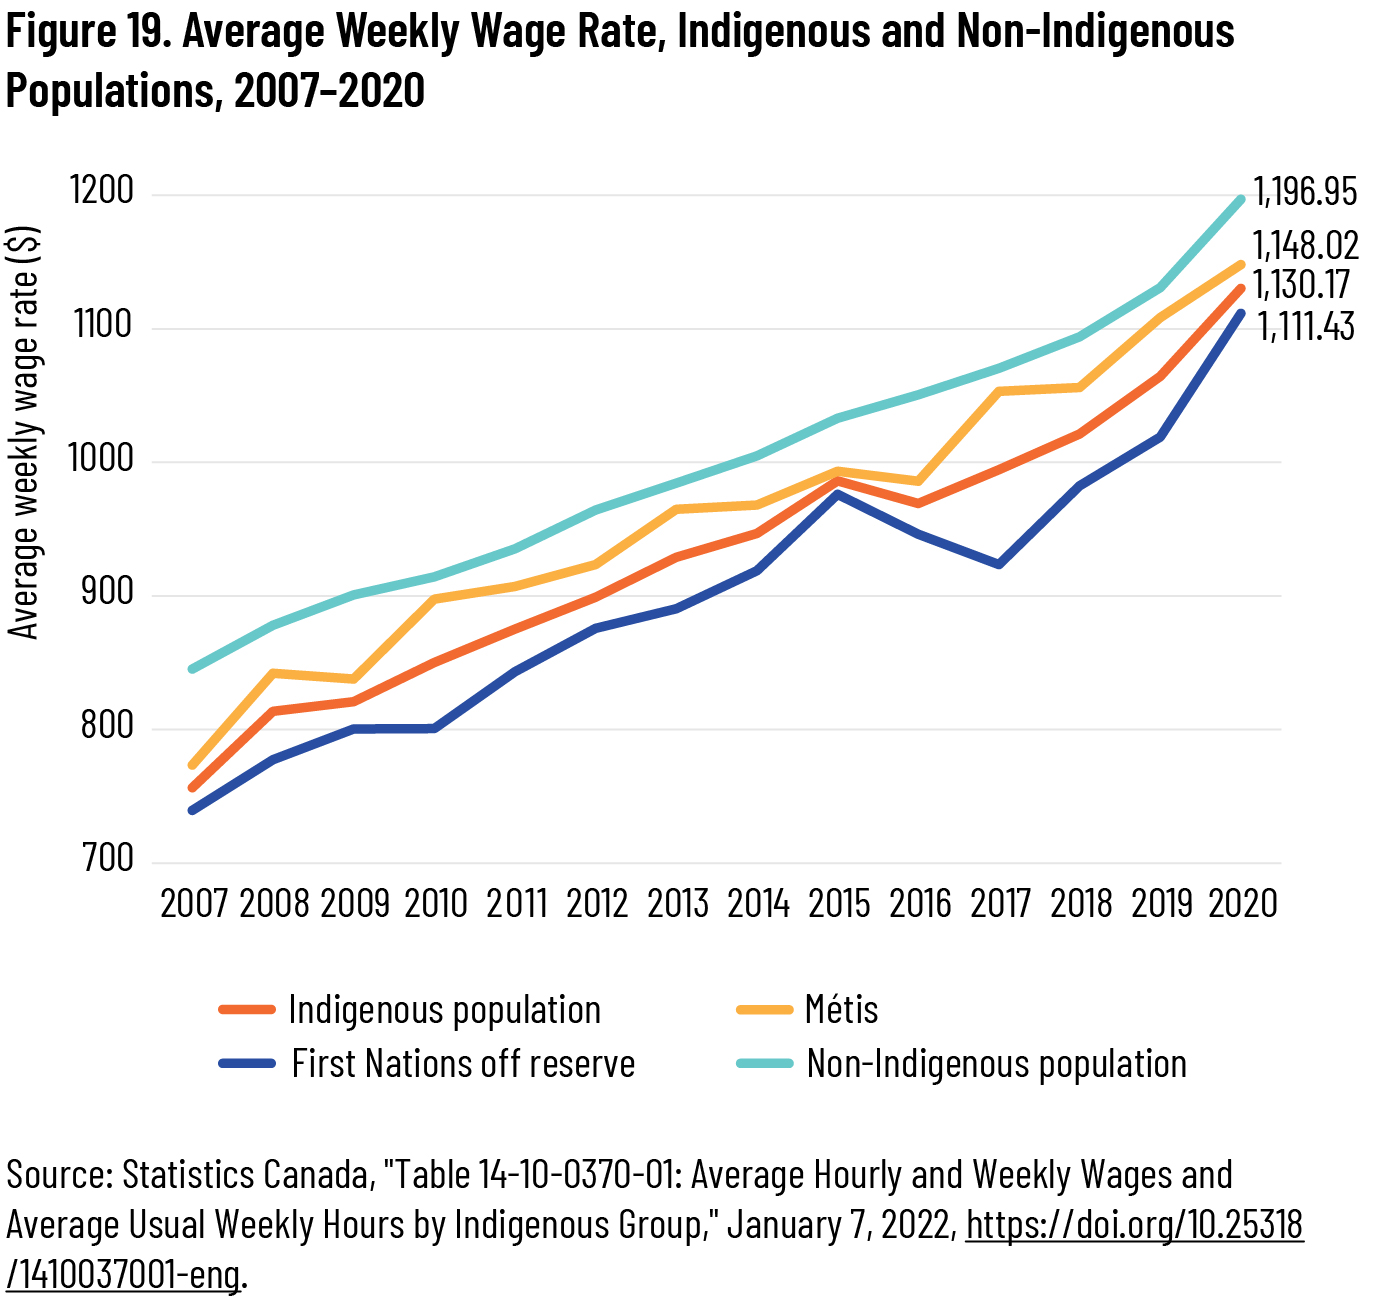
Indigenous people in Canada earn less than their non-Indigenous counterparts. The average weekly wage rate for Indigenous people was about $1,130 in 2020, up $316 from 2008 but still about $67 lower than the non-Indigenous weekly wage rate. 14 14 All figures are in current dollars—that is, they represent income in the year in which the earner received it, without indexing to inflation. Consistent with some of the other economic indicators discussed above, wages for First Nations living off reserve are slightly lower than the Indigenous average, and wages for Métis are slightly higher. Weekly wages for Indigenous people grew slightly more between 2008 and 2020 (38.9 percent compared to 36.3 percent for non-Indigenous Canadians), which was enough to narrow the wage gap as a proportion of earnings (from 7.9 to 5.9 percent) but not enough to shrink the dollar value of the gap, which grew from $64 to $67 weekly. Therefore, not only do Indigenous people experience more unemployment on average than non-Indigenous people, but they also make less than the rest of the population. Indigenous wages are growing, but not quickly enough to have caught up to the rest of the country (see figure 19).
The weekly wage gap becomes even more striking in light of data on average usual weekly hours, which indicate that, apart from a brief period in 2016 and 2017, Indigenous people in Canada have worked slightly more than non-Indigenous Canadians since 2008. This gap has narrowed since 2008: in 2020, the average Indigenous person worked about 0.4 hours more each week than the average non-Indigenous worker, compared to 0.7 hours more in a typical 2008 week. In most of the years between 2008 and 2020, usual weekly hours were higher for Métis and lower for First Nations living off reserve (see figure 20).
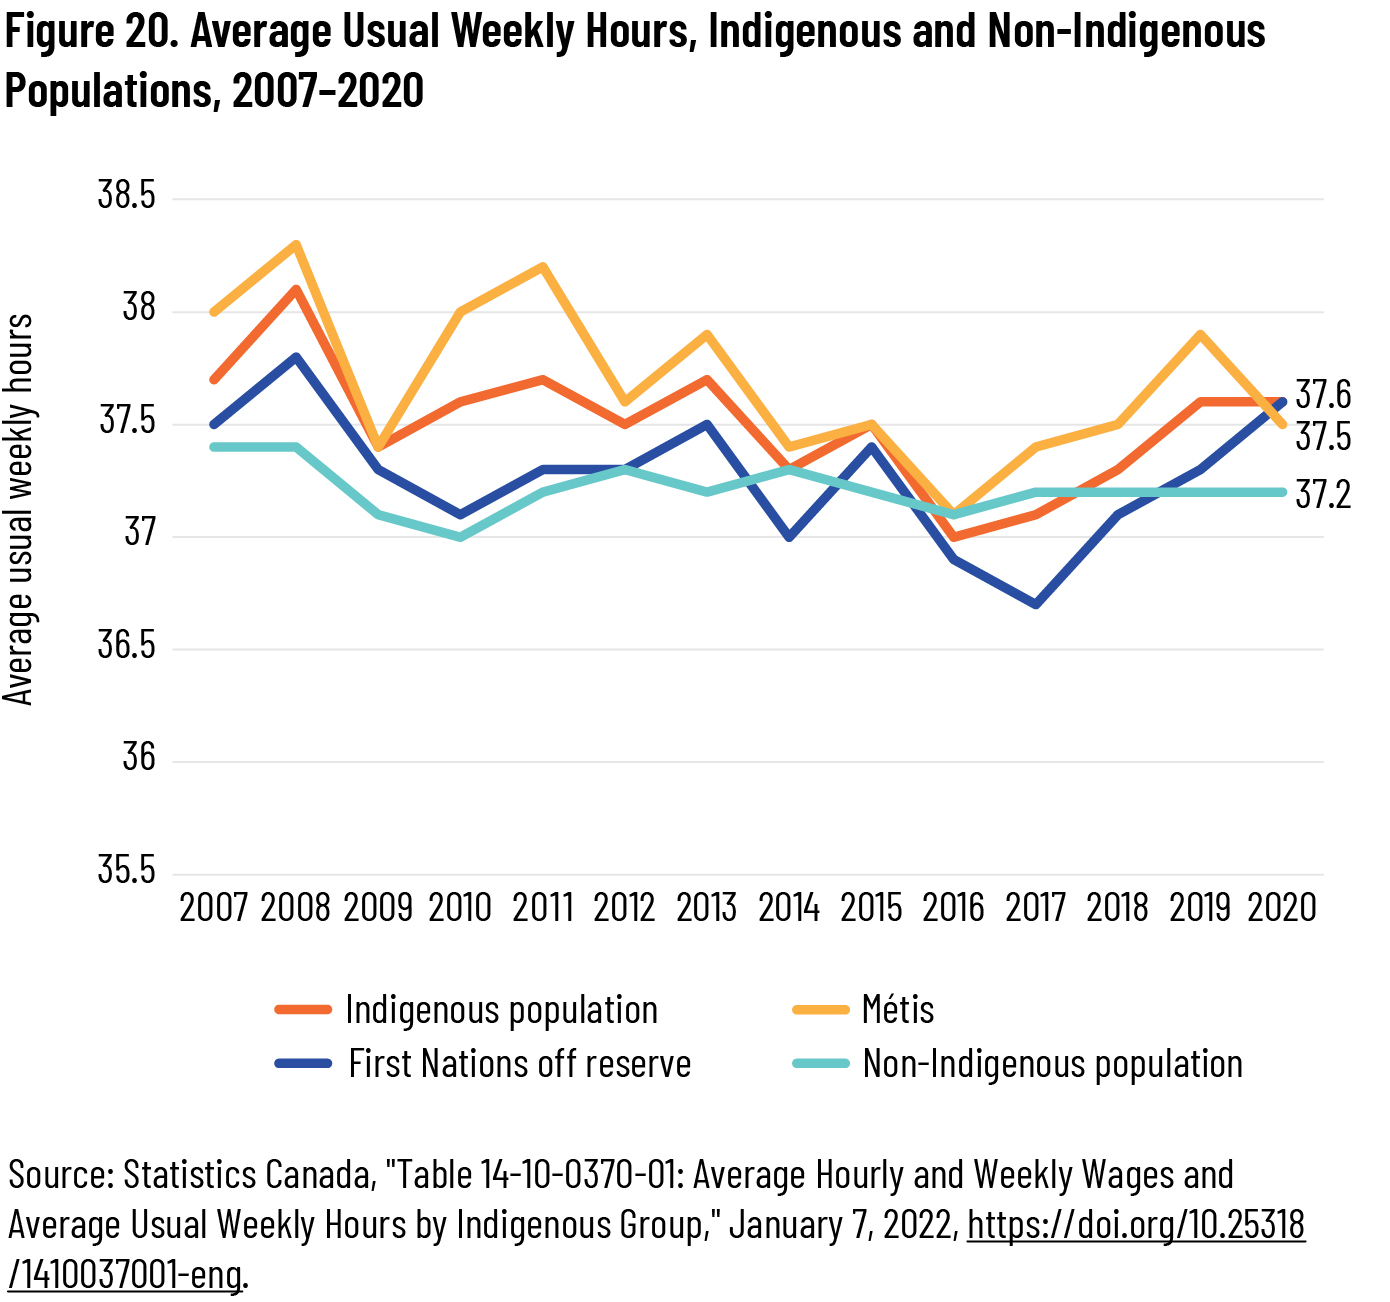
When the government of Canada delivered its apology in 2008, the average Indigenous person working fifty weeks each year was putting in thirty-five hours more than the average non-Indigenous worker but earning $3,219 less per year. By 2020, he or she was working an average of twenty hours more than non-Indigenous Canadians and making about $3,339 less. 15 15 For these figures, “average” refers to an individual working the average usual weekly hours and the average weekly wage rate.
Industries
In this section, we review Statistics Canada data on the distribution of Indigenous and non-Indigenous workers across various types of industries and how this has changed since 2008.
Statistics Canada uses the North American Industry Classification System (NAICS), which assigns each sector a code. 16 16 To review the full list of sectors and codes, see United States Census Bureau, “Economic Census: NAICS Codes and Understanding Industry Classification Systems,” November 22, 2021, https://www.census.gov/programs-surveys/economic-census/guidance/understanding-naics.html. Industry estimates in this paper are based on the 2017 NAICS. A worker’s industry code is based on the kind of work carried out by their employer at their main job. Thus, a human resources administrator for a construction company would be classified by Statistics Canada under NAICS code 23, construction, even though the employee’s day-to-day work is administrative.
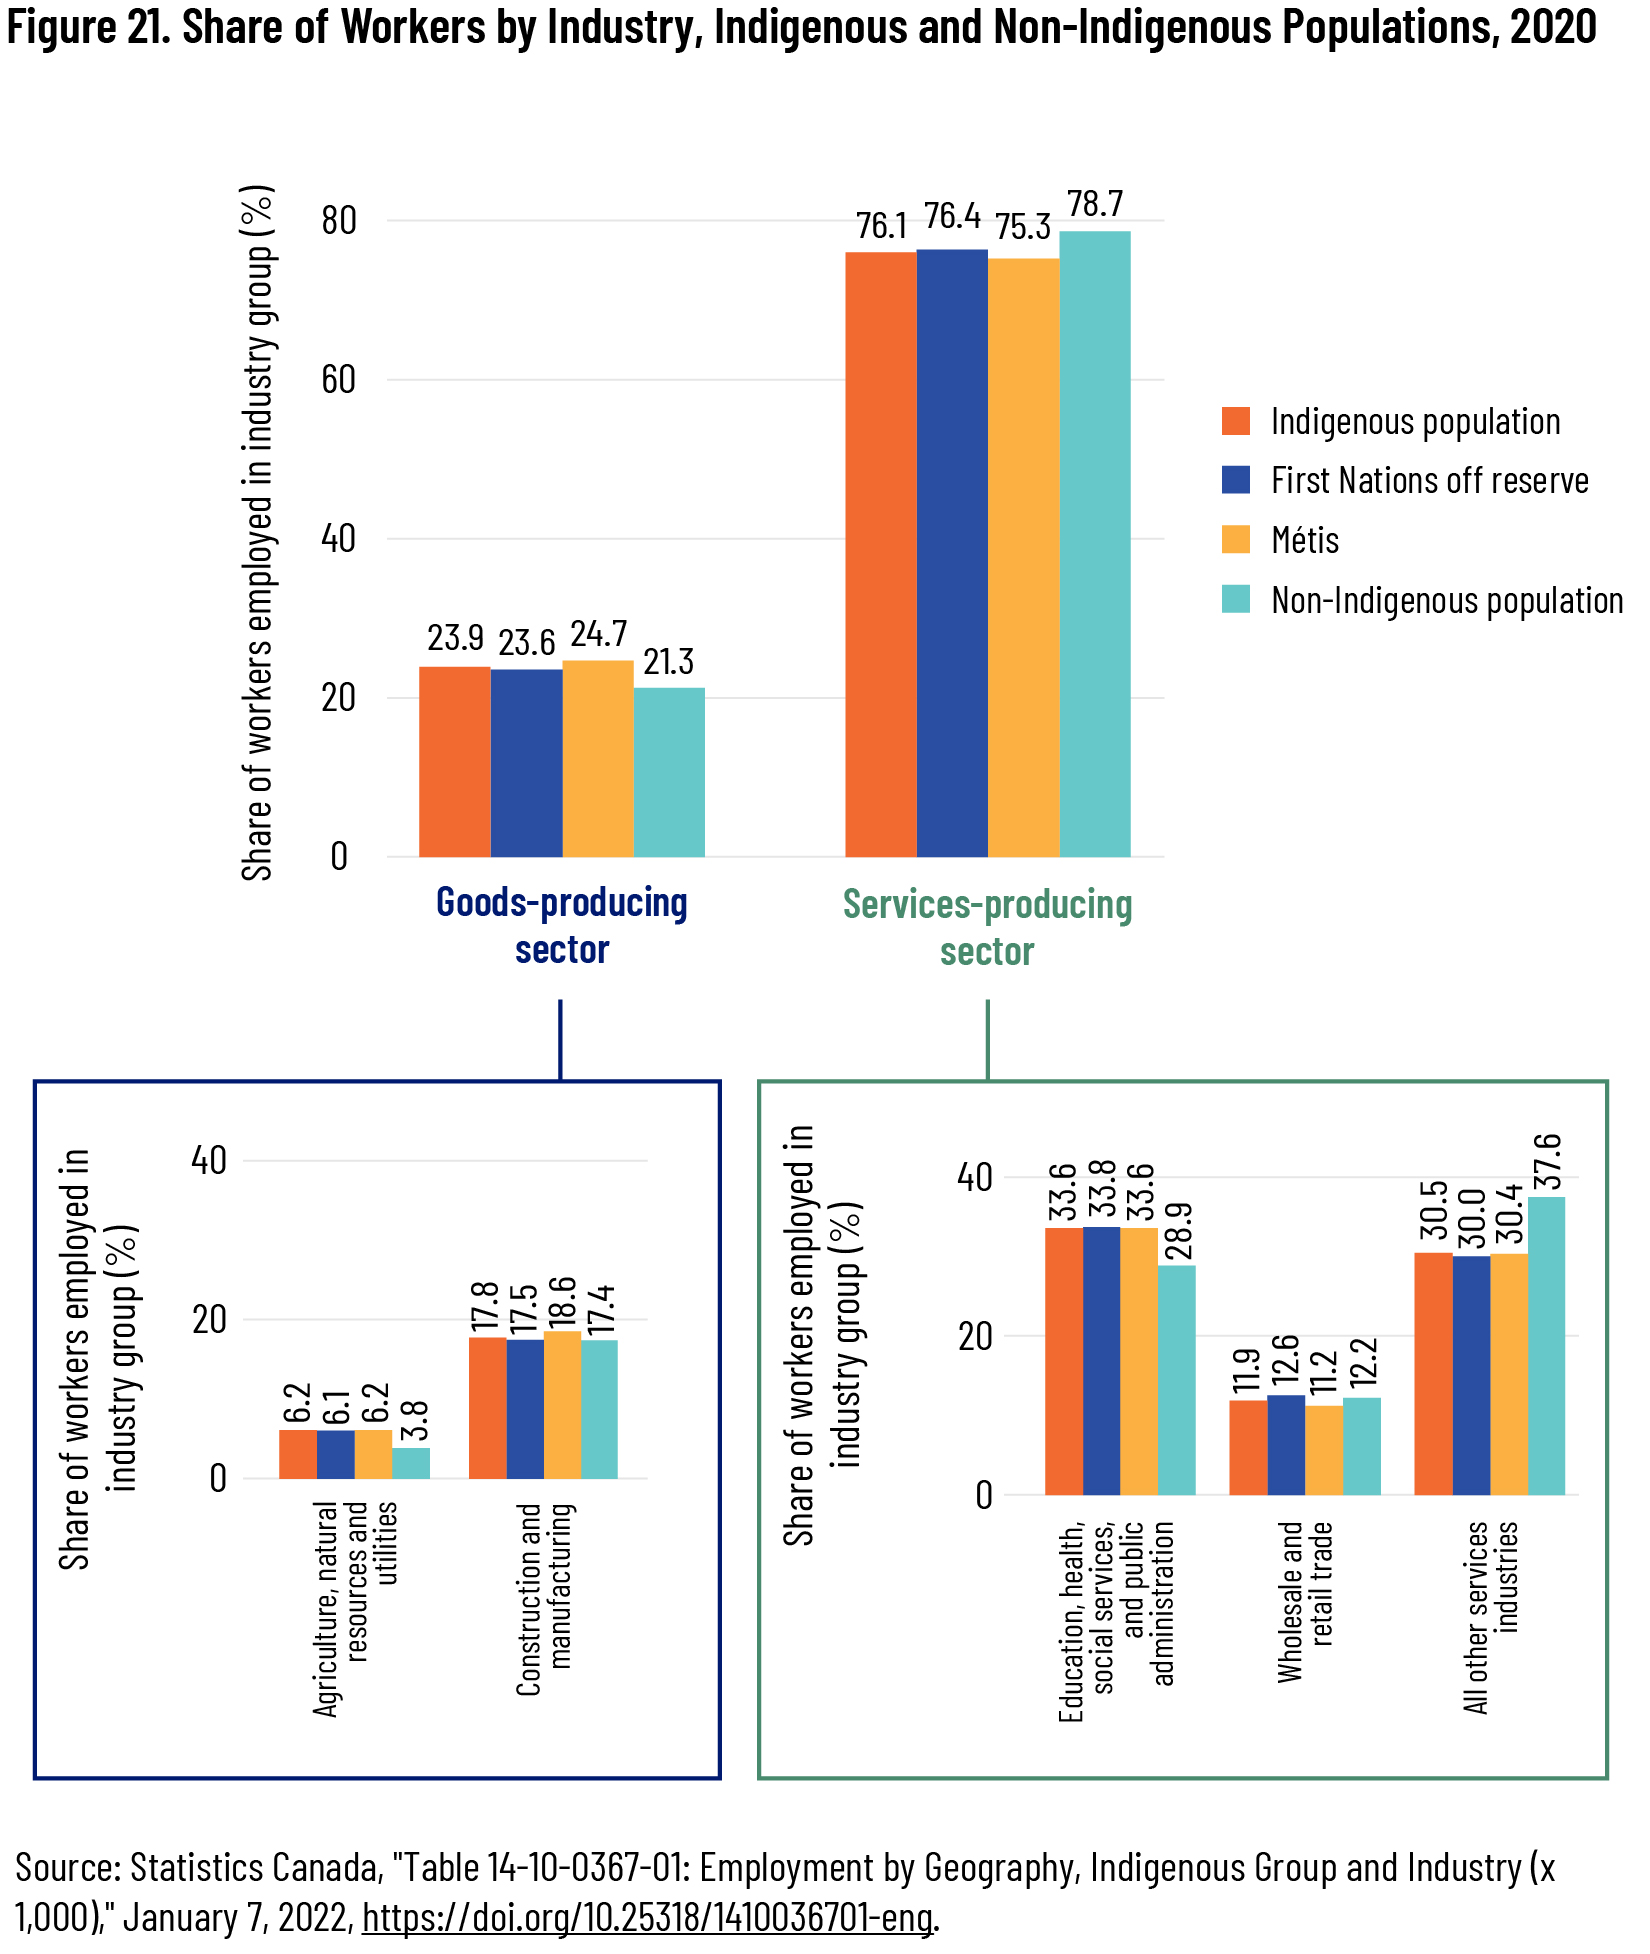
In 2020, the distribution of Indigenous workers by industry was broadly similar to the rest of Canada. Just over three-quarters (76.1 percent) of Indigenous workers were employed in the services-producing sector, slightly less than non-Indigenous people (78.7 percent). Around 12 percent of both Indigenous and non-Indigenous workers were employed in wholesale or retail trade. Within the services sector, compared with other Canadians, Indigenous people are employed in greater proportion in education, health, social services, and public administration.
Indigenous people were employed in slightly greater proportion in the goods-producing sector overall (23.9 percent compared to 21.3 percent for the rest of Canada) and particularly in the agriculture, natural resources, and utilities sector (6.2 percent versus 3.8 percent). The share of workers employed in the construction and manufacturing sector was nearly identical for all populations (see figure 21). 17 17 In this paragraph and in figure 21, “Agriculture, natural resources, and utilities” and “Construction and manufacturing” are subsets of “Goods-producing sector.” Similarly, “Wholesale and retail trade,” “Education, health, social service, and public administration,” and “All other services industries” are subsets of “Services-producing sector.”
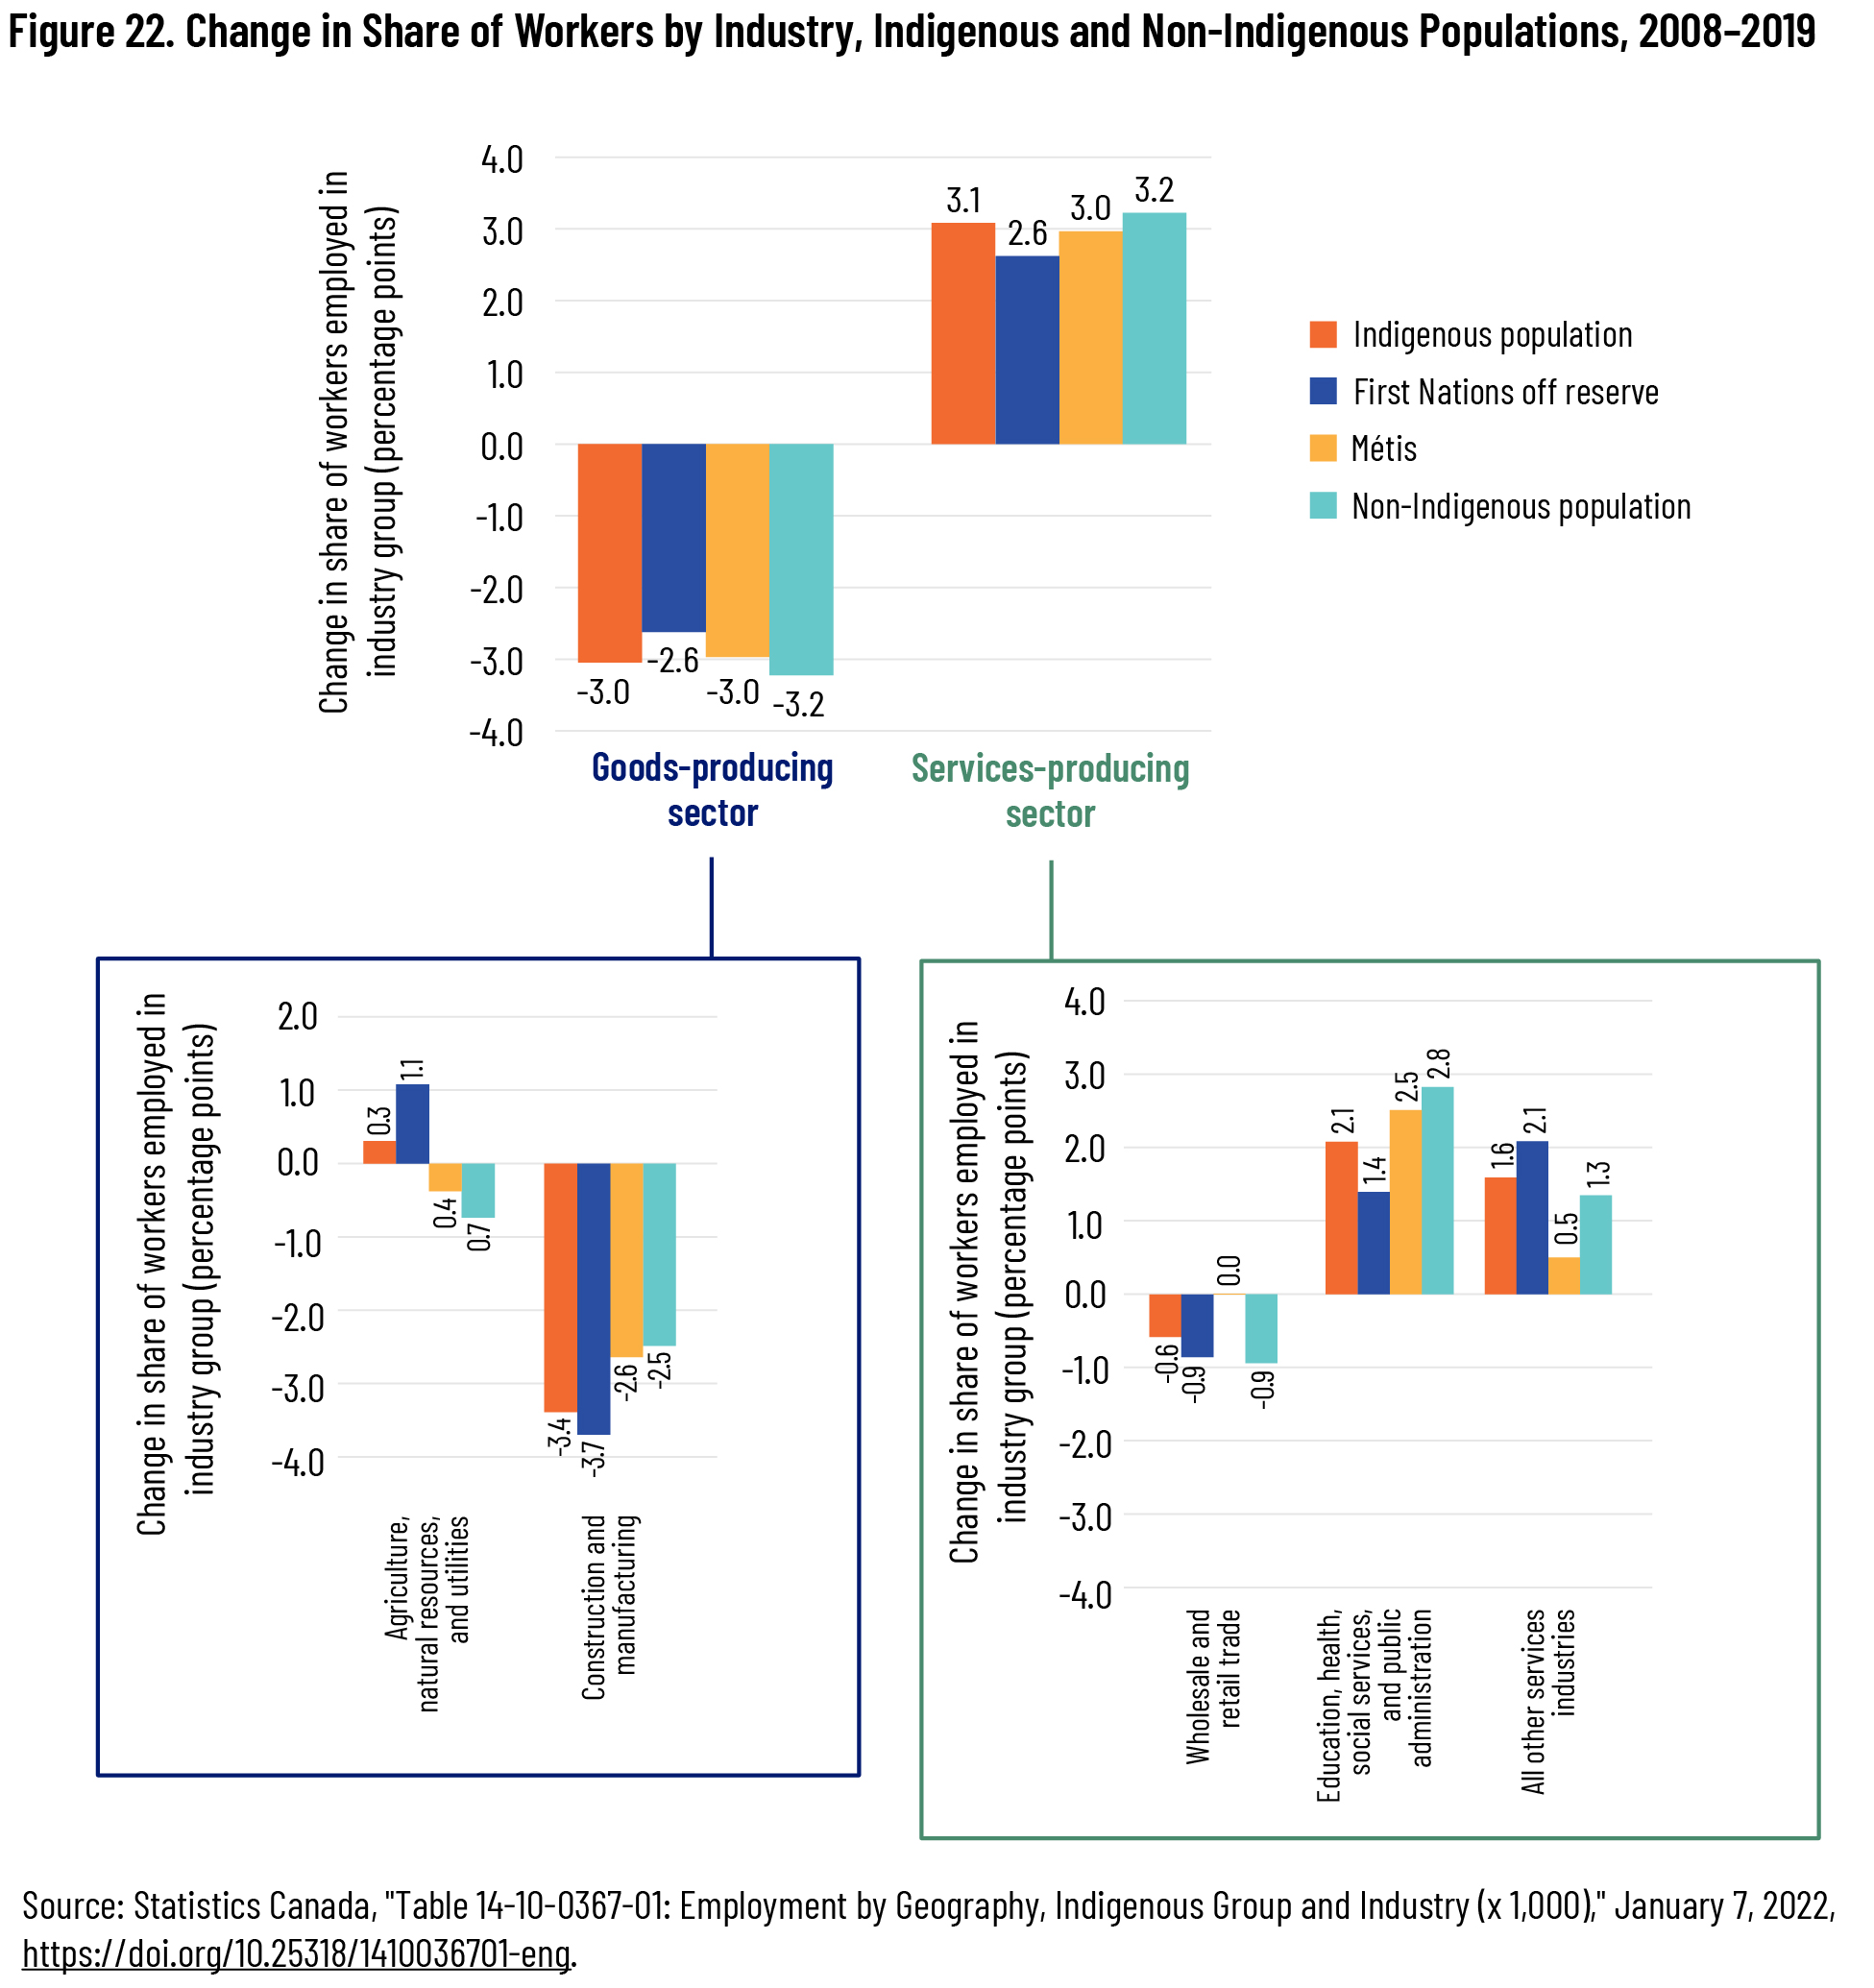
These statistics represent a change since 2008. For both Indigenous and non-Indigenous workers, there has been a shift from the goods-producing sector, especially from construction and manufacturing, to the services-producing sector, especially to education, health, social services, and public administration (see figure 22).
Between 2019 and 2020, only small changes in the goods-producing sector occurred for Indigenous people. The pandemic appears to have had a larger impact within the services-producing sector than between the goods- and services-producing sectors. For all populations, there was a net shift from “all other services industries” to education, health, social services, and public administration. This shift was even more pronounced for Indigenous people. For example, the share of First Nations people living off reserve working in “all other services industries” fell by 5.4 percentage points (compared to less than half a percentage point for non-Indigenous people) and the share working in education, health, social services, and public administration increased by 3.3 percentage points (compared to less than one percentage point for non-Indigenous people) (see figures 22 and 23).
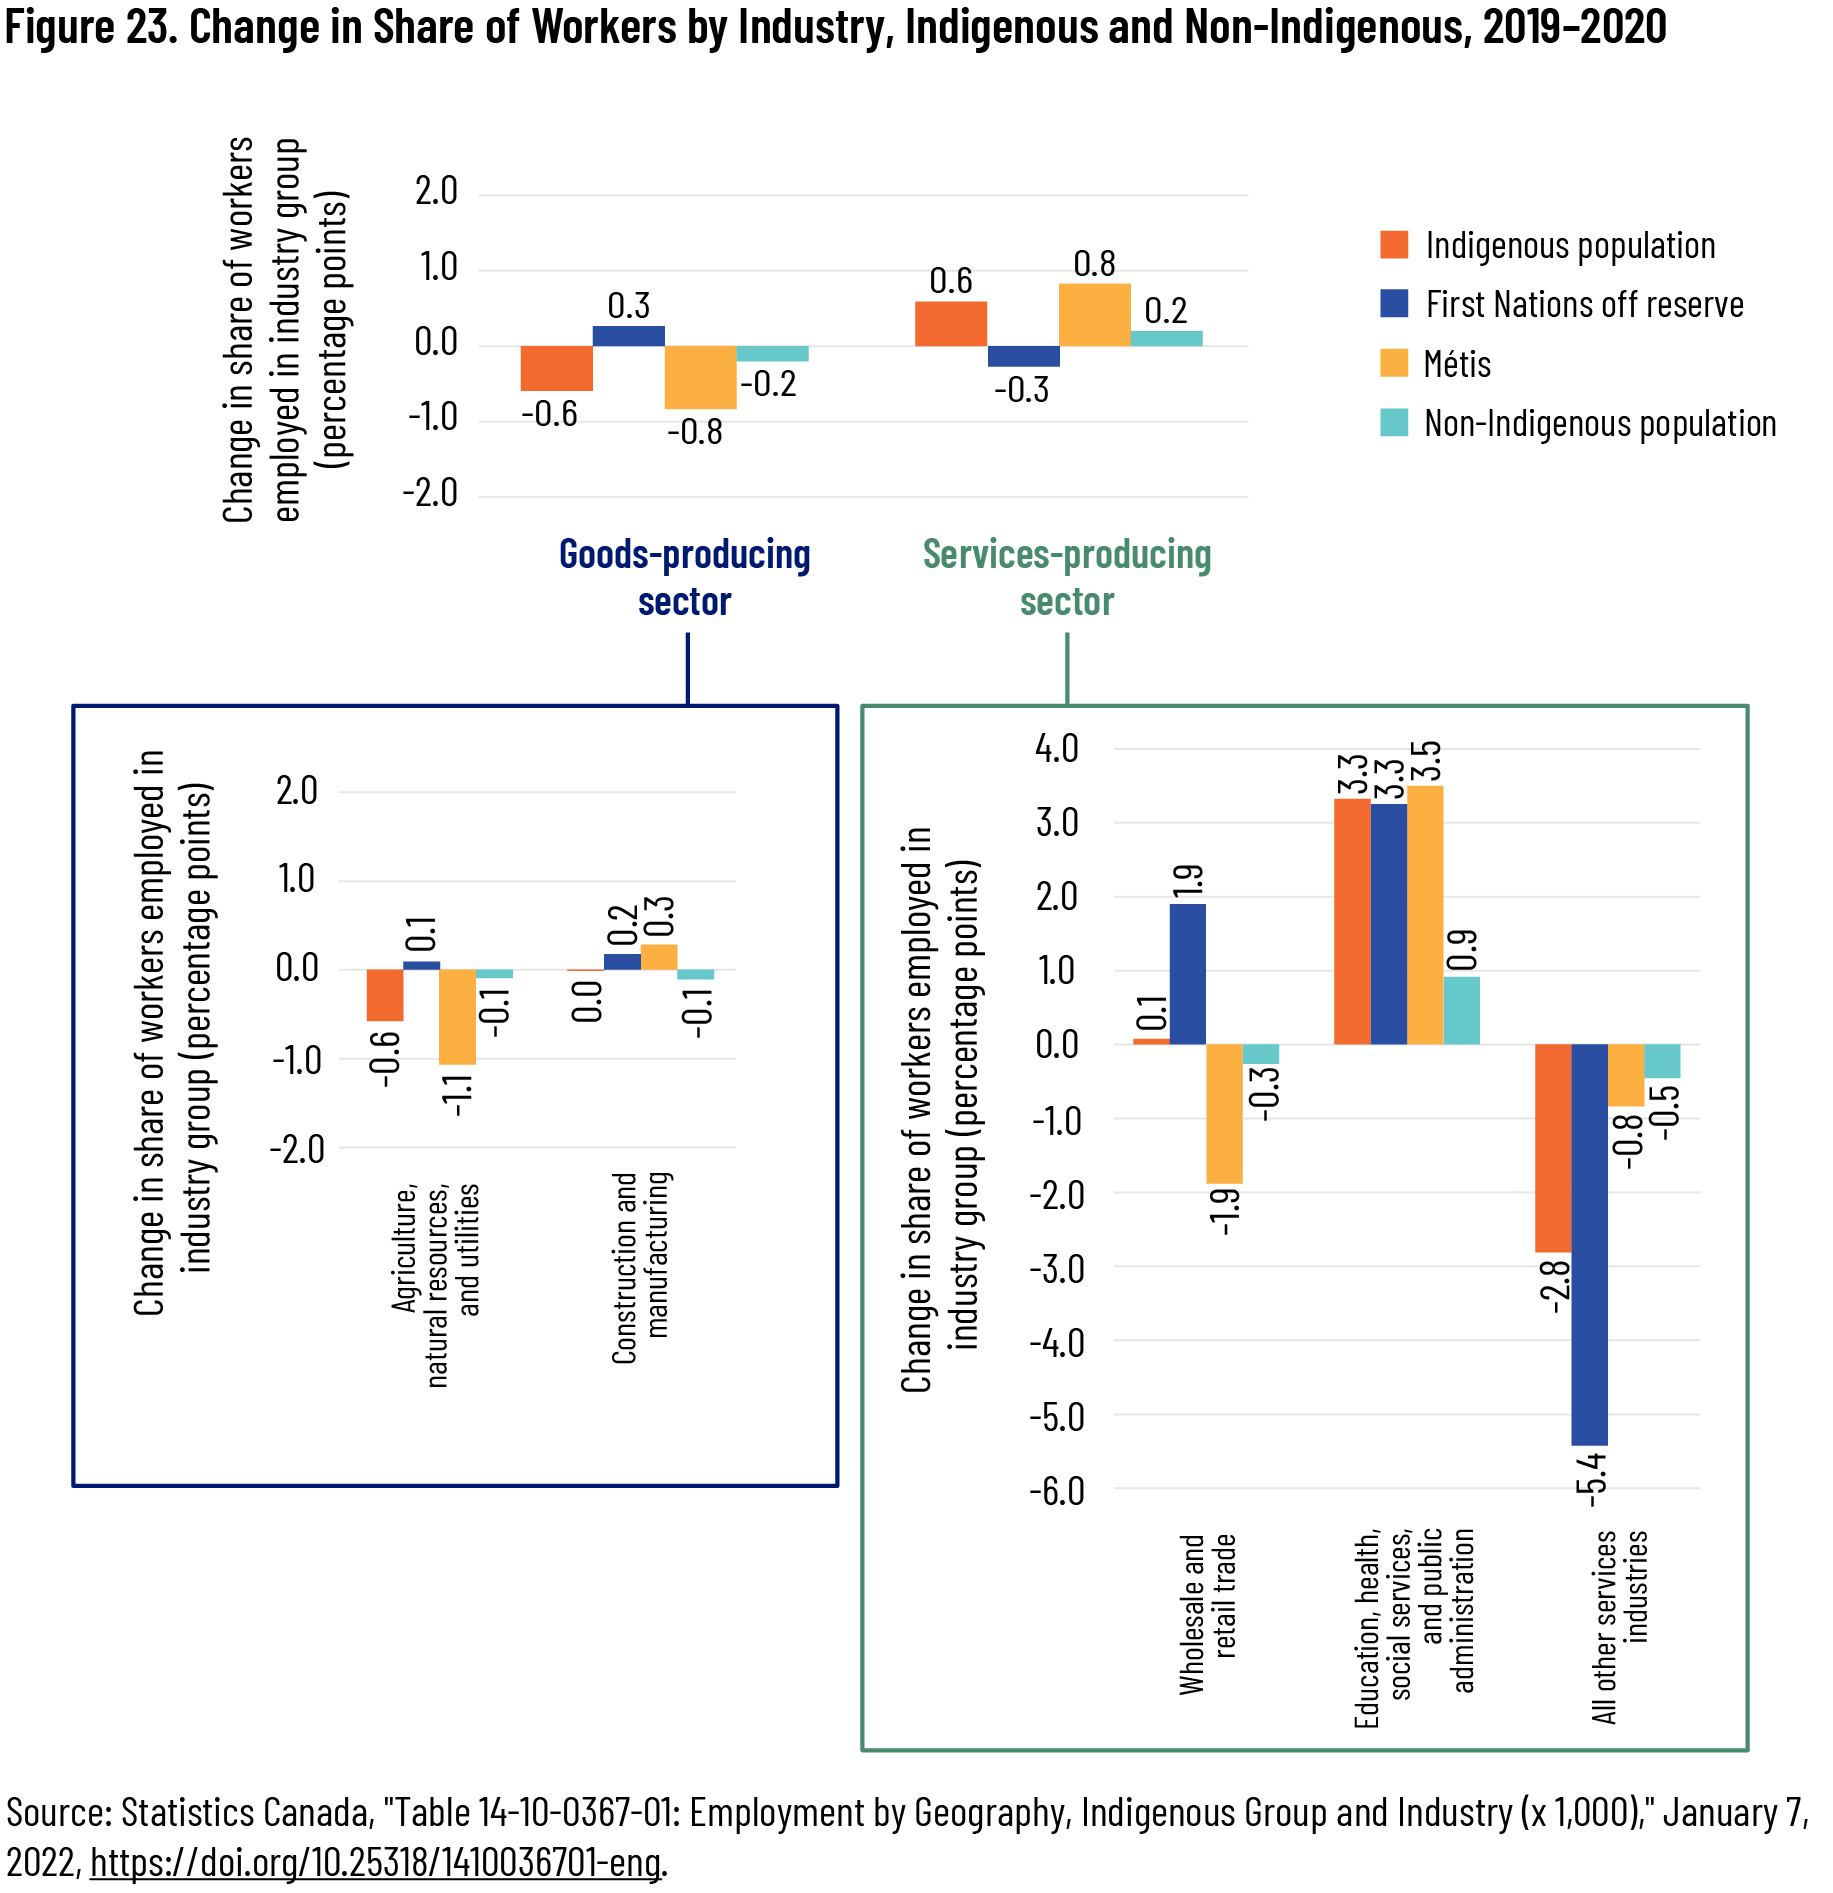
The shift among Indigenous workers since 2008 from the goods-producing sector to the services-producing sector is noteworthy, though it matches similar trends seen among non-Indigenous workers. Insofar as the pandemic showed different movements, it is likely too early to draw conclusions as to whether these represent longer-term changes.
Income
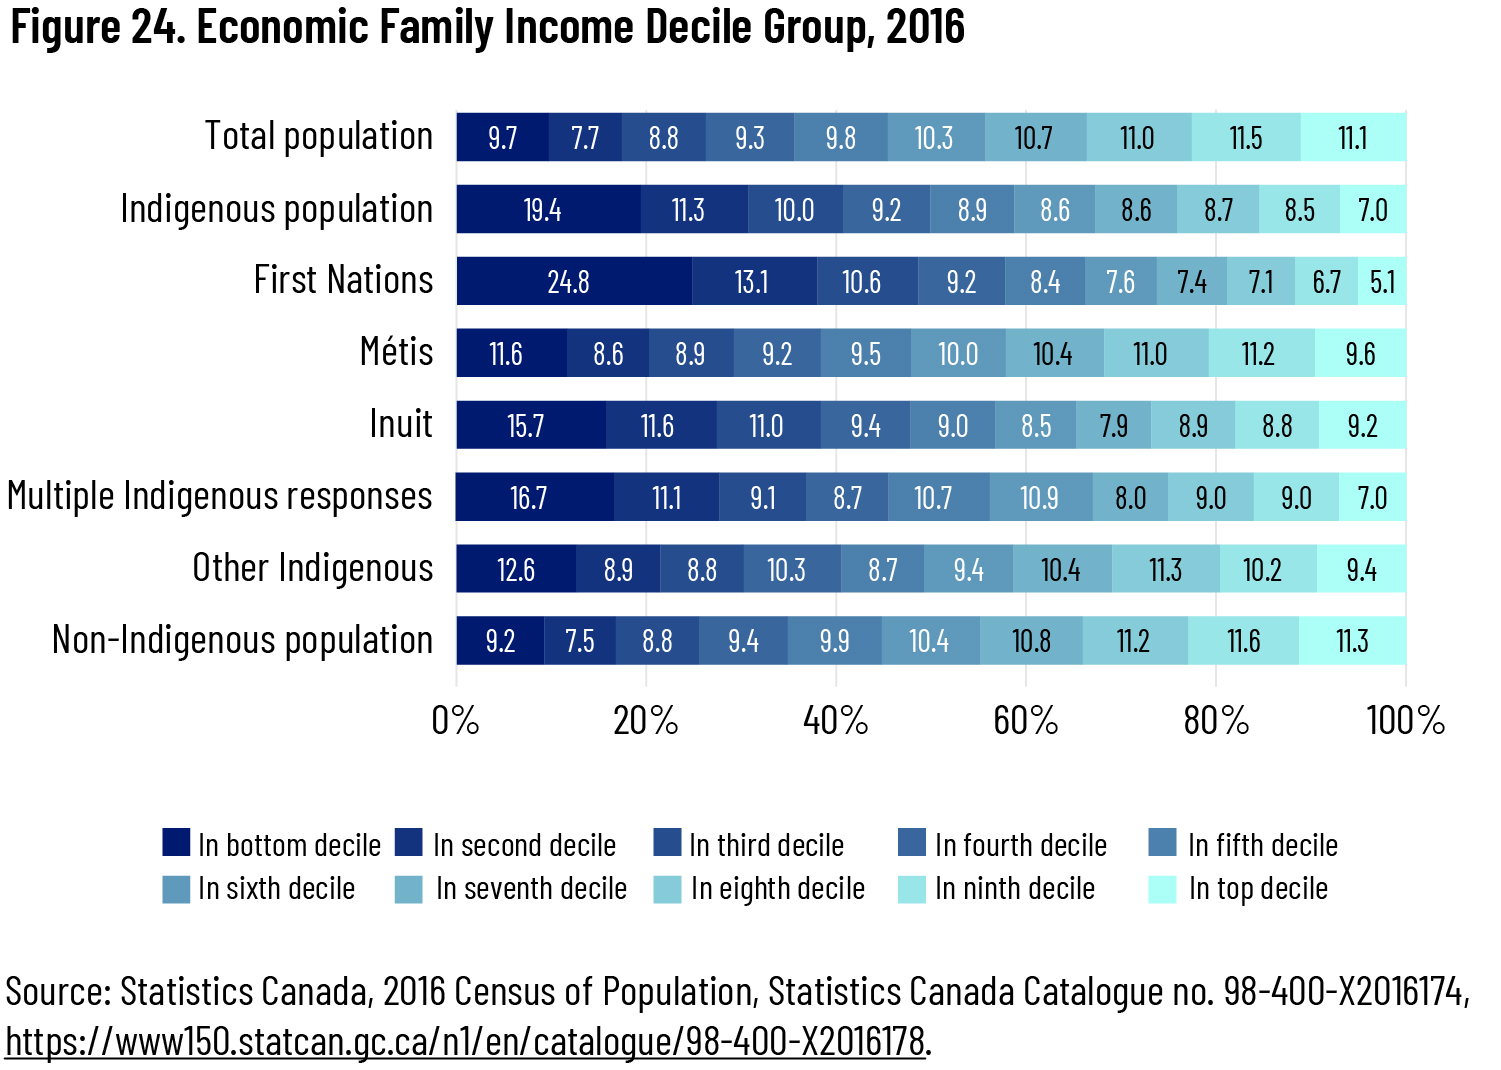
Given the employment and wage disparities that Indigenous people experience, it is unsurprising that they have lower incomes than the rest of the population. In 2016, those identifying as Indigenous on the census were more than twice as likely to be in the bottom income decile—that is, among the 10 percent of Canadians with the lowest incomes in the country—as non-Indigenous Canadians (19.4 percent compared to 9.2 percent). Almost 60 percent of Indigenous people in Canada are in the bottom half of the income distribution, compared to less than 45 percent of the non-Indigenous population. Métis are highest on the Indigenous income distribution, with more than half (52.1 percent) falling in the top half of the distribution of the general population and 11.6 percent in the lowest income decile of the general population. Inuit incomes are also slightly higher than the Indigenous average. 18 18 However, given the high cost of living in the north, Inuit purchasing power may be the same or even lower than that of other Indigenous Canadians despite their higher incomes. First Nations, meanwhile, have substantially lower incomes than even other Indigenous people: almost a quarter (24.8 percent) of First Nations are in the lowest income decile, and nearly two-thirds (66.1 percent) are in the bottom half of Canada’s income distribution (see figure 24 19 19 The reason the deciles for the total population do not align exactly with 10 percent, 20 percent, etc. is that these data in fact represent a subset of the total population, specifically those in the twenty-five-to-fifty-four-years age range, as stated earlier. ).
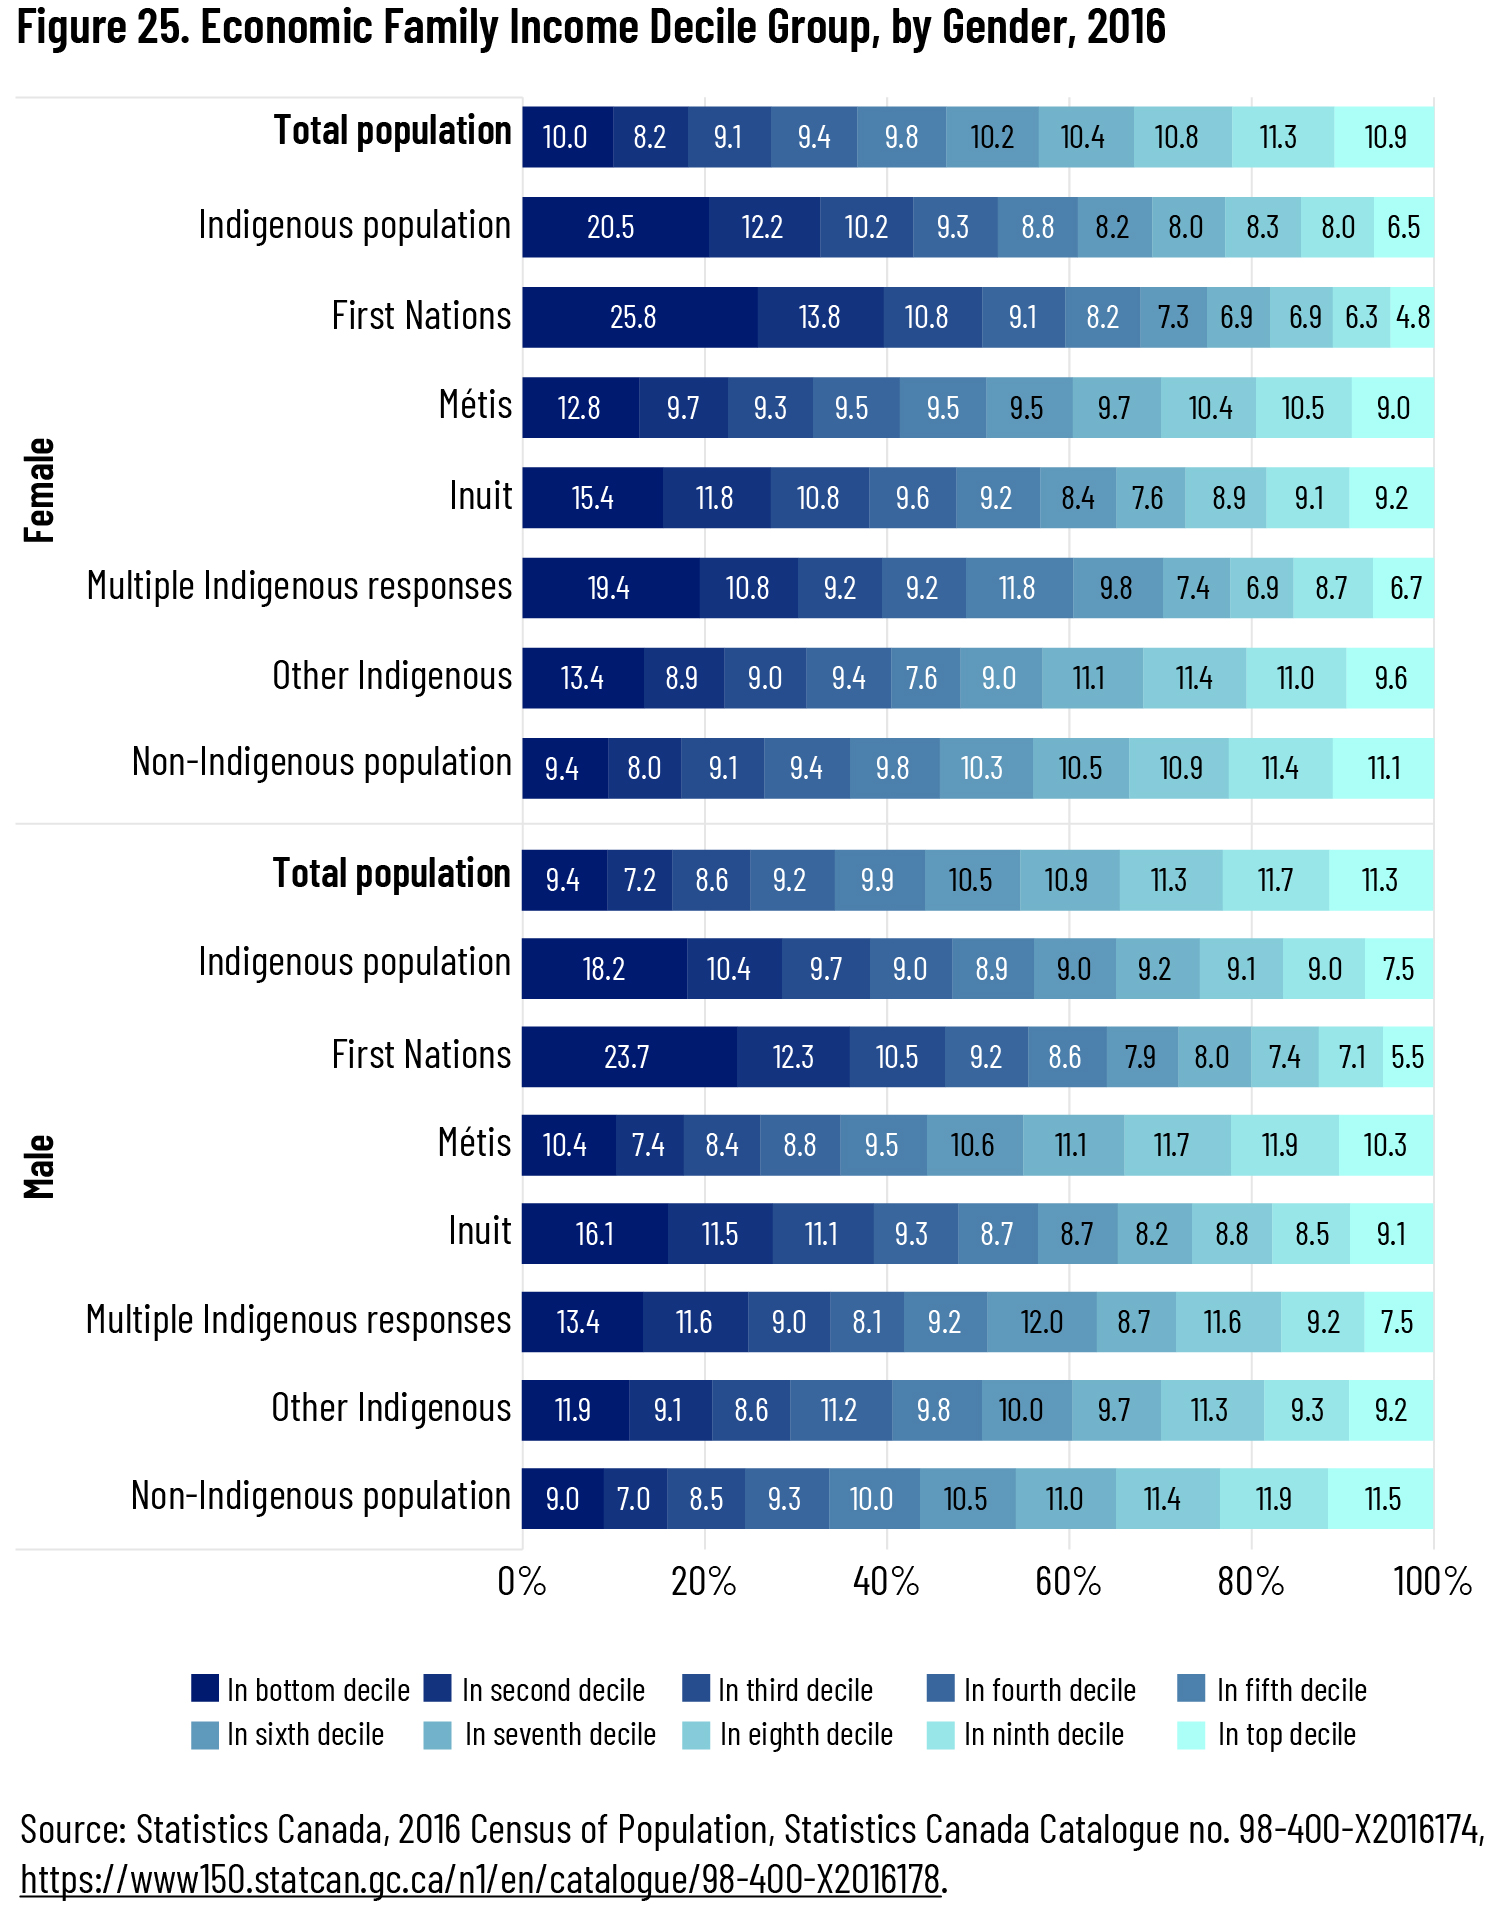
These income disparities are more pronounced for Indigenous women than they are for Indigenous men. More than one-fifth of Indigenous women (20.5 percent) were in the lowest income decile, slightly more than Indigenous men (18.2 percent) and more than double the rest of Canadian women (9.4 percent). A greater proportion of Indigenous men than Indigenous women are in the top half of the income distribution (43.8 percent compared to 39.1 percent). The income disparity is greatest for First Nations women. The proportion of First Nations women in the lowest income decile is almost three times greater than for non-Indigenous men. At the other end of the income spectrum, the proportion of First Nations women in the top income decile is nearly two and a half times less than for non-Indigenous men (see figure 25).
Education
In the section, we examine the link between lower employment rates of Indigenous people and lower levels of educational attainment.
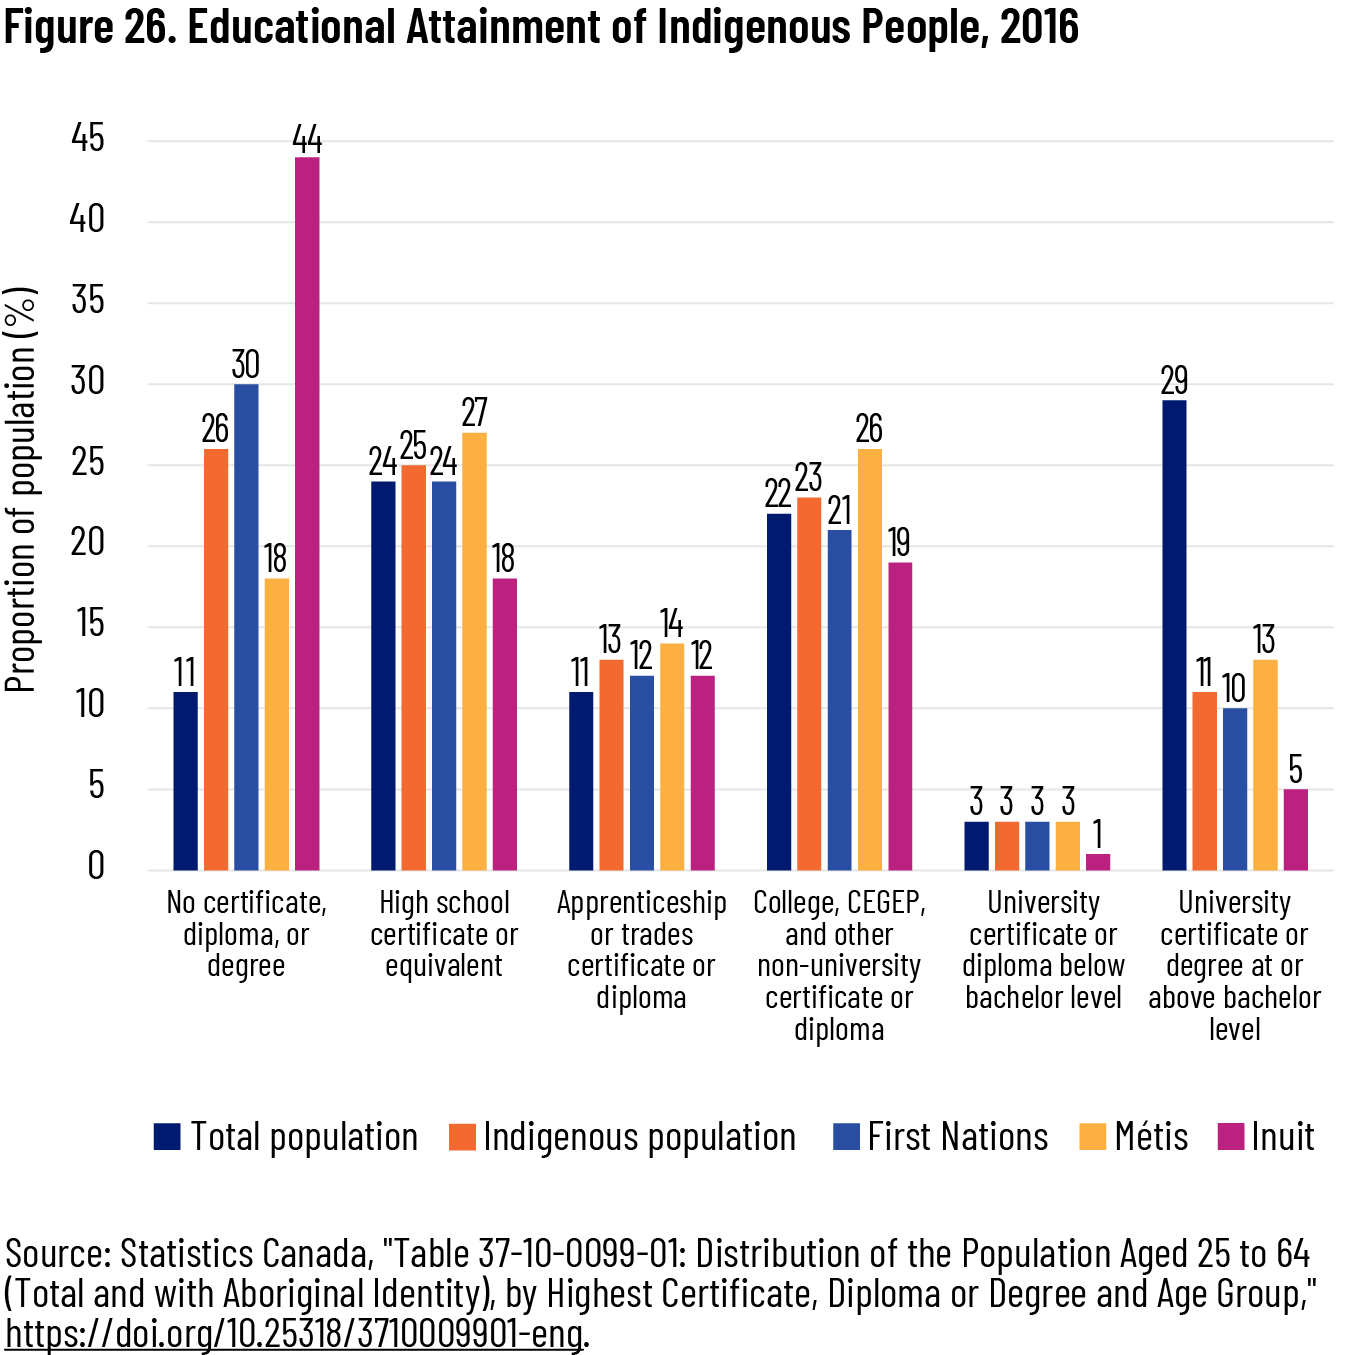
The proportion of Indigenous people without a post-secondary certificate, diploma, or degree is more than twice that of the total Canadian population. The proportion of Indigenous people who have completed a university certificate or degree at or above bachelor level is nearly three times less than that of the general population. The education gap is particularly stark for Inuit. However, the proportion of Indigenous Canadians with an apprenticeship, trades, or college certificate or diploma is slightly larger than for the general population (see figure 26).
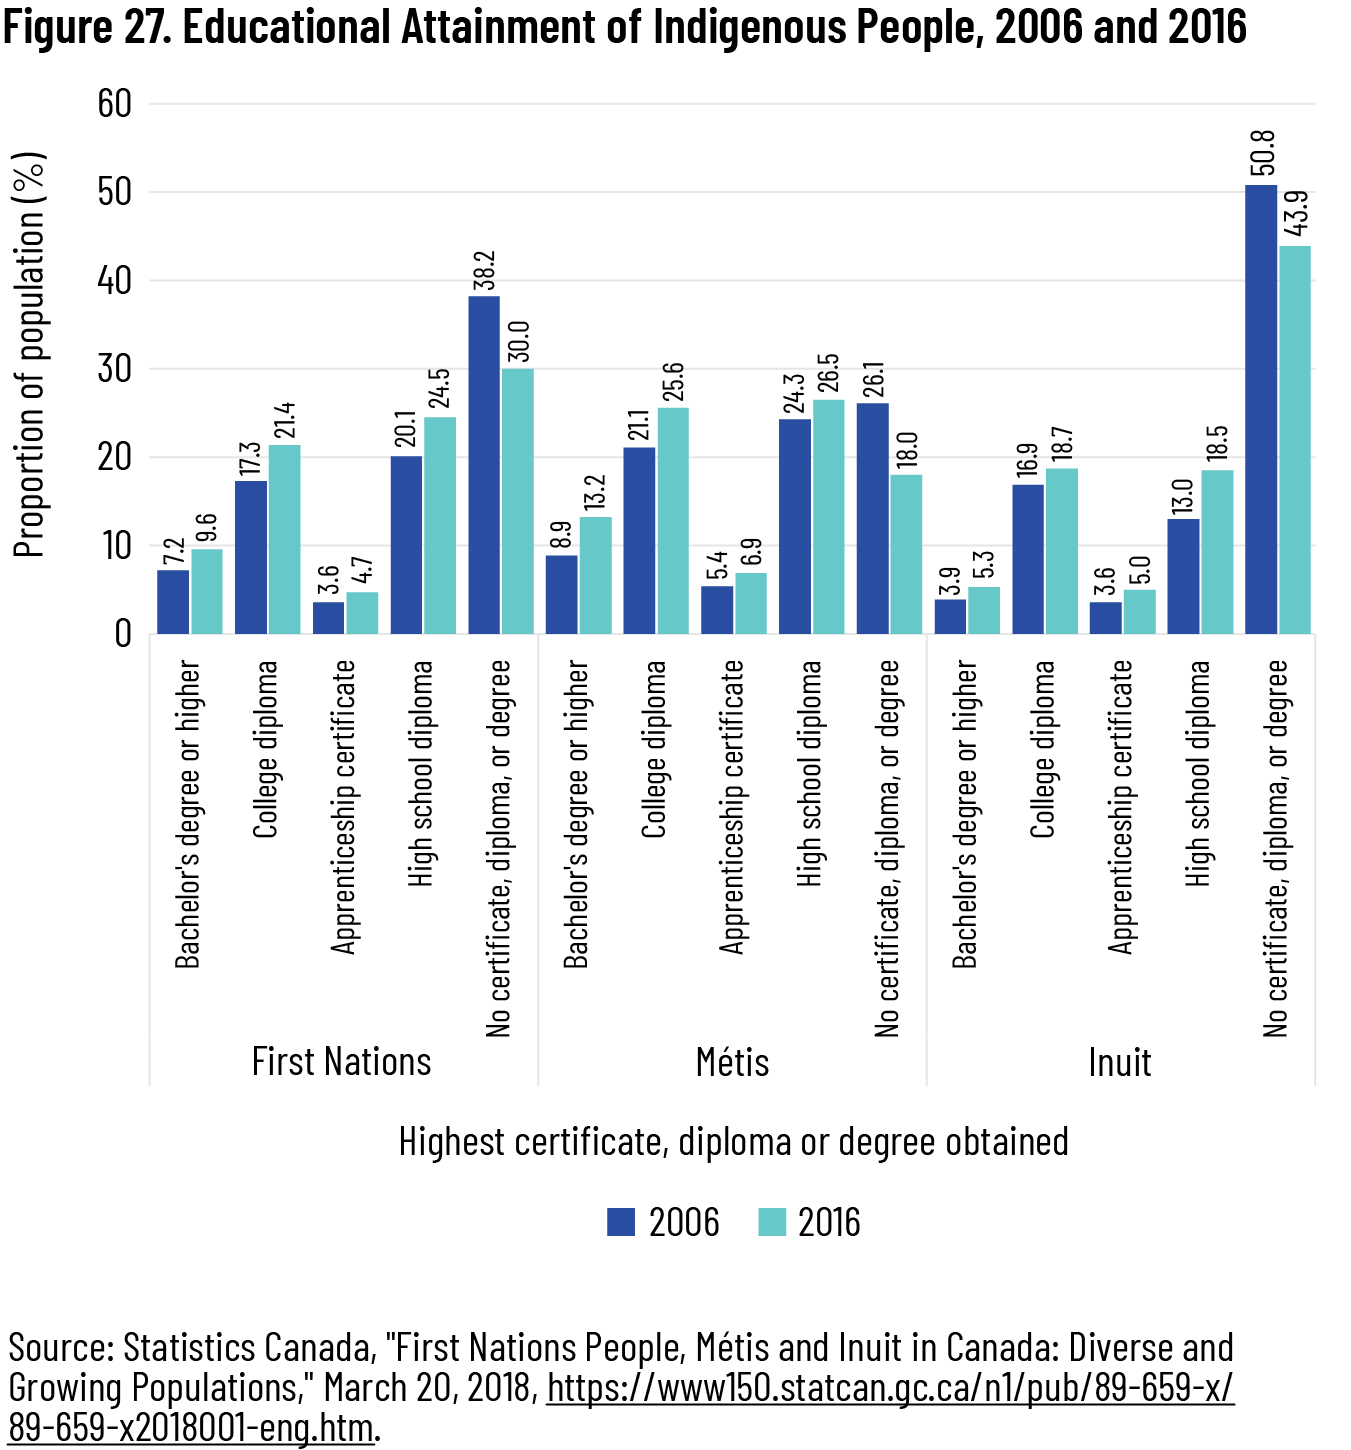
Indigenous education levels are increasing, however. Between 2006 and 2016, educational attainment saw a net increase at every level for all Indigenous groups: the proportion of the population holding a high school diploma, apprenticeship certificate, college diploma, and bachelor’s degree or higher all increased, while the proportion of those without any of these fell by seven to eight percentage points (see figure 27). 20 20 The differences in data between figures 26 and 27 may be attributable to differences in categorization of educational attainment. For example, figure 26 includes trades certificates alongside apprenticeship certificates, whereas figure 27 does not.
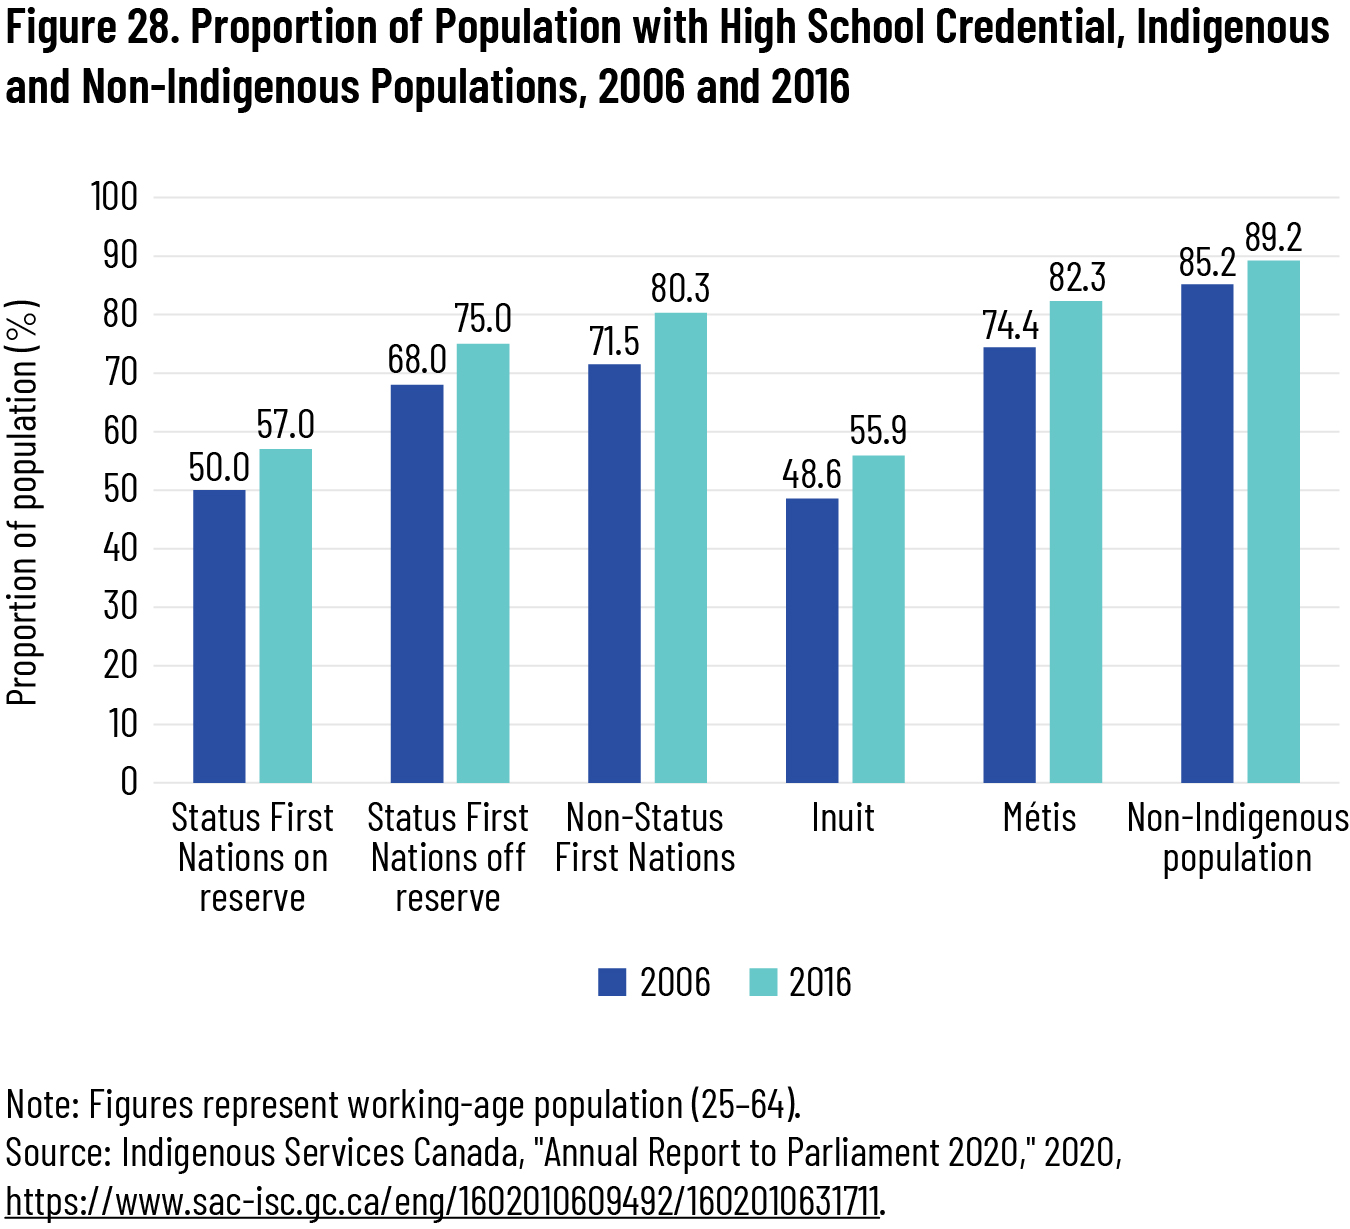
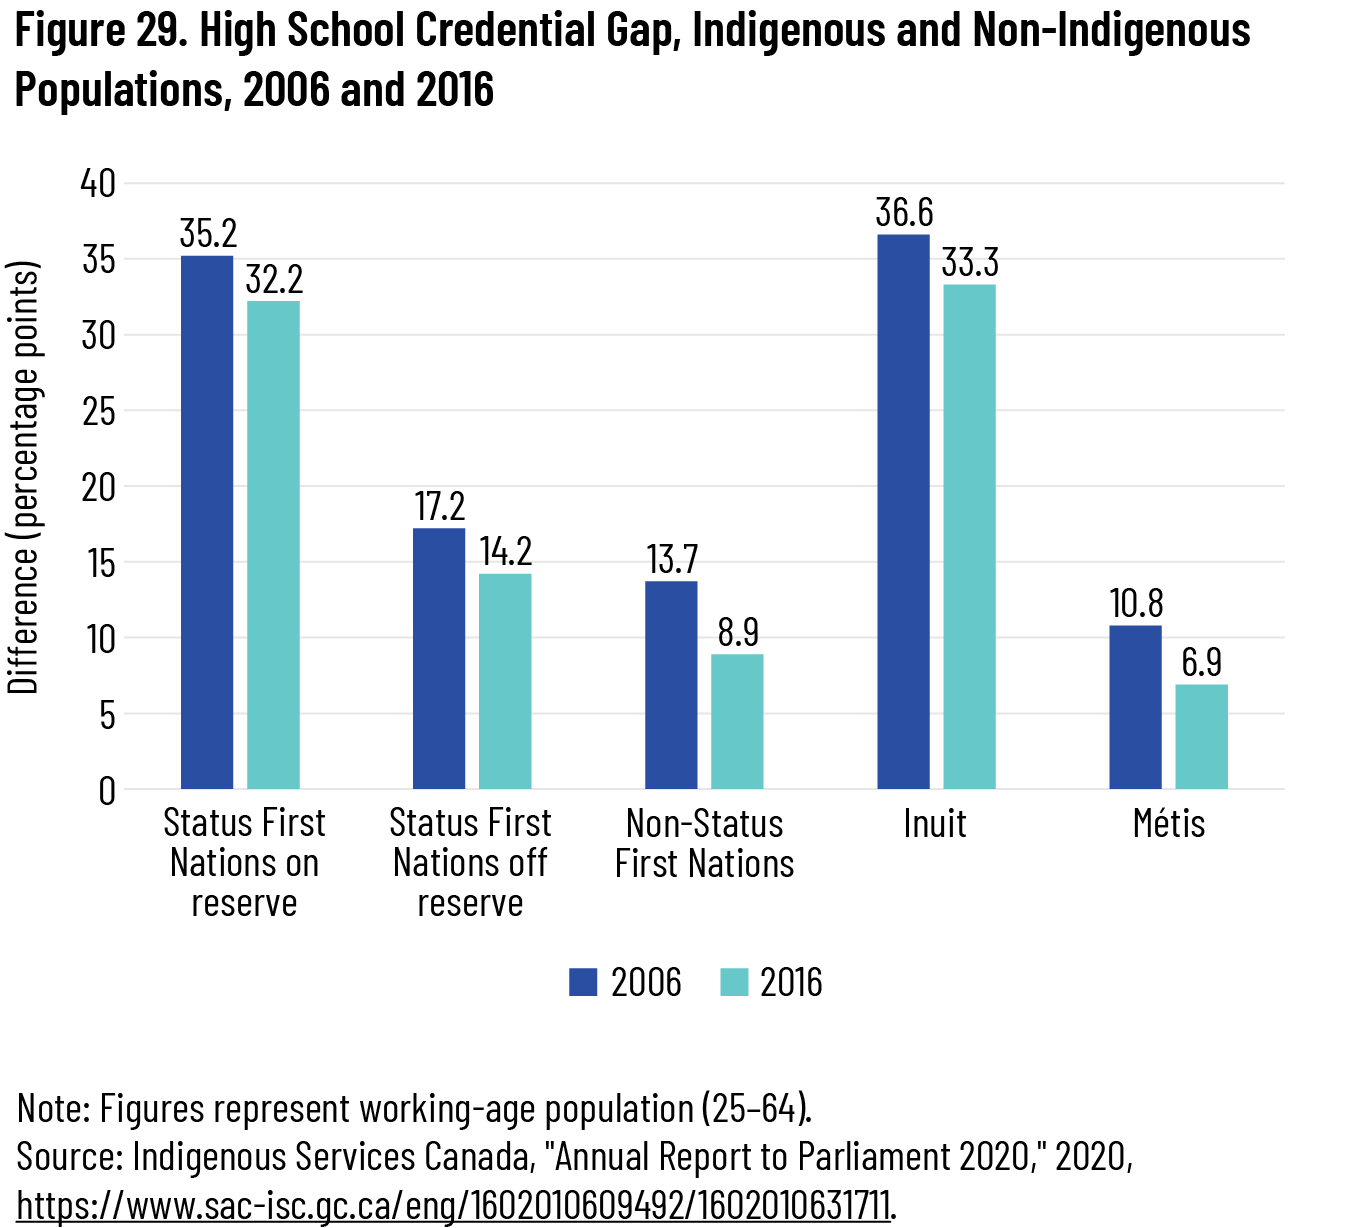
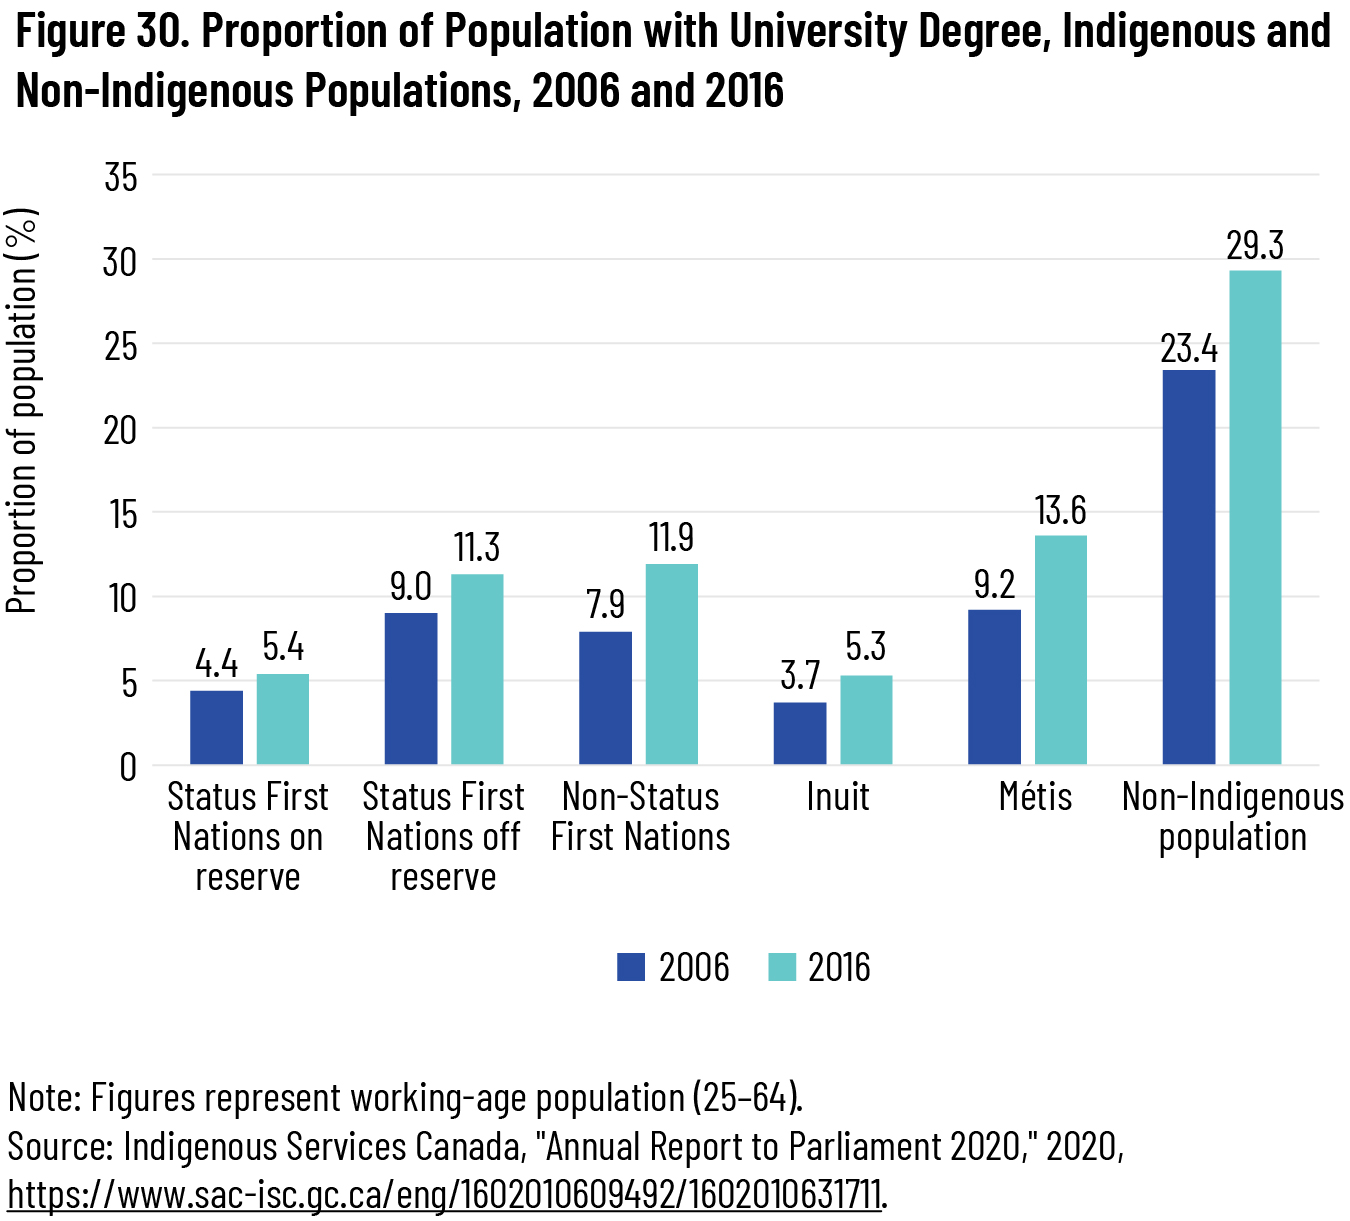
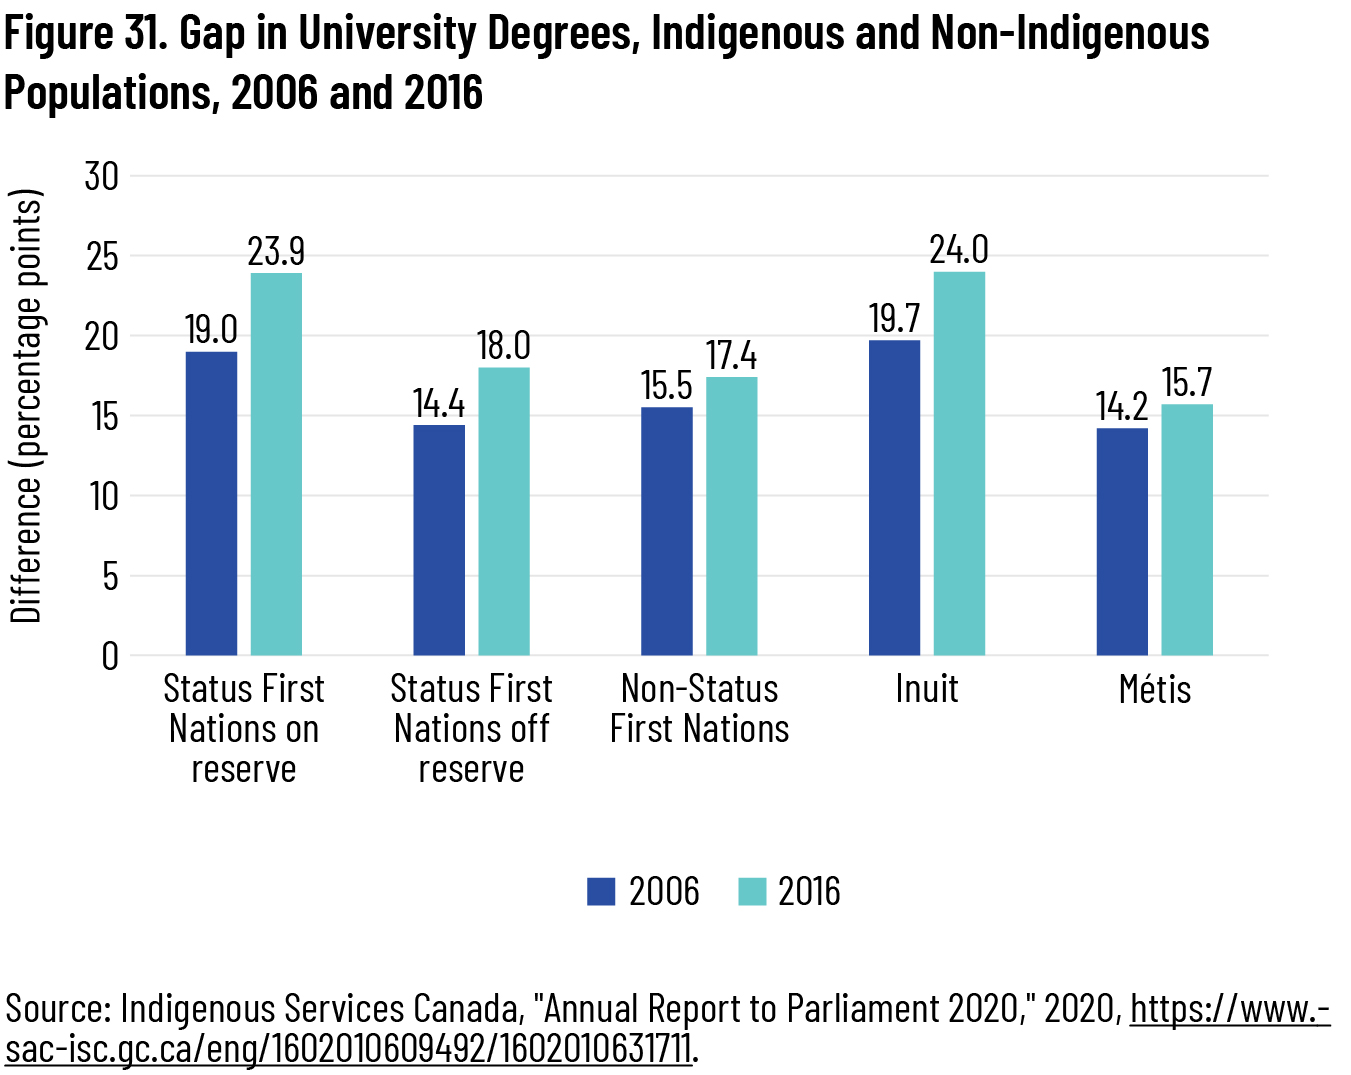
Indigenous high school completion rates improved more quickly than for non-Indigenous people between 2006 and 2016, narrowing the high school graduation gap for all Indigenous groups. However, the opposite was true for university degrees: although the proportion of Indigenous people completing a bachelor’s degree or higher also increased for all groups during this period, it did not keep up with the non-Indigenous population, and the gap widened (see figures 28 through 31).
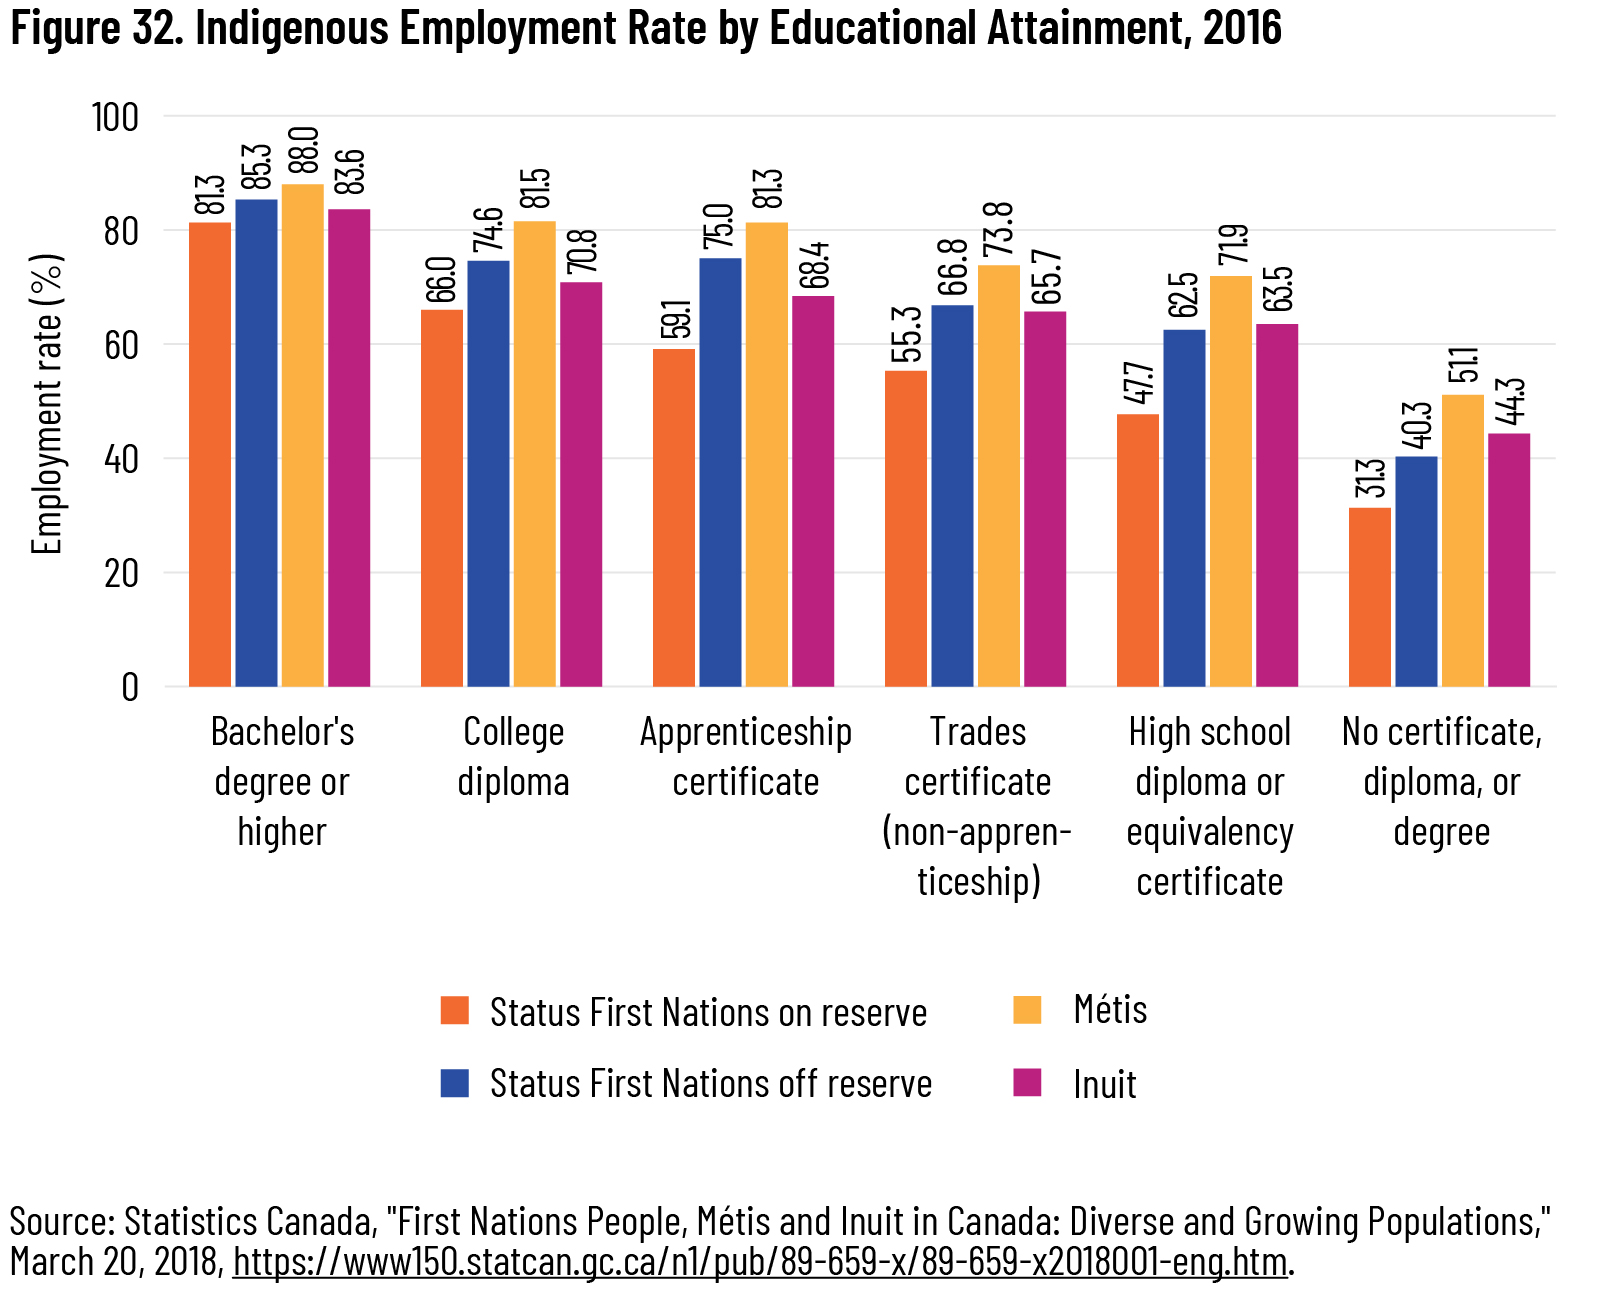
Employment rates are higher for those with higher levels of educational attainment. Across all Indigenous groups, more than 80 percent of those with a bachelor’s degree or higher were employed in 2016, and employment rates were nearly as high for Métis with an apprenticeship certificate or college diploma. Meanwhile, only one-third to one-half of Indigenous Canadians without a certificate, degree, or diploma were employed (see figure 32).
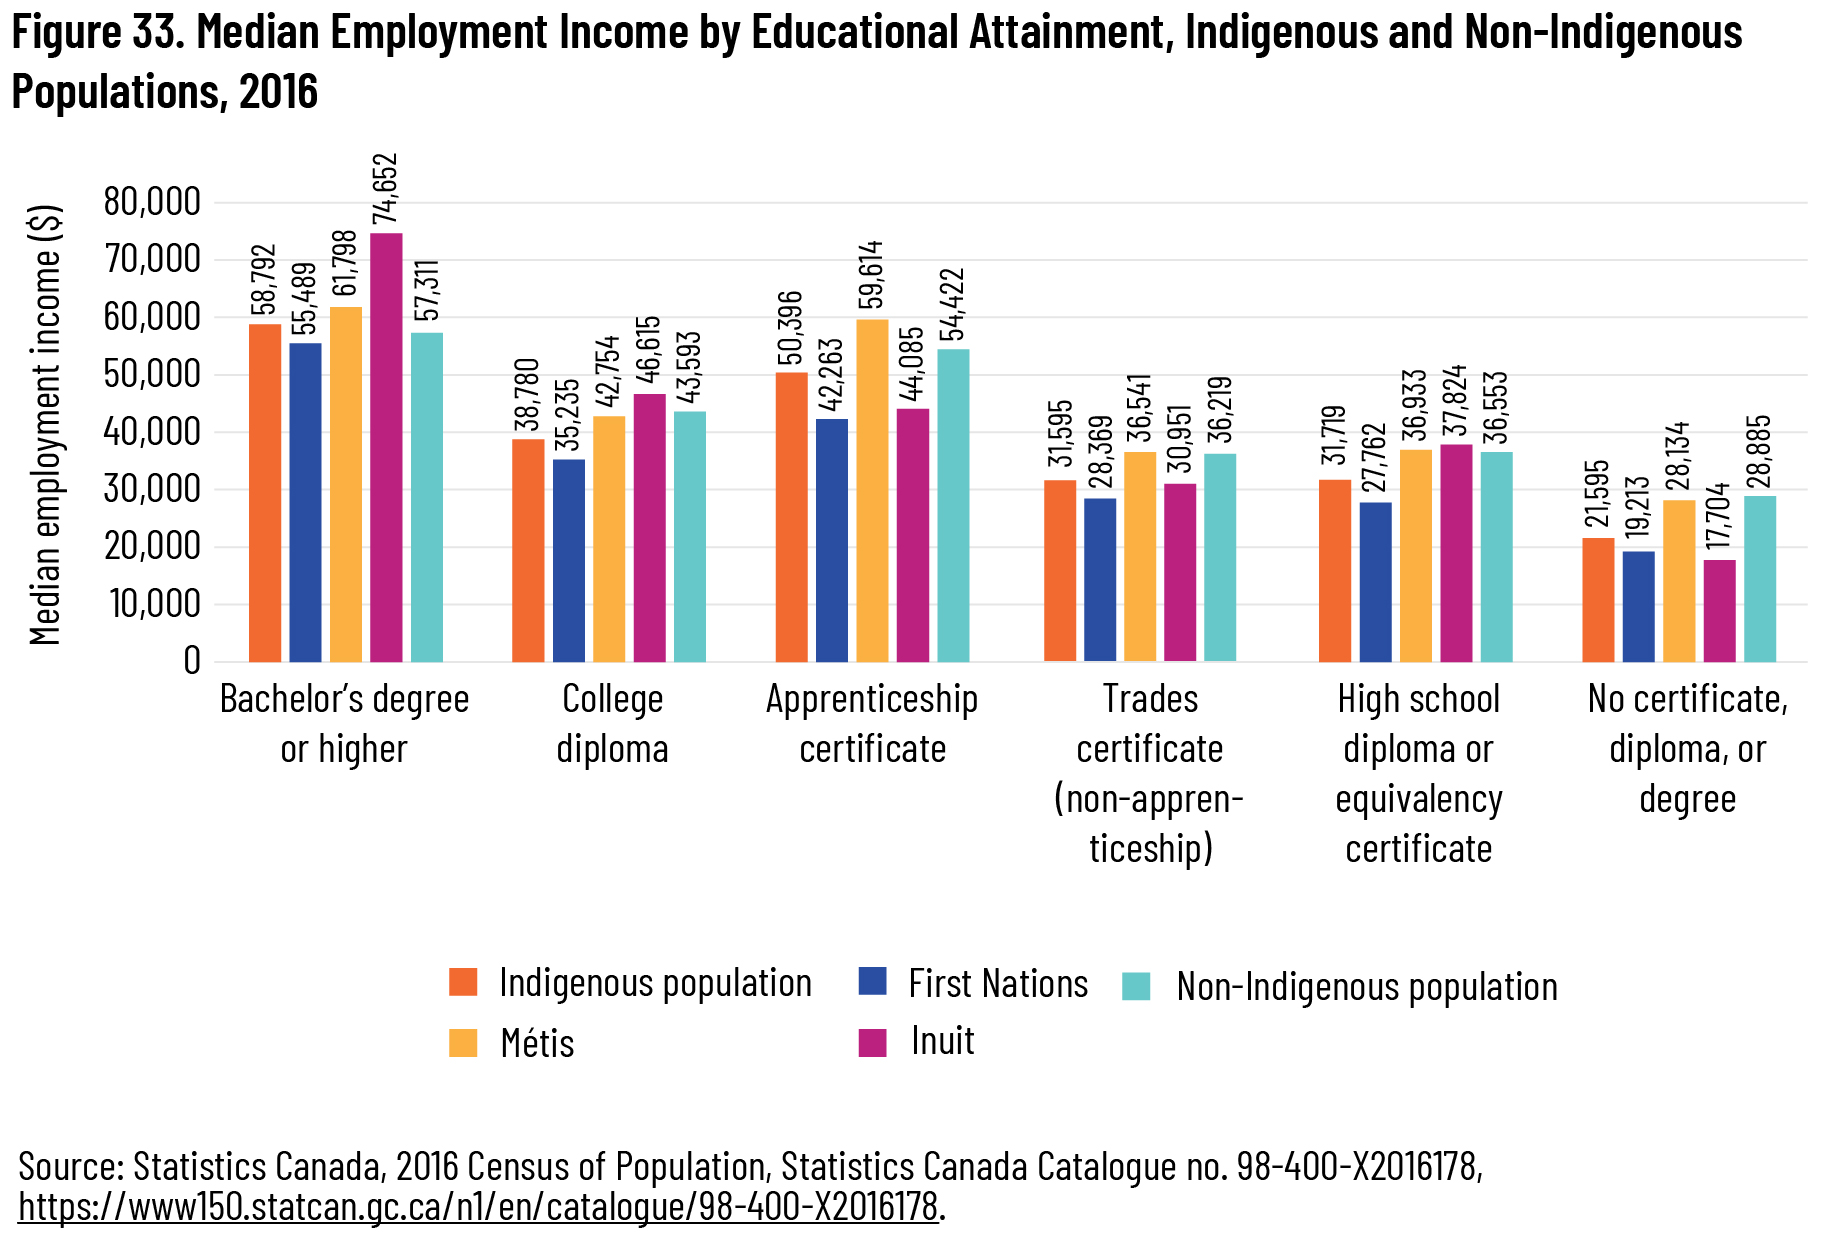
Employment earnings are also higher for Canadians with higher levels of educational attainment. Both Indigenous and non-Indigenous workers without a high school diploma had median annual earnings below $30,000, and for Indigenous workers the figure was closer to $20,000. The Canadian population with a bachelor’s degree or higher, in contrast, earned nearly $60,000. In fact, the median Indigenous person in this group earned slightly more than the median non-Indigenous person ($58,792 compared to $57,311). Interestingly, median employment earnings for all groups except Inuit were higher for those with an apprenticeship certificate than those with a college diploma. For non-Indigenous Canadians and for Métis, workers with an apprenticeship certificate made nearly as much as those with a bachelor’s degree or higher. This suggests that opportunities exist for Indigenous people in many different career pathways (see figure 33).
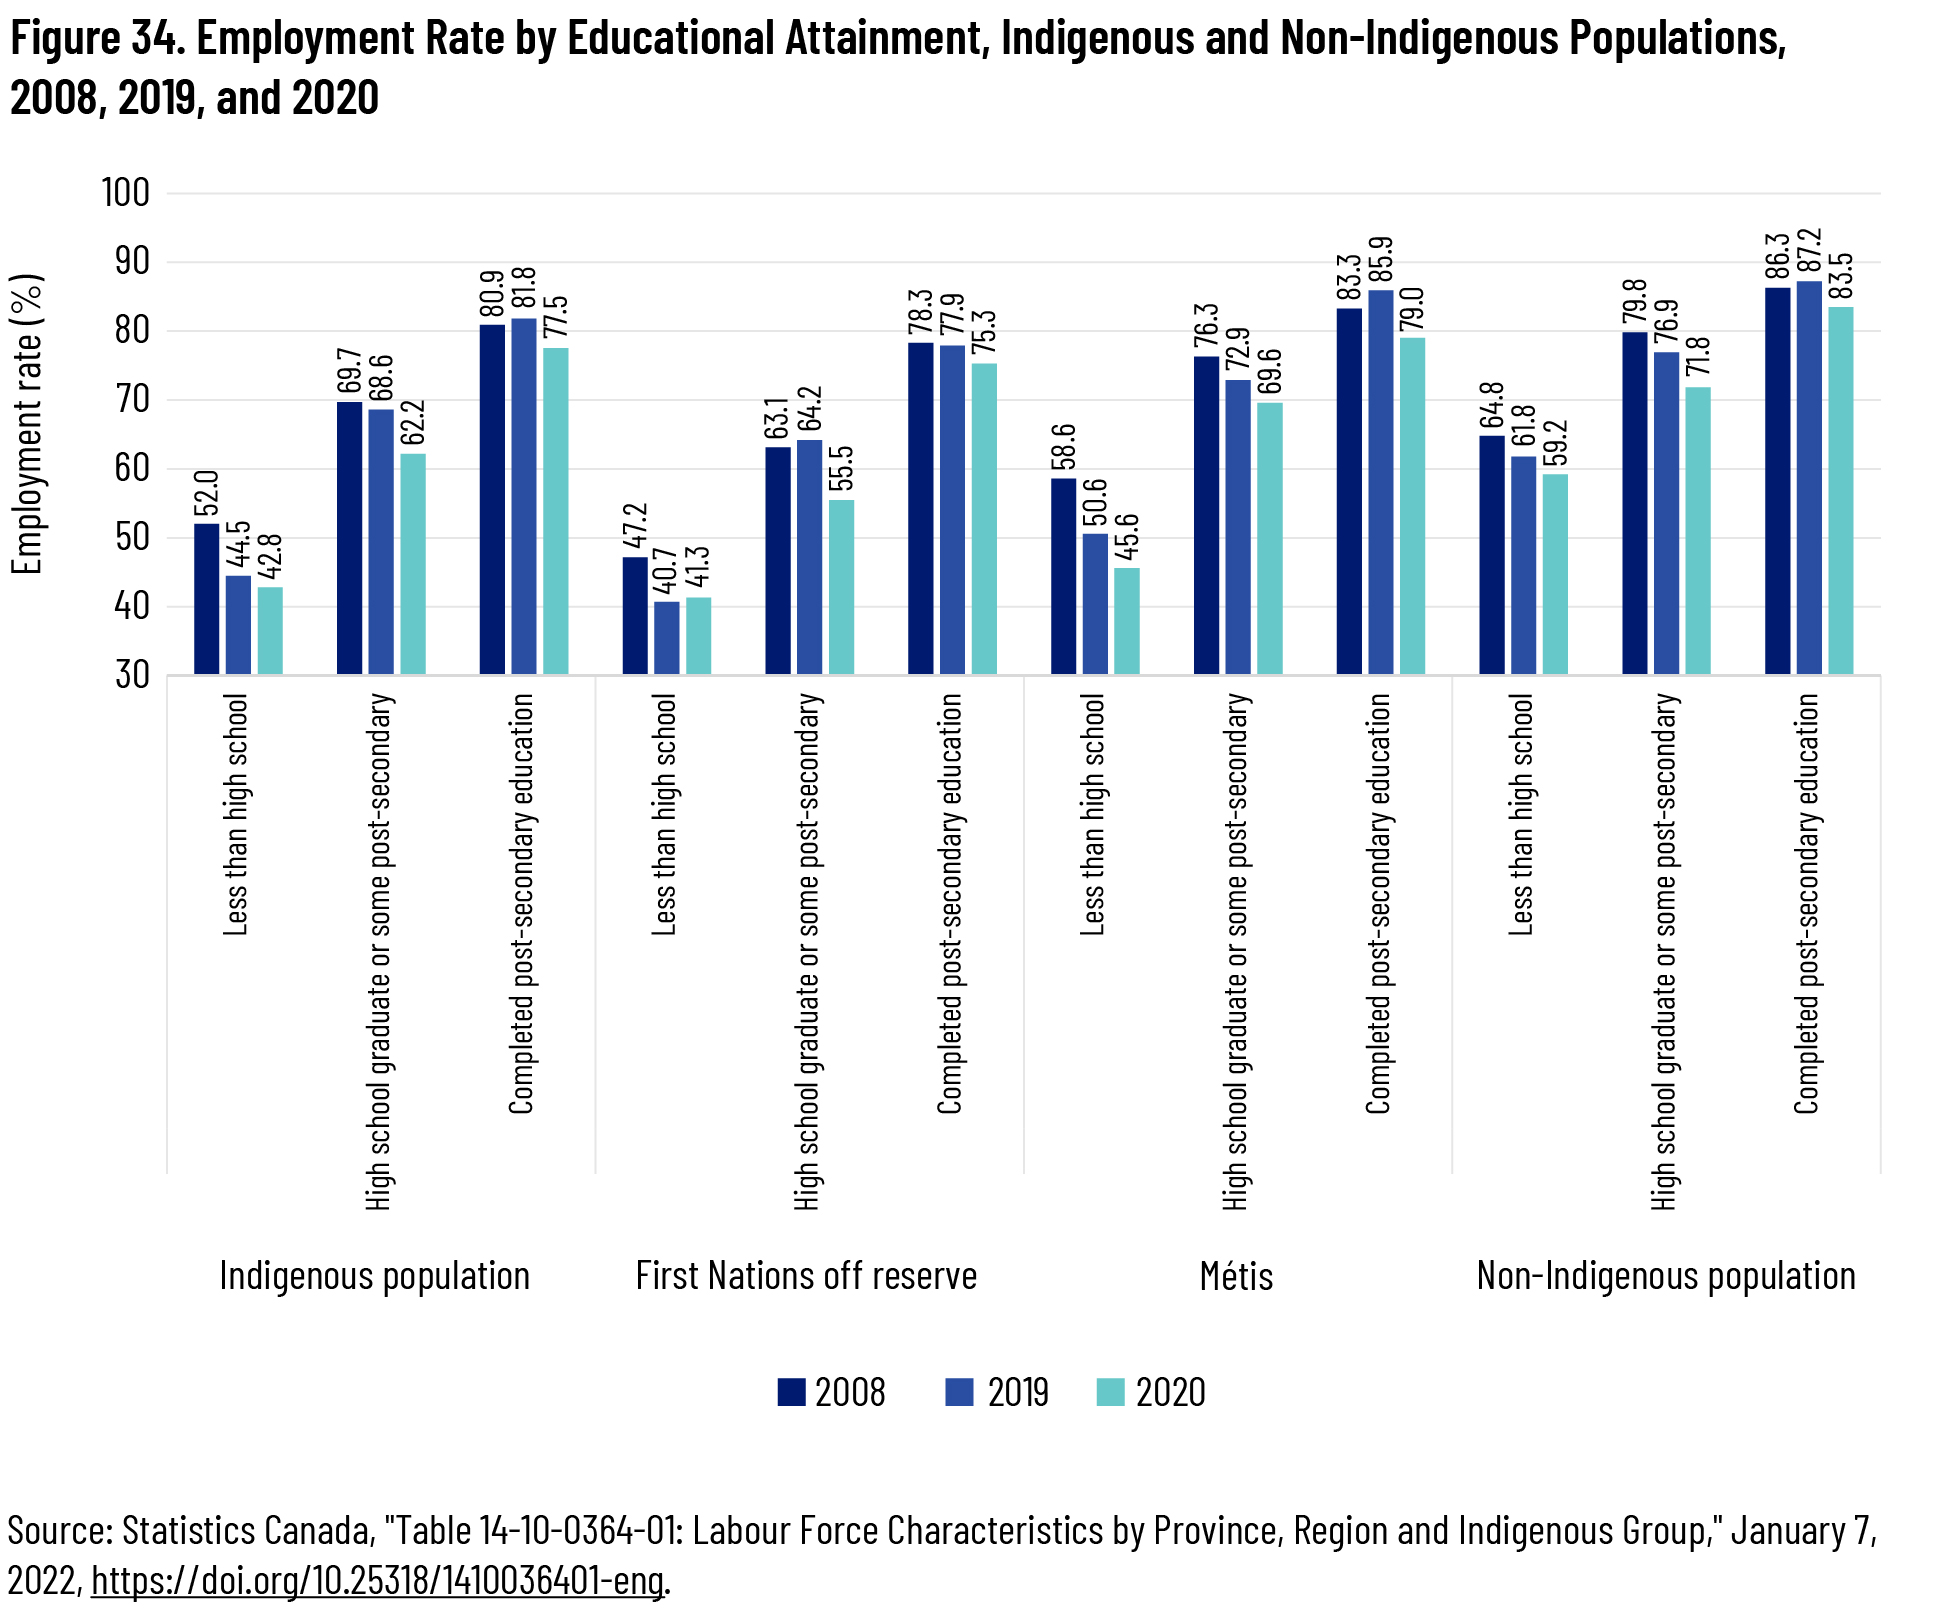
Yet for reasons that remain unclear, rising education levels have not always led to higher employment rates. Between 2008 and 2019, the employment rate decreased on a net basis for Indigenous people who had not completed post-secondary education, but increased for those who had completed it. This was similar to the non-Indigenous population. Métis people’s experience followed a similar trend to the overall trend. On the other hand, the employment rate decreased for the First Nations people living off reserve who had completed post-secondary education, but decreased for those who had a high school or some post-secondary education. With one exception, the employment rates for 2020 are, unsurprisingly, down across the board. The one exception is First Nations living off reserve with less than a high school education, for whom the employment the employment rate increased in 2020 over 2019, albeit only by 0.6 percentage points (see figure 34).
As the Truth and Reconciliation Commission Calls to Action suggest, closing the employment gap will also involve closing the education gap. Slowly but steadily, educational disparities between Indigenous and non-Indigenous Canadians have been decreasing—an encouraging development. Nevertheless, the past decade’s experience implies that educational gains may be a necessary but insufficient condition for employment equality.

Conclusion
Although there have been important steps toward reconciliation with Indigenous communities since the 2008 apology, the data examined in this paper indicate that there is still a long way to go on the economic front. Labour-market disparities between Indigenous and non-Indigenous Canadians persist. Improvements to Indigenous employment outcomes have been modest at best and are not shared equally across the country. Across a variety of measures, employment, income, and education gaps are smaller for Métis and larger for First Nations. One promising improvement has been Indigenous people’s education gains over the past decade, since higher levels of educational attainment are linked to higher employment rates and employment earnings. Apprenticeship in particular stands out as an important career pathway, offering employment rates and earnings close to those of university degrees.
Yet the data examined in this paper raise more questions than provide answers. Why have substantial improvements in Indigenous education not always translated into substantial employment gains? What accounts for the variation in Indigenous employment rates and labour-market trends across the provinces? Are these provincial differences driven primarily by policy, for example? Could there be an industry connection—for example, might the widening of the Indigenous employment gap since 2008 in Manitoba and Alberta be linked to reduced economic activity in the resource sector? More narrowly, why did Indigenous communities in different provinces have different employment experiences during the pandemic? What will be the long-term impact of the COVID-19 pandemic on the Indigenous labour force? Finding answers to these key questions will be an important step toward eliminating the long-standing disparities that the government of Canada recognized in its apology to Indigenous people.
However, it would be a mistake to delay action on economic reconciliation until all questions are answered. If there is one key takeaway from this paper, it is that there ought to be an increased focus on the economic aspects of reconciliation with Indigenous peoples. This must become a priority for governments, employers, and other members of civil society. We hope that highlighting these disparities will lead to further dialogue with Indigenous communities on ways to make genuine economic reconciliation a reality.
References
Dijkema, B., and M. Gunderson. “Work Is About More than Money.” Cardus, 2019. https://www.cardus.ca/research/work-economics/reports/work-is-about-more-than-money/.
Government of Canada. “Delivering on Truth and Reconciliation Commission Calls to Action: Education.” Crown-Indigenous Relations and Northern Affairs Canada. https://www.rcaanc-cirnac.gc.ca/eng/1524495412051/1557511602225.
———. “Implementing the United Nations Declaration on the Rights of Indigenous Peoples Act.” Department of Justice. https://www.justice.gc.ca/eng/declaration/index.html.
Indigenous Services Canada. “Annual Report to Parliament 2020.” 2020. https://www.sac-isc.gc.ca/eng/1602010609492/1602010631711.
National Indigenous Economic Development Board. “Indigenous Economic Progress Report 2019.” June 2019. http://www.naedb-cndea.com/wp-content/uploads/2019/06/NIEDB-2019-Indigenous-Economic-Progress-Report.pdf.
Prime Minister of Canada. “Statement by Prime Minister on Release of the Final Report of the Truth and Reconciliation Commission.” December 15, 2015. https://pm.gc.ca/en/news/statements/2015/12/15/statement-prime-minister-release-final-report-truth-and-reconciliation.
Statistics Canada. “Aboriginal Population Profile, 2016 Census.” Statistics Canada Catalogue no. 98-510-X2016001, July 18, 2018. http://www12.statcan.gc.ca/census-recensement/2016/dp-pd/abpopprof/index.cfm.
———. “First Nations People, Métis and Inuit in Canada: Diverse and Growing Populations.” March 20, 2018. https://www150.statcan.gc.ca/n1/pub/89-659-x/89-659-x2018001-eng.htm.
———. “Table 14-10-0359-01: Labour Force Characteristics by Indigenous Group and Educational Attainment.” January 7, 2022. https://doi.org/10.25318/1410035901-eng.
———. “Table 14-10-0364-01: Labour Force Characteristics by Province, Region and Indigenous Group.” January 7, 2022. https://doi.org/10.25318/1410036401-eng.
———. “Table 14-10-0367-01: Employment by Geography, Indigenous Group and Industry (x 1,000).” January 7, 2022. https://doi.org/10.25318/1410036701-eng.
———. “Table 14-10-0370-01: Average Hourly and Weekly Wages and Average Usual Weekly Hours by Indigenous Group.” January 7, 2022. https://doi.org/10.25318/1410037001-eng.
———. “Table 37-10-0099-01: Distribution of the Population Aged 25 to 64 (Total and with Aboriginal Identity), by Highest Certificate, Diploma or Degree and Age Group.” https://www150.statcan.gc.ca/t1/tbl1/en/tv.action?pid=3710009901.
———. 2016 Census of Population, Statistics Canada Catalogue Number 98-400-X2016174. https://www12.statcan.gc.ca/census-recensement/2016/dp-pd/dt-td/Rp-eng.cfm?LANG=E&APATH=3&DETAIL=0&DIM=0&FL=A&FREE=0&GC=0&GID=0&GK=0&GRP=1&PID=111814&PRID=10&PTYPE=109445&S=0&SHOWALL=0&SUB=0&Temporal=2017&THEME=122&VID=0&VNAMEE=&VNAMEF=
Canada. “Truth and Reconciliation Commission of Canada: Calls to Action.” 2015. https://ehprnh2mwo3.exactdn.com/wp-content/uploads/2021/01/Calls_to_Action_English2.pdf.
United Nations. “United Nations Declaration on the Rights of Indigenous Peoples.” Resolution 61/295 (2007). https://undocs.org/A/RES/61/295.
United States Census Bureau. “Economic Census: NAICS Codes and Understanding Industry Classification Systems.” November 22, 2021. https://www.census.gov/programs-surveys/economic-census/guidance/understanding-naics.html.