Introduction
Canada’s charitable sector will prove to be pivotal in helping Canadians through these challenging times. But the revenues of charitable organizations have been falling. In a survey of Canadian charitable organizations during the COVID-19 pandemic, Lasby (2020) found that 69 percent of charities had experienced decreased revenues and that, on average, the decline in revenue was 30 percent. For Canadian charities to continue carrying out their important missions in helping to provide those in need with food, clothing, shelter, and emotional support, Canadians are going to have to increase their giving.
“The combination of relative financial stability and lower spending for some Canadians presents an opportunity for those who can to increase their charitable giving.”
There is no doubt that the pandemic has exacted a considerable economic and emotional toll on countless Canadians. As governments have sought to control the spread of the virus through the shuttering of numerous businesses and events, many Canadians have lost their jobs and some businesses have had to permanently close. However, the economic impact of the pandemic has been spread among Canadians unevenly, and there is still potential for many to give to the charitable organizations that are actively working to help Canadians in need during this time. Indeed, some Canadians have been able to successfully transition to working from home without an impact to their incomes, while their discretionary spending in several areas has fallen, freeing up the potential to increase their charitable giving. For those who can, increasing their contributions to charitable organizations could go a long way in helping their fellow Canadians through the hardships that the pandemic has wrought.
This study seeks to assess the potential of many Canadians to increase their charitable giving to help support civil-society organizations in their responses to the pandemic.
The Economic Impact of the Pandemic
The economic impact of the pandemic has been stark. Statistics Canada (2020a; 2020b) has reported that Canada’s GDP fell by 9 percent and the countrywide unemployment rate reached 13 percent in April. By way of comparison, Canada’s GDP fell by a total of only 3 percent across the course of the 2008–09 financial crisis, and the unemployment rate reached only 8.7 percent (CBC News 2010; Statistics Canada 2020b). Moreover, during the 2008–09 financial crisis, employment in Canada’s goods- and services-producing sectors fell by almost 420,000 jobs. In contrast, employment in these same sectors has fallen by over 3 million between February and April 2020 (Statistics Canada 2020c). In this sense, the economic impact of the COVID-19 pandemic is unprecedented for almost all Canadians.
However, the pandemic’s economic impact has not been evenly spread. A disproportionate share of the economic burden has fallen on younger and on lower-income Canadians. The reality of a disparate economic impact is clear in the data on Canada’s labour market in these exceptional times, recently released by Statistics Canada (2020c).
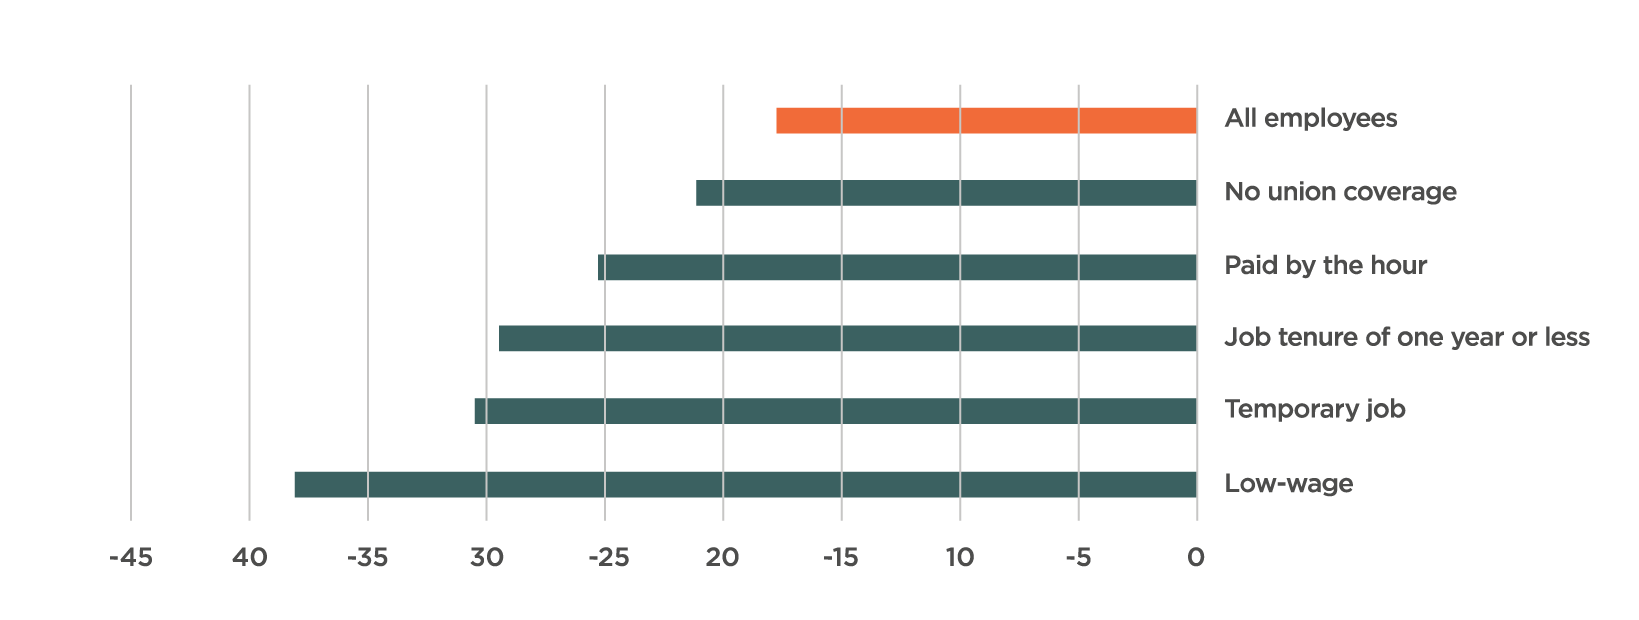
Consider first the disproportionate economic impact of the pandemic by levels of income. Figure 1 displays employment changes between February and April 2020 by various employment characteristics. As can be seen, employment losses have been much greater for those in low-wage work (-38.1 percent change in employment) compared to the whole economy (-17.8 percent change in employment). Those with temporary employment or short job tenure have also been out of work at a greater rate than the labour market as a whole. This finding is not unexpected given the measures that have been taken to restrain the spread of the pandemic. Two of the hardest-hit employment sectors have been 1) accommodation and food services and 2) wholesale and retail trade; these sectors tend to be two of the lowest-paying labour market segments (Statistics Canada 2020c).
Furthermore, the disproportionate economic impact of the pandemic can be seen by examining changes in average wages. From February to April, average wages rose by 7.3 percent. While this would normally seem like positive news, as Statistics Canada (2020c) discusses, most of this increase is largely attributable to declines in employment in lowpaying sectors, having the effect of raising average wages.
Figure 1: Percentage Change in Employment Among Paid Employees by Employment Characteristic, February to April 2020
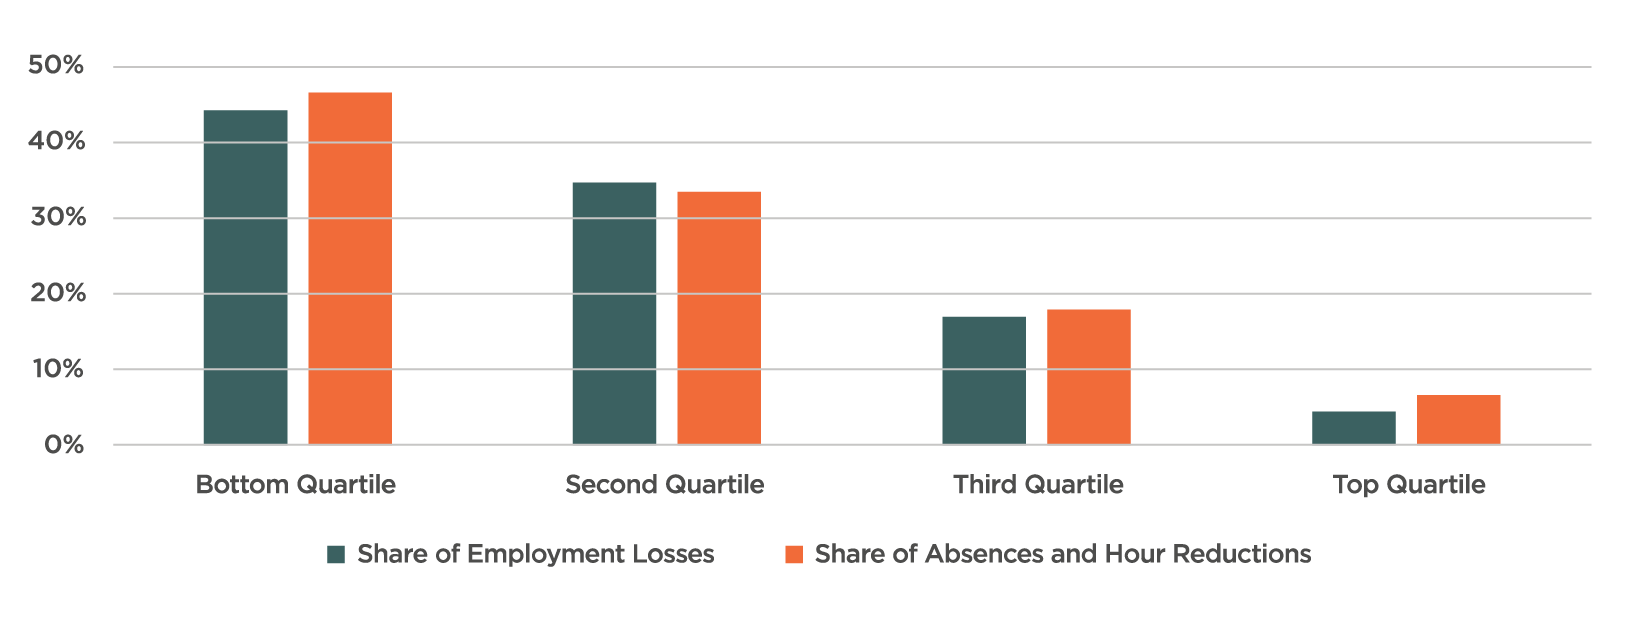
Finally, a recent analysis by Lemieux et al. (2020) further demonstrates the disproportionate economic impact of the pandemic between different income groups. The authors calculated both employment losses and those absent from the workplace with substantial reductions in their hours worked by income quartile. 1 1 Quartiles were estimated using weekly earnings from February 2020. Estimates reflect job losses from February to April 2020. All data used in the report were from Statistics Canada’s recent Labour Force Survey estimates. The results are telling and confirm that most of the economic impact of the COVID-19 pandemic in terms of lost jobs and wages has fallen on lower-income Canadians. Indeed, nearly 80 percent of all job losses were in the bottom two weekly-earnings quartiles. Only a little over four percent of all job losses were in the top quartile. The Lemieux et al. (2020) analysis also found that nearly half of workers who are still employed but absent from work and with a substantial reduction in hours were in the bottom earnings quartile. Again, 80 percent of workers experiencing this situation were found in the bottom two quartiles, while the top earnings quartile was much less affected.
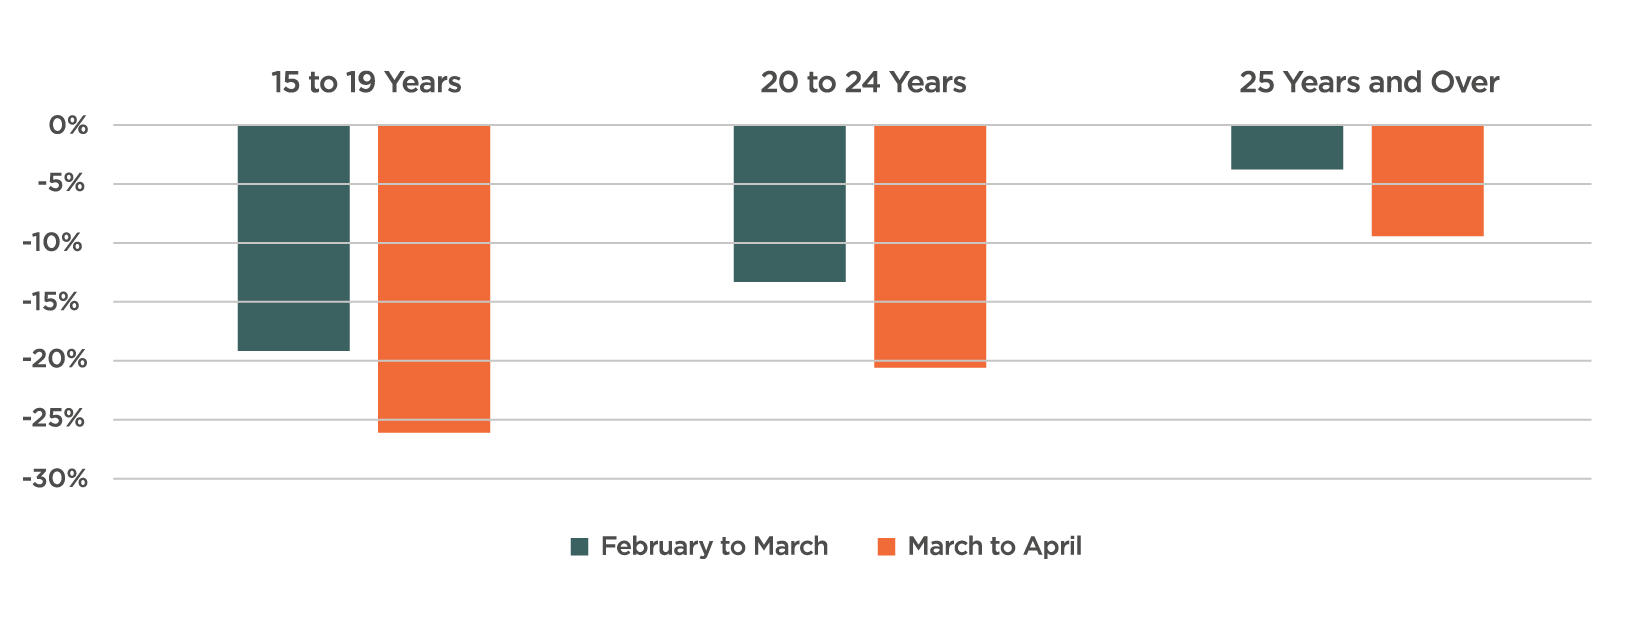
Next, consider the disparity in the pandemic’s economic impact by age group (Figure 3). Here, employment reductions have been much greater for younger workers than for older ones. In total between February and April, employment of those aged 15 to 19 declined by 40.4 percent, and employment for those aged 20 to 24 declined by 31.1 percent. This compares to an employment decline of 12.8 percent for Canadians aged 25 and older.
In addition, Statistics Canada (2020c) found that a quarter of those aged 15 to 24 who remained employed in April lost the majority, if not all, of their usual hours worked. The disproportionate impact on Canada’s younger workers comes from the fact that this group is more likely to hold employment in the harder-hit industries of accommodation and food services or wholesale and retail trade.
Overall, what the above shows is that the economic costs of the pandemic have been disproportionally borne by younger and less-well-off Canadians. On the other hand, it also reveals that many older and higher-income Canadians have experienced a lower economic impact compared to others, owing to the fact that they are still working. Thus, they are the group that has the greatest potential to give to the Canadian charities that are desperately in need. 2 2 This group may be predisposed to donate to charity. Indeed, the majority of Canadian charitable donations already come from older and wealthier Canadians. In 2018 for example, 52 percent of Canadians donors were aged 55 and over, and 62 percent of donations came from those earning $80,000 per year or more (Statistics Canada 2020e; 2020f).
The Potential to Increase Charitable Giving
The economic impact of the pandemic has disproportionately fallen on the younger and lower-income Canadians, leaving many others comparatively spared. At the same time, expenditures are falling, and many Canadians are finding that they are saving money (Buckner 2020). Spending on transportation, dining out, and retail have all fallen, as businesses shuttered and many Canadians are no longer commuting to work. Data from RBC regarding changes in credit-card usage suggests that in the heart of the national lockdown between March 24 and April 21, consumer spending was down an average of 26 percent compared to pre-COVID spending levels (Guldimann 2020).
The combination of relative financial stability and lower spending for some Canadians presents an opportunity for those who can to increase their charitable giving. These increased donations could go a long way to helping to stabilize Canadian charities that continue to provide essential support for those in need while also facing the pressure of lower revenues.
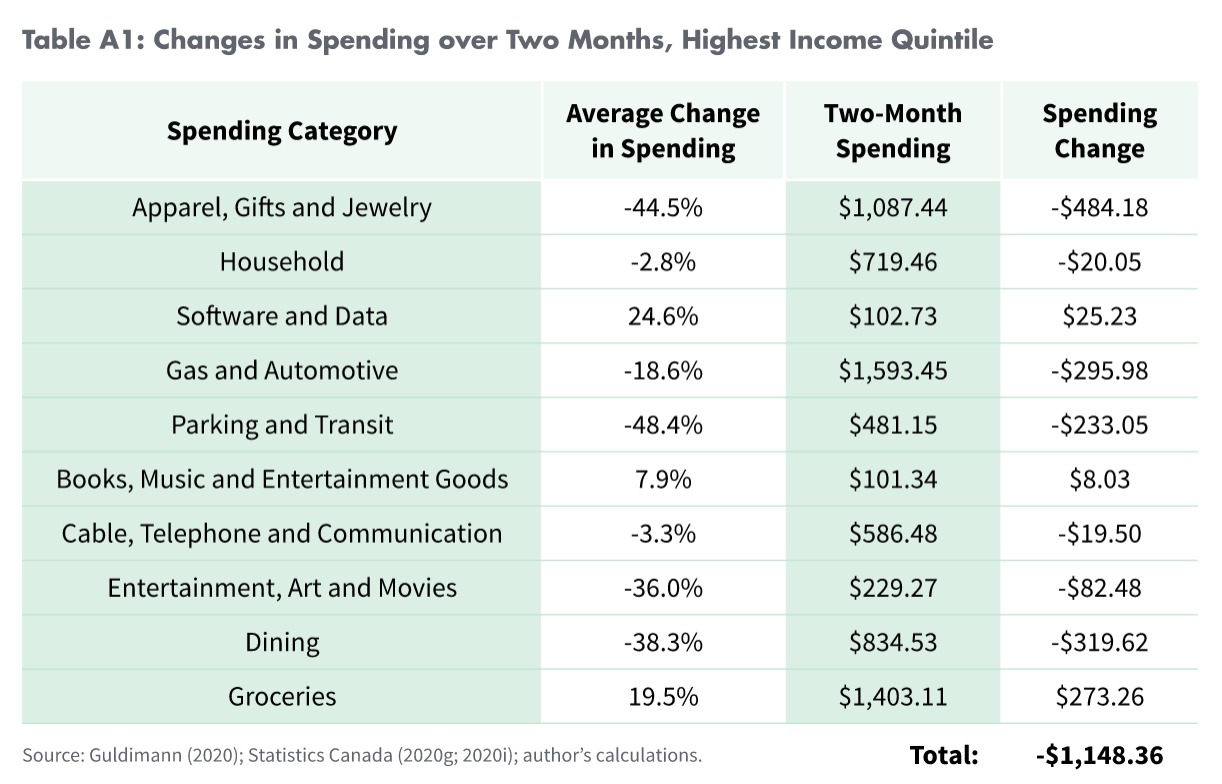
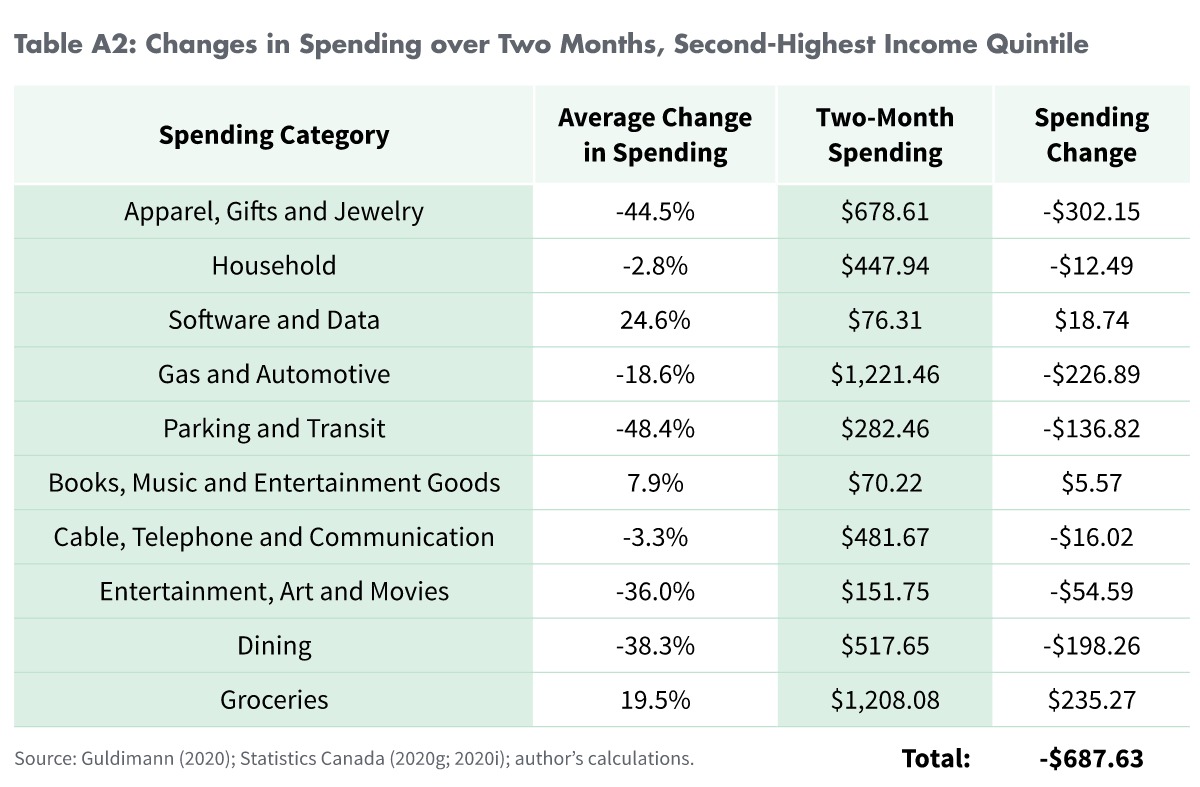
However, the call to increase charitable giving from those who can also raises the question of how much these Canadians have been saving during the pandemic. We have produced estimates below that provide insight into this question. We have applied data from RBC, on how consumer spending has declined across certain areas, to the spending estimates from Statistics Canada’s Survey of Household Spending (SHS), which collects detailed information on household expenditures. The analysis is conducted on the highest and second-highest before-tax income quintiles, since these Canadians will have the highest potential to increase their giving. The analysis also reflects savings across two months of spending in order to approximate the savings during the period in which disruption to consumption has been the greatest. The latest available data in the SHS is 2017, and this will serve as the basis for the analysis. 3 3 The 2017 spending data was adjusted for inflation into 2019 dollars using Statistics Canada’s Consumer Price Index
To begin, Figure 4 displays the average change in consumer spending between March 3 and April 21 compared to pre-COVID levels, based on RBC data from changes in credit-card usage (Guldimann 2020). It is important to note that spending has not declined in every area. Notably, spending on software and data and on groceries have each increased by an average of 20 percent across this period. As expected, there have been large declines in spending on travel, parking and transit, purchases of apparel and accessories, and dining out. The costing of net savings includes both the increases and decreases in spending to present as realistic an analysis as possible.
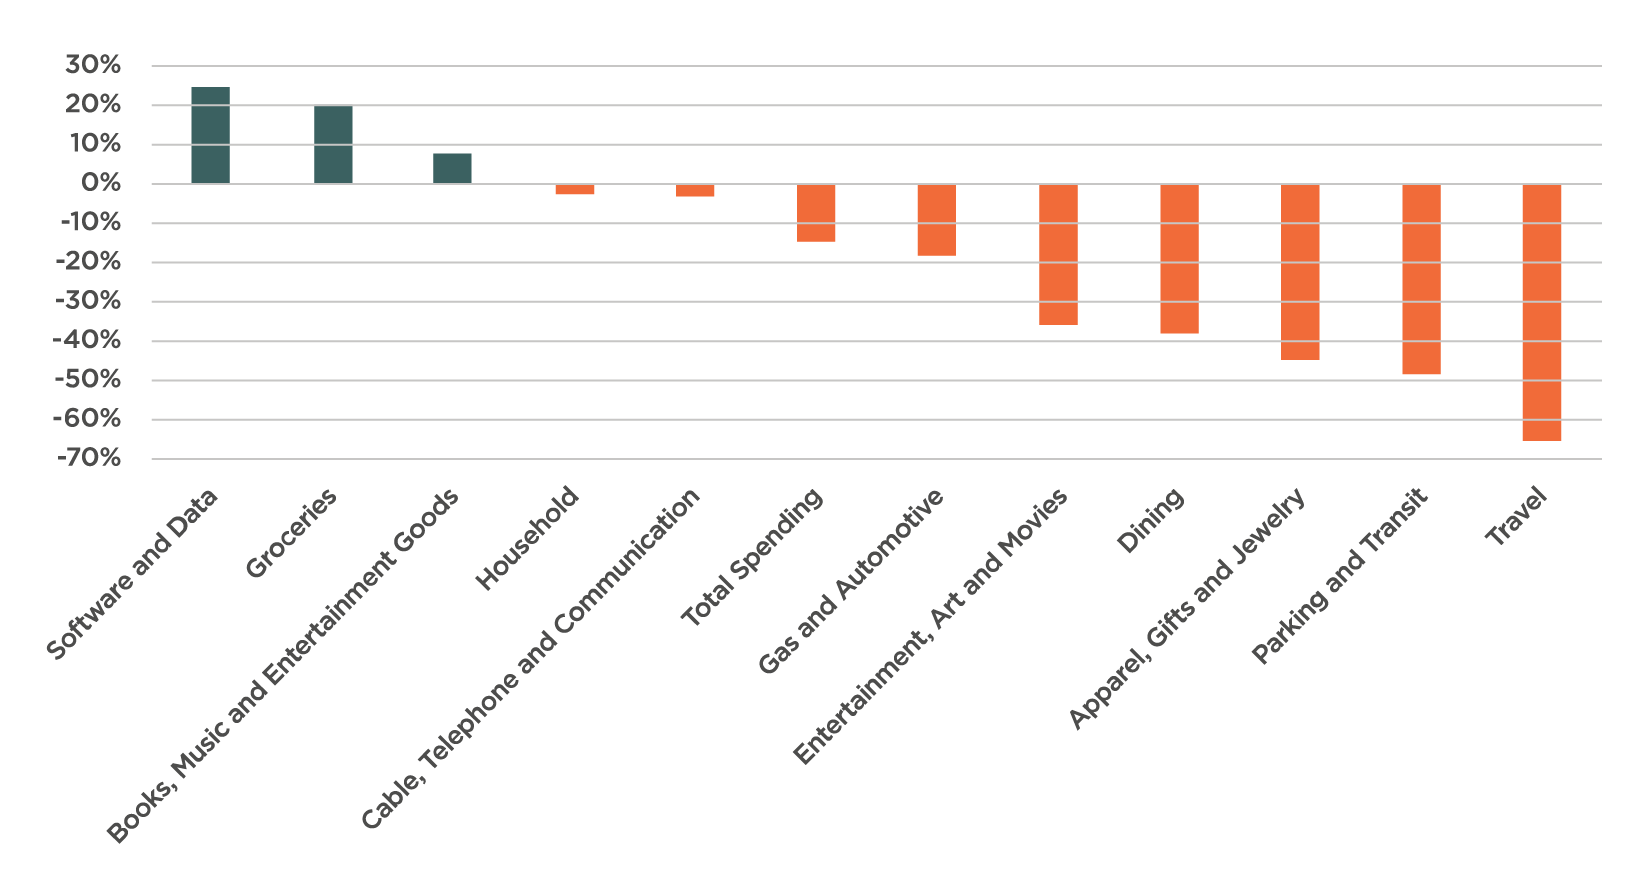
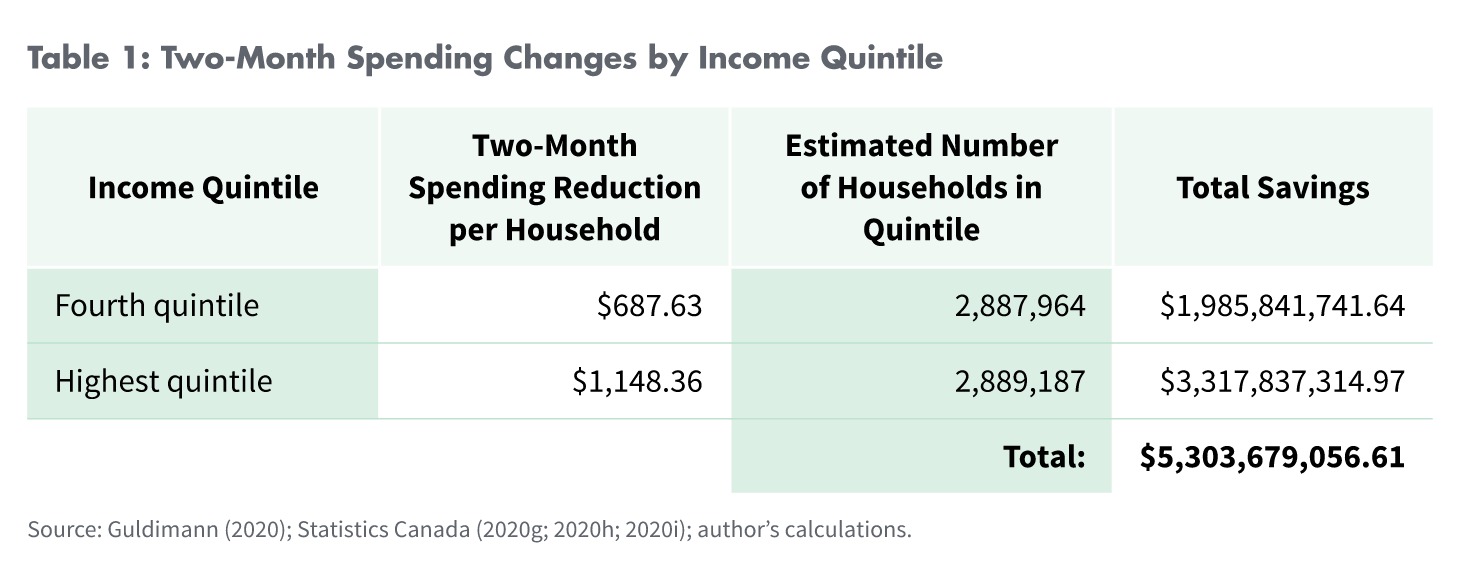
Table 1 displays the results of the analysis. 4 4 Detailed analyses of the changes in consumer spending for each of the two top income quintiles can be seen in the appendix. Based on comparing changes in consumer spending from RBC to data from the Survey of Household Spending, households in the highest income quintile have, on average, net-saved almost $1,150 through two months of the pandemic, while households in the second-highest income quintile have saved nearly $700. This should be considered a lower-end estimate, as the RBC’s data for the travel category (-65 percent decline in spending) was not included in the analysis due to the lack of a clear comparator in the SHS data. All told, when these savings are aggregated across the number of households in each income quintile, the total savings over two months for Canada’s highestearning households is over $5.3 billion. If even part of this total were donated to Canadian charitable organizations, it could go a long way to helping those in need.
It should also be recognized that while some households have been experiencing savings from lower levels of consumption, these savings may have been directed to help family or friends in need. In light of this reality, this analysis is not intended to suggest that everyone in the highest two household-income quintiles have been experiencing net savings, or that these savings must be donated to charity. Rather, it provides evidence of the potential scale of some of the savings that may have occurred, and therefore the potential to give.
Conclusion
As the economic costs of the pandemic continue to mount, Canadian civil-society organizations will be necessary to help those in need. As these organizations experience revenue declines, such assistance many prove tougher to provide. The economic toll of the pandemic has been disproportionally borne by younger and lower-income Canadians. At the same time, expenses on commuting, dining out, and other forms of consumption have fallen. This leaves many with the potential to give. For some, this will mean helping family or friends navigate the economic and emotional hardships. But for others, consideration should be given to donating to Canadian charities in need. Organizations that serve the common good form an essential part of Canadian society, especially in times such as these. Ordinary Canadians will play an important role in strengthening and sustaining the necessary work of these charitable organizations.
References
Buckner, D. 2020. “‘I’m Spending Way Less’: How the Lockdown Is Leading to More Savings for Some Canadians.” CBC News (April 22). https://www.cbc.ca/news/business/covid-19-spendingconsumers-savings-1.5539911
CBC News. 2020. “Canada Escaped Worst of Recession: StatsCan.” CBC News (April 15). https://www.cbc.ca/news/business/canada-escaped-worst-of-recession-statscan-1.935579
Guldimann, C.. 2020. “COVID Consumer Spending Tracker.” RBC Economics (2020). https://thoughtleadership.rbc.com/covid-consumer-spending-tracker/
Lasby, D. 2020. Sector Monitor: Charities & the COVID-19 Pandemic. Toronto: Imagine Canada. https://imaginecanada.ca/sites/default/files/COVID19%20Sector%20Monitor%20Report%20ENGLISH.pdf
Lemieux, T., K. Milligan, T. Schirle, and M. Skuterud. 2020. Initial Impacts of the COVID-19 Pandemic on the Canadian Labour Market. Waterloo: Canadian Labour Economics Forum. https://clef.uwaterloo.ca/wp-content/uploads/2020/06/CLEF-26_2020-Spring-Summer-Lemieux-et-al.pdf
Statistics Canada. 2020a. Gross Domestic Product by Industry: Nowcast, March 2020. Ottawa. https://www150.statcan.gc.ca/n1/daily-quotidien/200415/dq200415a-eng.htm
Statistics Canada. 2020b. Table 14-10-0287-03: Labour Force Characteristics by Province, Monthly, Seasonally Adjusted. Ottawa. https://www150.statcan.gc.ca/t1/tbl1/en/tv.action?pid=1410028703
Statistics Canada. 2020c. Labour Force Survey, April 2020. Ottawa. https://www150.statcan.gc.ca/n1/daily-quotidien/200508/dq200508a-eng.htm
Statistics Canada. 2020d. Table 14-10-0287-02: Labour Force Characteristics by Age Group, Monthly, Seasonally Adjusted. Ottawa. https://www150.statcan.gc.ca/t1/tbl1/en/cv.action?pid=1410028702
Statistics Canada. 2020e. Table 11-10-0002-01: Tax Filers with Charitable Donations by Sex and Age. Ottawa. https://www150.statcan.gc.ca/t1/tbl1/en/tv.action?pid=1110000201
Statistics Canada. 2020f. Table11-10-0003-01: Tax Filers with Charitable Donations by Income. Ottawa. https://www150.statcan.gc.ca/t1/tbl1/en/tv.action?pid=1110000301
Statistics Canada. 2020g. Table 11-10-0223-01: Household Spending by Income Quintile, Canada, Regions and Provinces. Ottawa. https://www150.statcan.gc.ca/t1/tbl1/en/cv.action?pid=1110022301
Statistics Canada. 2020h. Appendix G: Estimated Number of Households and Average Household Size by Domain, Canada. Ottawa. https://www150.statcan.gc.ca/n1/pub/62f0026m/2018001/app-ann-geng.htm
Statistics Canada. 2020i. Table 18-10-0005-01: Consumer Price Index, Annual Average, Not Seasonally Adjusted. Ottawa. https://www150.statcan.gc.ca/t1/tbl1/en/tv.action?pid=1810000501