
Table of Contents
Table of Contents
Executive Summary
Government-run gambling is ripe for reform. In our previous report, “Pressing Its Luck,” we examined the ways in which the state’s gambling monopoly operates as a tax on the marginalized—preying on the poor and those who are playing hard to join them. We concluded by offering four policy reforms that could help provinces kick their addiction to regressive gambling profits and build a system that works for, not against, low-income households. Here, we provide a more detailed framework for recovery by exploring each policy option in depth. Returning annual gambling profits to the poor through cash transfers is one option. A second is to promote asset building through a matched savings program. Governments can also work with financial institutions to offer prize-linked savings products, an innovative way to help families build emergency savings funds. Finally, given that gambling profits are drawn disproportionately from problem gamblers, we argue that governments should increase funding for problem-gambling research, prevention, and treatment out of provincial gambling corporations’ marketing budgets.
Acknowledgments
The authors would like to thank the following people who served as members of the advisory committee for this work:
Livio Di Matteo – Professor of Economics, Lakehead University
Ben Eisen – Adjunct Instructor in Public Policy, Drexel University
Brian Gilmore – Director, Commonwealth
Courtney Mo – Public Policy, Research & Evaluation Manager, Momentum
Michelle Pommels – CEO, Credit Counselling Canada
Michael Ras – Director, Government and Stakeholder Relations, Meridian Credit Union
Aaron Wudrick – Federal Director, Canadian Taxpayers Federation
We would like to publicly acknowledge their invaluable advice, constructive criticism, and feedback. The paper was strengthened by these contributions, and any fault with the paper should be a reflection on the authors, not on the committee.
Governments have a gambling problem. Across Canada, provinces have become addicted to the cash that state-run gambling provides to their treasuries each year. But a government’s gambling monopoly is more than just a lucrative form of entertainment: it functions as a hidden and regressive tax on the poor and the addicted. If government will continue deriving revenues in this manner, how could this gambling money be put to better use? How might government build a gambling structure that empowers those on the economic margins, rather than preying on them? This paper explores policy options to put this money back in the hands of those whom government-run gambling harms most, and to ensure that the government’s use of these funds is open, transparent, and accountable.
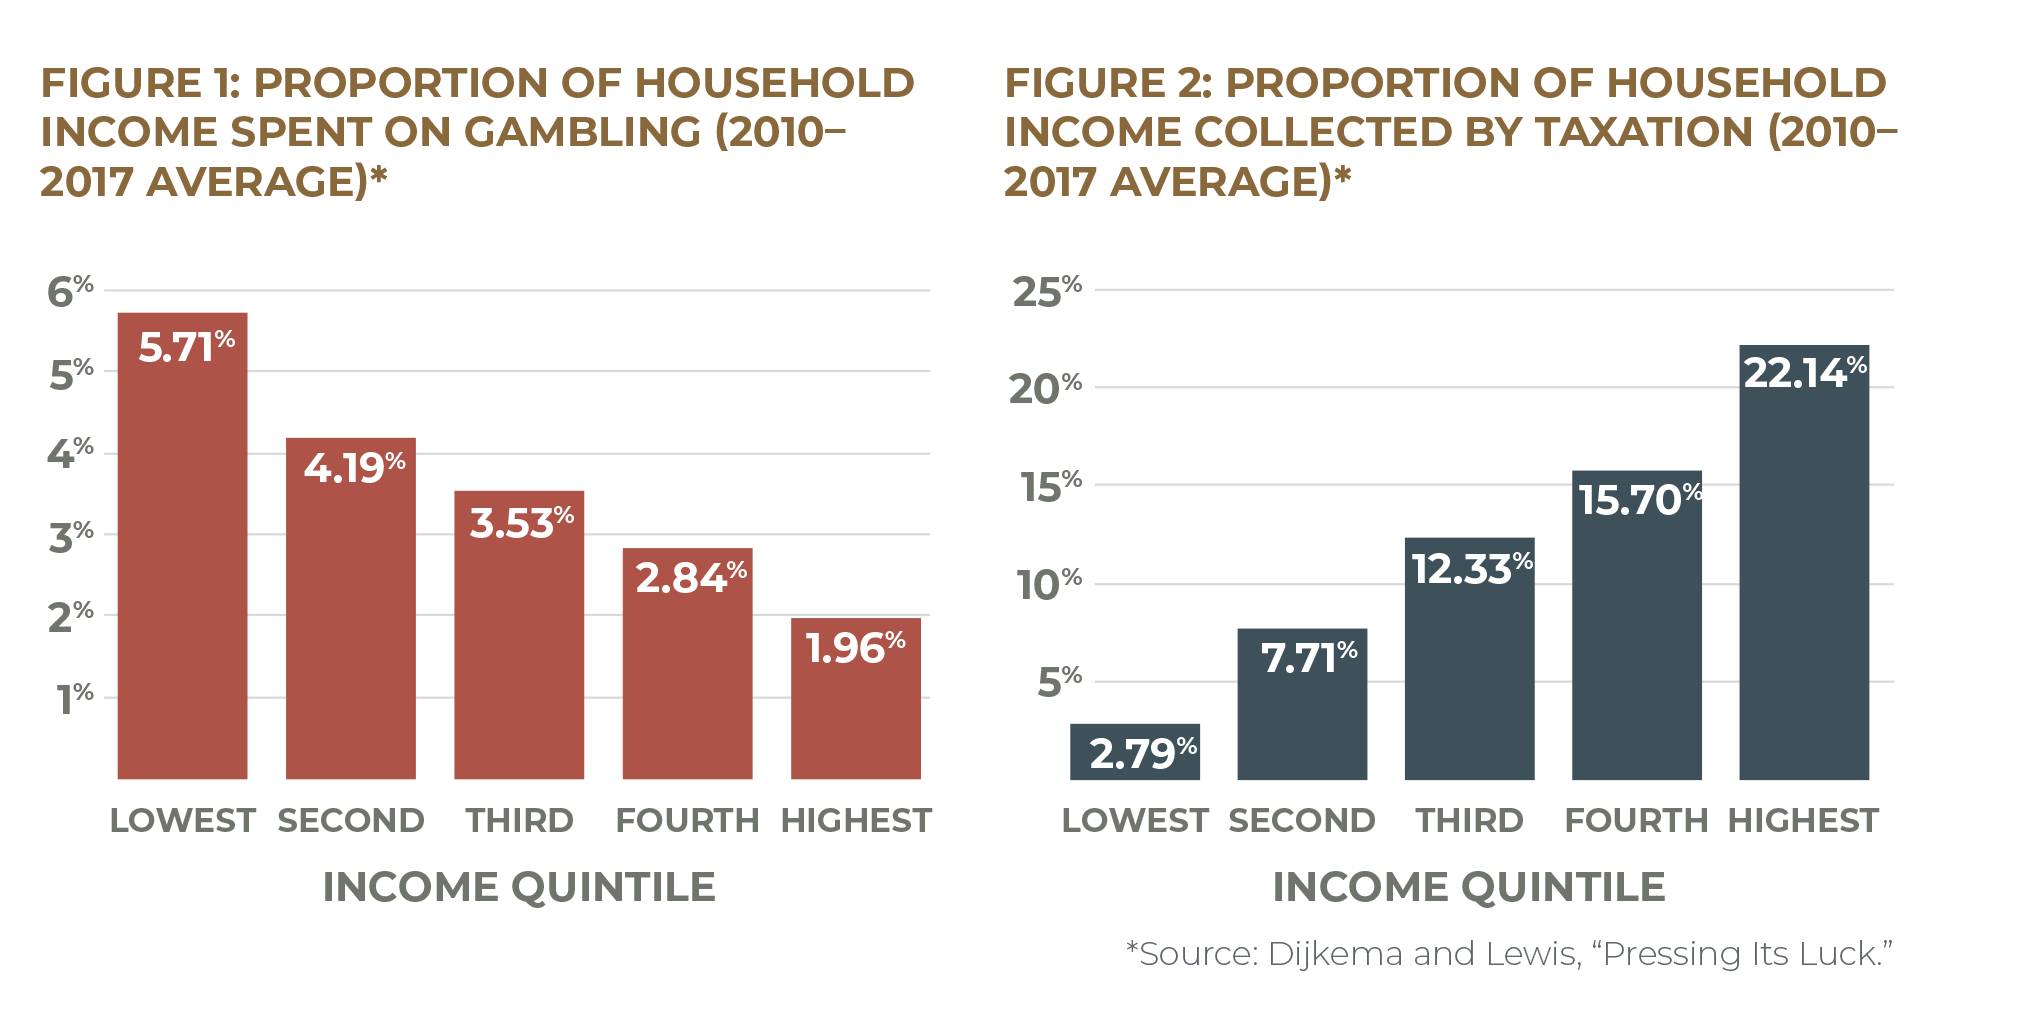
As noted in Cardus’s major study on provincial gambling policy in Canada, 1 1 Dijkema and Lewis, “Pressing Its Luck”; Dijkema and Lewis, Royally Flushed. gambling profits are treated just like tax revenues. Yet there is a significant difference in the way that these two types of revenue sources are collected, and in the burden that they place on citizens. Income and sales taxes are carefully designed to ensure that the poor shoulder a lighter tax burden than those with more: the proportion of income collected in income taxes from the wealthiest quintile is nearly ten times higher than that collected from the poorest quintile, and low- to moderate-income taxpayers receive regular rebates from the government to prevent their being disproportionately affected by sales taxes. Gambling, however, is a regressive revenue source—that is, relative to income it taxes the poor more heavily than the rich. Households in Canada’s lowest income quintile spend an average of 5.7 percent of their income on gambling each year. This is nearly three times the rate paid by the country’s highest-quintile households (see Figures 1 and 2). 2 2 Author’s calculations based on data from Statistics Canada, “Table 11-10-0193-01,” and Statistics Canada, “Table 11-10-0223-01.” For details on calculation methodology, see Dijkema and Lewis, “Pressing Its Luck.” Meanwhile, between 15 and 50 percent of gambling revenue comes from problem gamblers, even though they make up only 1–4 percent of the population (see Figure 7). 3 3 Williams and Wood, “What Proportion of Gambling Revenue”; Alberta Gambling Research Institute, “Adult Prevalence Studies of Problem Gambling.” Estimates of problem gambling prevalence can vary by jurisdiction and the way that problem gambling is defined and measured in a given study.
As we argue extensively in our earlier paper, money extracted disproportionately from the most vulnerable should not be lumped in with general tax revenue. No government should be using a system that hurts the poor to finance its policy agenda. The harmful way in which gambling profits are collected requires that these funds should be kept separate from tax revenue. Ontario’s government should properly account for its reliance on these hidden taxes. Moving gambling revenue out of the consolidated fund and into a specific fund would be the equivalent of the government admitting that it has a problem, admitting that it is harming the public that it is intended to protect, and forming the first steps to making direct amends. 4 4 Gamblers Anonymous, “Recovery Program.”
The best way for government to make amends is to take these funds and direct them toward policies aimed at addressing the savings gap: poorer Canadians have much more difficulty saving and building assets than do their middle- and upper-class counterparts, not only because they have lower incomes but also because government incentives to save are tailored to higher earners. The impetus for our project was to help make saving easier for people like Alice, whom we met (as readers may remember) during previous Cardus research on payday loans. We learned that one of the factors that made Alice vulnerable was low levels of liquid savings in the bank, making an expensive and risky payday loan her only option when a financial emergency struck. “Alice” is not a single person but an acronym used by DFC Global Corporation, one of the world’s largest providers of payday loans, to describe its target customer: “asset-limited, income-constrained, employed.” 5 5 Dijkema and McKendry, “Banking on the Margins,” 19–20. This is the demographic—those who are financially vulnerable due to low incomes and few assets—that we have in mind when we say that our goal is to help the poor save.
Provinces spend millions of dollars each year on gambling advertisements that urge players to spend their extra dollars rather than putting them away (see Figures 3 through 5). Lottery ads urge ticket buyers to dream of the financial freedom and security that winning might bring, a dream particularly tantalizing for those who feel locked out of traditional pathways to wealth. Polls have found that around a third of Canadians plan to fund their retirement with lottery winnings. Meanwhile, American data suggest that lower-income families are particularly likely to believe that hitting the jackpot is their best shot at wealth: nearly two-fifths (38 percent) of households with annual incomes below $25,000 said that winning the lottery was the most practical way for them to accumulate several hundred thousand dollars, while only 21 percent of the total sample said the same. 6 6 Scott, “34% of Canadians Plan to Retire by Winning the Lottery”; TD, “Ontario Boomers Not Ready for Retirement”; CFA and FPA, “How Americans View Personal Wealth”; see also Kingston, “Retirement 6/49.” Yet rather than fulfill these hopes, the gambling system siphons wealth from citizens’ bank accounts: governments make money from casinos and lotteries only because gamblers come out poorer in the long run.


Meanwhile, the families disproportionately harmed by the gambling system are the same families that benefit least from government policies designed to encourage saving. The federal government spends $45 billion on tax-advantaged registered savings plans such as RRSPs, which proportionately are used by and benefit middle- and upper-income Canadians with higher taxable incomes and who thus have more to gain from income-tax exemptions, deferrals, and deductions. 7 7 Côté, Mazer, and Weisstub, “Canada Saver’s Credit,” 3; Rothwell and Robson, “Prevalence and Composition,” 18. Even TFSAs, which were meant to fill this savings-policy gap, remain underused by lower-income savers. 8 8 Shillington, “Are Low-Income Savers Still in the Lurch?” The upshot is that those who could most use some extra help building savings are the least likely to get it. Restructuring Ontario’s gambling system to ensure that funds are used to incentivize savings for those on the economic margins would rectify the injustice inherent in our current system and further the prospects of Ontario’s poor.
Canada’s household savings rate has fallen dramatically over the last few decades. 9 9 Rothwell and Robson, “Prevalence and Composition,” 17. (The household saving rate spiked in 2020 as a result of government income-support programs and lockdown-related restrictions on spending, 10 10 Statistics Canada, “Household Economic Well-Being During the COVID-19 Pandemic.” but whether high savings rates will continue as COVID-19 subsides is unclear.) Canadian families saved around 20 percent of their income in the 1980s compared to just 5 percent in 2018. 11 11 Côté, Mazer, and Weisstub, “Canada Saver’s Credit,” 10. In one 2019 survey, one-quarter of Canadians reported that they didn’t save anything at all in the past year. 12 12 Bank of Montreal, “BMO Household Savings Report.” Meanwhile, household debt levels have soared from 85 percent of disposable income in the 1990s to 170 percent today. 13 13 Côté, Mazer, and Weisstub, “Canada Saver’s Credit,” 10. Canadian households’ debt service ratio—the proportion of disposable income spent on debt payments—is projected to rise. 14 14 Parliamentary Budget Officer, “Household Indebtedness and Financial Vulnerability.”
And it’s not just savings writ large that is a challenge. Short-term saving for financial emergencies is critical for families with lower incomes: “While a low savings rate can slow the economic progress of middle- and upper-income families, the absence of savings can prove disastrous for lower-income households. That is because one function of savings is as a cushion for emergencies, such as losing a job or to cover an automobile repair in order to get to work.” 15 15 John, Butler, and Rust, “Boosting Economic Mobility Through Prize-Linked Savings.” A lack of assets may put families at greater risk of falling into poverty in the future, even though their current incomes put them above the poverty line. 16 16 Côté, Mazer, and Weisstub, “Canada Saver’s Credit,” 11. Even a small amount of savings can reduce financial vulnerability significantly, especially for those who lack access to good credit.
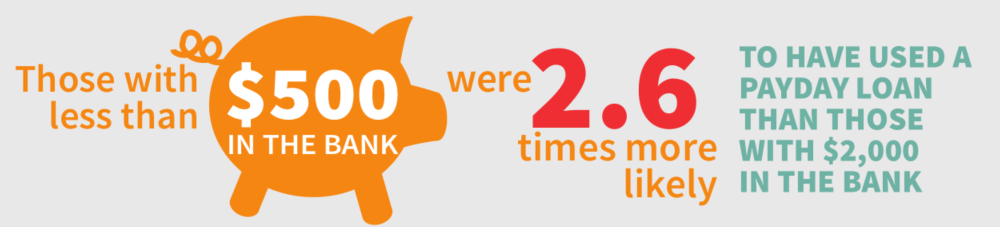
The Urban Institute, for example, found that a buffer of just $250–$749 makes families less vulnerable to hardship in the face of income loss. 27 27 McKernan et al., “Thriving Residents, Thriving Cities.” After controlling for other characteristics, households with $500 or less in liquid savings in their bank accounts are 2.6 times more likely to use payday loans than households with $2,000 to $8,000 in the bank. 28 28 Dijkema and McKendry, “Banking on the Margins,” 20; Pyper, “Payday Loans,” 8. Yet many Canadians are struggling to build up even a small buffer of emergency savings. In 2015, 29 percent of Canadians reported that their emergency savings would last a month or less. Almost half (44 percent) said that they had $5,000 or less in emergency savings. And 46 percent of Canadians said the lack of an emergency savings fund, either past or present, caused their debt to increase. 29 29 Bank of Montreal, “BMO Rainy Day Survey.”
The economic calamity induced by the COVID-19 pandemic has drawn fresh attention to the importance of a savings buffer. Sudden layoffs on an unprecedented scale have demonstrated that a loss of income can strike anyone at any time. 30 30 Many Canadians are asset-poor, making them particularly vulnerable to the loss of income accompanying an unexpected layoff. See Robson, “Assets in the New Government of Canada Poverty Dashboard”; Compass Working Capital, “Why Asset Poverty Matters”; Robson and Rothwell, “A Tale of Two Trends.” Yet claims for unemployment benefits spiked into the millions at a time when close to half of working-age Canadians do not have enough financial assets to cover their basic living expenses for three months. 31 31 Financial assets include “all non-pension financial assets at market value, i.e., all bank accounts, term deposits, mutual funds, stocks, bonds, and registered savings plans.” The ability to cover basic living expenses is defined as the ability to maintain a household at 50 percent of the median income. Rothwell and Robson, “Prevalence and Composition”; see also Alini, “Coronavirus.” Evidence from the United States suggests that savers have weathered the economic storm better than those without anything set aside: even after losing half of their pre-COVID income, families with savings were less likely to have to borrow, take on credit-card debt, or postpone bill payments to make ends meet compared to those whose incomes were similarly reduced but had no savings. 32 32 Gopnik and Collins, “Emergency Savings.”
Saving is an important way for households to build assets over the long term, improving financial stability and economic mobility. Research has found that the possession of assets has positive effects on individuals, families, and communities—such as increased confidence and higher rates of social and civic engagement—that are distinct from the effects of income. Assets have been linked to positive educational outcomes for children, 33 33 Rothwell and Robson, “Prevalence and Composition,” 18; Momentum, “Asset Building.” and “children of low-income, high-saving parents are more likely to experience upward income mobility” compared to children of low-income, low-saving parents. 34 34 Cramer et al., “A Penny Saved Is Mobility Earned,” 2. Low-income families with savings have better financial resilience than middle-income families without savings. 35 35 McKernan et al., “Thriving Residents, Thriving Cities.” And apart from any long-term impact on net worth, the habit of saving may itself “provide a sense of accomplishment that counteracts feelings of financial distress,” a security separate from and in addition to the security that the income and savings themselves provide. 36 36 Loibl, Kraybill, and DeMay, “Accounting for the Role of Habit in Regular Saving.”
Building financial security for all Canadians, but especially for the most vulnerable, is widely recognized as an important policy priority. With public budgets already upended by the pandemic, governments have a unique opportunity to kick their gambling addiction with relatively little disruption to provincial balance sheets. It’s time to reform the provinces’ gambling scheme to work for, not against, low-income households. But how? We examine four options below.
Option 1: Return gambling profits to the poor through cash transfers
The simplest option for policy-makers would be to give gambling money back to the poor. Instead of subsidizing general spending with a regressive tax taken from the pockets of the poor, the group disproportionately providing the tax would be the group that benefits from the tax. This policy would in many respects be no different from existing sales-tax rebate programs like the GST/HST tax credit: in order to prevent sales taxes from disproportionately burdening low- and moderate-income families, households whose incomes fall below a certain cut-off receive a quarterly payment from the government to offset the amount of sales tax they pay. 37 37 Canada Revenue Agency, “GST/HST Credit.”
Cash-transfer programs are a common policy tool for both federal and provincial governments. Canadian examples include the Canada Workers Benefit (successor to the Working Income Tax Benefit), 38 38 Government of Canada, “Canada Workers Benefit.” Old Age Security 39 39 Government of Canada, “Old Age Security.” and the Guaranteed Income Supplement, 40 40 Government of Canada, “Guaranteed Income Supplement.” the Canada Child Benefit, 41 41 Government of Canada, “Canada Child Benefit.” and various provincial income-assistance programs. These can be paid out as a monthly income supplement (like the Guaranteed Income Supplement or Canada Child Benefit) or as an annual lump sum based on an individual’s income-tax return (like the Canada Workers Benefit). Most transfers are means-tested, with payments phasing out above a given income level. A new cash transfer funded by gambling profits—called, say, the Gaming Savings Credit (GSC)—could follow the same structure as existing transfers. Each year, a province’s total gambling profits would be divided among all households below a certain income cut-off, and the province would send a GSC cheque to each one. This benefit would be real money for low-income families: in Ontario, the GSC would have been worth around $1,886 per low-income adult in 2018; in Atlantic Canada, $1,888; in Alberta, $4,469; in British Columbia, $2,875. 42 42 Author’s calculations based on the number of adults (eighteen years and older) living below the poverty line, defined using Statistics Canada’s market-basket measure. Statistics Canada, “Table 11-10-0135-01: Low Income Statistics by Age, Sex and Economic Family Type”; Ontario Lottery and Gaming, “Annual Report 2017–18”; Atlantic Lottery Corporation, “Annual Report 2017–18”; Alberta Gaming, Liquor and Cannabis Corporation, “Annual Report 2017–18”; British Columbia Lottery Corporation, “2017/18 Annual Service Plan Report.” (It should be noted that these totals are similar to the amount of liquid savings in bank accounts linked to a significantly lower risk of using a payday loan.)
Policy benefits and disadvantages
The chief advantage of this policy option is its familiarity, which makes it easy to design and administer. Policy-makers could take advantage of existing infrastructure for determining eligibility for the benefit and delivering payments. The administration of the program would be particularly efficient if eligibility were tied to another transfer program—for instance, everyone receiving Ontario Works payments could be made eligible for the GSC. Another advantage to bundling the GSC with an existing program is that policy-makers would have flexibility in setting the parameters of the new transfer. If a government wanted to design the program to give a larger benefit to people with disabilities or to families with children, it could use the same sliding scale and supplements that have already been established in other programs: everyone who receives the disability supplement of the Canada Workers Benefit, for example, could receive a higher GSC payment.
Another major benefit of creating a new transfer is the opportunity to directly boost income equality by increasing the incomes of the poor. Research suggests that Canada’s tax and transfer system has helped reduce inequality over the last few decades. 43 43 Fortin et al., “Canadian Inequality.” An analysis by Statistics Canada estimated that in 2016, government transfers reduced low-income rates from 30 percent to 14 percent for women and from 28 percent to 12 percent for men; put another way, low-income rates would have been around 16 percent higher without the transfers. 44 44 Harding, “The Effect of Government Transfer Programs.” This analysis did not account for behavioural effects of transfer programs, such as labour market or social decisions made in response to government transfer policies.
Researchers have studied cash transfers extensively and have found positive effects on the well-being of low-income families and on children in particular. Unconditional transfers have been linked to positive educational outcomes, especially for poorer children. 45 45 Marinescu, “No Strings Attached.” There is modest evidence to suggest that unconditional cash transfers improve some health outcomes, increase the likelihood of enrolling in and attending school, and lead to higher spending on health care in low- and middle-income countries. 46 46 Pega et al., “Unconditional Cash Transfers”; Baird et al., “Conditional, Unconditional and Everything in Between”; Bastagli et al., “Cash Transfers.” In Canada, child benefits have grown increasingly effective at reducing low-income rates over the past two and a half decades, especially for women. 47 47 Harding, “The Effect of Government Transfer Programs.” Following the introduction of the Canada Child Benefit, food insecurity declined among Canadian families, with the effect most pronounced among financially vulnerable families. 48 48 Brown and Tarasuk, “Money Speaks.” The Canada Child Benefit has been associated with better maternal health as well as improved test scores and mental health for children. 49 49 Lebihan and Mao Takongmo, “Unconditional Cash Transfers and Parental Obesity”; Milligan and Stabile, “Do Child Tax Benefits Affect the Well-Being of Children?”; Daley, “Income and the Mental Health of Canadian Mothers.” Low-income pregnant women receiving an unconditional cash benefit in Manitoba had better birth outcomes than their comparable counterparts who did not receive the benefit, resulting in a narrower outcomes gap between high-income women and low-income women receiving the benefit. 50 50 Brownell et al., “An Unconditional Prenatal Income Supplement.” When researchers examined how the benefit contributed to the improved outcomes, they found that the unconditional nature of the transfer was key to the program’s success: women “were empowered to choose how to use the benefit to best meet their needs.” 51 51 Struthers et al., “Understanding the Particularities of an Unconditional Prenatal Cash Benefit.”
Consistent with these improved outcomes, researchers have found that cash-transfer income is generally used well and in line with the intention of the policy. Some studies have found that benefit recipients save a portion of their transfer payments or use them to pay down debt. 52 52 Halpern-Meekin, “It’s Not Like I’m Poor”; Edin, Tach, and Halpern-Meekin, “Tax Code Knowledge and Behavioural Responses among EITC Recipients”; Mendenhall et al., “The Role of Earned Income Tax Credit”; Shaefer, Song, and Williams Shanks, “Do Single Mothers in the United States Use the Earned Income Tax Credit to Reduce Unsecured Debt?”; Despard et al., “Do EITC Recipients Use Tax Refunds to Get Ahead?”; Smeeding, Ross Phillips, and O’Connor, “The EITC”; Jones and Michelmore, “The Impact of the Earned Income Tax Credit on Household Finances.” The effect of policies like the Working Income Tax Benefit or Earned Income Tax Credit on savings behaviour is not necessarily due to the payment alone—their labour-market incentives, for instance, may also contribute to regular saving by encouraging recipients to enter the labour force, which could increase income and the amount these recipients can put away. In other words, it may not be the money from the benefit itself that leads to saving, but the labour-supply effect of the benefit. Jones and Michelmore, “The Impact of the Earned Income Tax Credit,” for instance, finds evidence of substantial saving after receiving the Credit only when expansions to the benefit also increased earned income. McGranahan, “Tax Credits and the Debt Position of U.S. Households,” finds that households use their refunds to pay down delinquent debt—i.e., debt for which households are overdue on payment deadlines—but also to increase auto and credit card debt. Evidence from the Working Income Tax Benefit, Canada Child Benefit, and the Earned Income Tax Credit, an American transfer program, indicates that while most recipients spend at least a portion of their refund and benefit income immediately, much of the money is used for necessities such as food, housing, and school supplies. 53 53 Despard et al., “Do EITC Recipients Use Tax Refunds to Get Ahead?”; Goodman-Bacon and McGranahan, “How Do EITC Recipients Spend Their Refunds?”; Smeeding, Phillips, and O’Connor, “The EITC”; for similar international evidence, see Raschke, “The Impact of the German Child Benefit on Child Well-Being”; Raschke, “The Impact of the German Child Benefit on Household Expenditures and Consumption.” Jones, Milligan, and Stabile demonstrate that low-income families in Canada spend their Canada Child Benefit income on tuition and educational supplies and on household essentials, including child care, basic food in stores, and transportation. They also find evidence that receiving the Canada Child Benefit causes families to reorganize their budgets in financially healthy ways, observing decreases in spending on restaurant meals, alcohol, and tobacco. 54 54 Jones, Milligan, and Stabile, “Child Cash Benefits and Family Expenditures.” Similarly, Adams, Amedah, and Fougère examine the Canada Child Benefit and find that families use their benefit to pay for child care and school-related expenses. 55 55 Adams, Amedah, and Fougère, “Measuring the Effect of Child Benefit on Household Expenditures.”
Yet the GSC also has its drawbacks. Perhaps the most problematic is a corruption of purpose—money is being taken from the same vulnerable groups that it is then used to support. Our response to such an argument would be that since gambling is here to stay, and the best place for the profits to go is to the government (rather than a corporation whose primary duty is to enrich shareholders rather than promote the common good, or even worse, organized crime), these profits should be used to benefit the people most harmed before any other group. Another concern is that supplementing income assistance with gambling profits might simply mean a reallocation (i.e., a lowering) of other expenditures related to income support, leaving the government’s gambling addiction intact. The recent recommendation of creating a type of sovereign wealth fund with “sin taxes” 56 56 Di Matteo, “The Fiscal Wages of Sin.” is particularly vulnerable to this concern. If the government uses the GSC as an excuse to cut program costs elsewhere, the GSC will have done little more than move money around. It may even make the situation worse, by causing policy-makers to think that they have succeeded at solving the problem—or by strengthening the incentive to increase gambling revenues in order to support a good cause. In this case, the only potential success of the policy would be if GSC funds were kept separate from general revenues, which would increase transparency in the use of gambling money and thus improve government accountability.
As with other cash-transfer programs, the GSC could have negative labour-market effects if not carefully designed. The new means-tested benefit income could act as a disincentive to employment for households receiving it, particularly if this income is clawed back as earnings rise (or interacts with other transfer programs to have a similar effect). 57 57 See, e.g., Laurin, “Two-Parent Families with Children.” But this danger is not inherent in the transfer itself, simply a consideration for program design. Other cash-transfer programs such as the Working Income Tax Benefit / Canada Workers Benefit and the Earned Income Tax Credit were carefully—and, as research has demonstrated, fairly successfully—designed to encourage labour-market participation. 58 58 See, e.g., Eissa and Hoynes, “Behavioral Responses to Taxes”; Eissa and Liebman, “Labour Supply Response to the Earned Income Tax Credit”; Hotz and Scholz, “The Earned Income Tax Credit,”; Agostinelli, Borghesan, and Sorrenti, “Welfare, Workfare and Labor Supply”; Hasan, “Labour Supply Response to the Working Income Tax Benefit”; Annabi, Boudribilia, and Harvey, “Labour Supply and Income Distribution Effects of the Working Income Tax Benefit.” One possible solution would be to tie eligibility for the GSC to receipt of existing transfer programs with work incentives. In addition to reducing potential labour-market barriers, bundling these credits would streamline the administrative process. Moreover, while the GSC would be large enough to have a meaningful positive impact on a low-income household’s finances, it is still a relatively modest sum at just under $2,000.
Even more relevant to the other goals of this paper, a transfer is not biased in favour of savings habits. Both Ottawa and the provinces already have a suite of transfer policies that provide income assistance to the poor, but as mentioned above, the existing policy framework does very little to help low-income Canadians save (and in many cases includes strong disincentives for saving, such as asset limits in means-tested programs). Those whose financial vulnerability stems from asset poverty rather than income poverty won’t be helped by another transfer program designed to boost income. 59 59 Rothwell and Robson, “Prevalence and Composition,” 25.
The GSC could however be oriented toward saving by including in the program an incentive to save the benefit payment. Rather than issuing monthly cheques, the government could pay out a lump sum once a year so as to prevent dependence on these funds to pay bills. As a further nudge toward savings, the credit could be deposited directly into a recipient’s TFSA. 60 60 See also Côté, Mazer, and Weisstub, “Canada Saver’s Credit.” Though this approach would involve some additional administrative work for those who had not yet set up a TFSA, this barrier would be relatively low since almost all Canadian adults have at least one account at a bank or other financial institution. 61 61 World Bank, “The Global Findex Database 2017.” Another way to deliver this payment would be to bundle it with a person’s annual income-tax refund. Low-income families could be encouraged to save some (or all) of their refund when they receive it. Indeed, many organizations working to build financial security have targeted tax time as a valuable window to incentivize saving by offering a matching credit to those who save some of their refund. Tax refunds are the largest single chunk of money many low-income households can expect to receive in a year. While they may not have much left over to save after paying the bills in a typical month, their refund gives them some extra cash that could be put away, placing them in a better position to handle a financial emergency if one strikes later in the year. 62 62 Consumer Financial Protection Bureau, “Increasing Saving at Tax Time.” Tax-time incentivized savings programs have met with moderate success in both Canada and the United States. 63 63 Momentum, “Incentivized Saving”; Azurdia and Freedman, “Encouraging Nonretirement Savings,” ES1–9.
As with the transfer program itself, there are both benefits and drawbacks to enhancing the GSC with a tax-time savings incentive. On the one hand, it would help meet the need for savings incentives targeted to income- and asset-poor Canadians, and it would be a relatively low-touch program compared to other matched savings initiatives (which we turn to next). But on the other hand, such a program would need to be administered in cooperation with community services organizations (to promote and explain the savings option, provide tax-filing assistance, and help interested participants deposit their benefit and withdraw their match a year later) and/or financial institutions (to deliver the savings accounts and monitor which account holders maintain their balance long enough to be eligible for a match). There are many non-profit organizations and financial institutions already doing this kind of work across Canada, so a government interested in exploring this option would have plenty of partners with whom it could initiate a tax-time saving-program trial. Nevertheless, the involvement of multiple players and the year-long timeline eliminate the very simplicity that might make this policy option more appealing than the others.
Conclusion
As with existing sales-tax rebate programs, returning gambling profits to low-income Canadians through a cash-transfer program like the GSC would help prevent governments from relying on a regressive revenue source that disproportionately burdens the poor. It could work with other transfer programs to improve the financial well-being of vulnerable households. Policy-makers would need to design the program carefully to ensure transparency and avoid unintended negative effects. While the GSC does not directly address the lack of savings incentives tailored to low-income households, there are nevertheless several options available to build savings nudges into the program in partnership with civil-society organizations.
Option 2: Promote asset building with matched savings
A second policy option is to use gambling profits to fund a matched savings program. At its most basic level, this program would use gambling dollars to reward saving by matching participants’ contributions to designated savings accounts. Many governments and non-profit organizations use a wide variety of matched savings programs to encourage saving. One of the most well-known Canadian examples is the Registered Education Savings Plan, a program in which the government adds money to a savings account designated for a child’s education. On the more intensive side are programs modelled after individual development accounts (IDAs), an asset-based welfare initiative developed by Michael Sherraden in his seminal 1991 book Assets and the Poor: A New American Welfare Policy. 64 64 Sherraden, Assets and the Poor. IDA programs generally have several common components. At their core is a savings account for low-income individuals, who can earn matching credits on every dollar they save up to a maximum or match cap. Eligibility is means-tested, restricted to those below a certain income threshold and holding a limited amount of liquid assets. Participants have a designated period of time in which to save toward a specific goal. During this time, they receive training—sometimes voluntary, sometimes mandatory—in financial management, such as budgeting skills and different types of credit. Participants receive matching credits with their deposits only if they use their withdrawals for designated investments, typically education or training, starting a small business, or homeownership.
IDAs and similar matched savings programs are designed to accomplish several interrelated objectives. They directly fill the gap in tax-based and other financial incentives for saving that low-income households experience. They are designed to help participants reach a financial goal that will improve their long-term earning potential and, ideally, net worth. The program is generally structured in such a way as “to kick-start a savings habit,” 65 65 Leckie et al., “Final Report,” 12. encouraging participants to save regularly during and after the program. The financial education and coaching help improve participants’ financial literacy. Tying the matching credits to a formal savings account also works to strengthen participants’ connection to mainstream financial institutions, which tends to be weaker among low-income households (whose lower levels of income, financial capital, and assets make accessing credit more difficult, since banks have less information and fewer indicators with which to evaluate their credit risk). 66 66 Leckie, Dowie, and Gyorfi-Dyke, “Early Impacts,” 3.
Several developed countries have tested asset-building policies on a large scale in recent years. The American Dream Demonstration followed fourteen IDA programs, representing about 2,400 accounts across the country, from 1997 to 2002, and found that the poor can save: the average participant saved US$16 (CA$21) per month—nearly US$200 (over CA$250) per year—and the poorest participants saved a higher proportion of their income than others. IDAs are now offered by hundreds of social-service organizations across the United States. 67 67 Sherraden, “Innovations in Asset Building”; Feldman, “Saving from Poverty,” 185–88. Another matched savings program is the United Kingdom’s Help to Save program (a successor to the extensively piloted, but ultimately axed, Saving Gateway). 68 68 BBC News, “Budget: Saving Gateway Scheme Is Scrapped”; Kelly, “Welcome Back, Help to Save.” The program offers 50p for every £1 saved by eligible participants. Participants have four years in which to save and can earn up to £1,200 in matching bonuses on their savings. 69 69 GOV.UK, “Get Help with Savings if You’re on a Low Income (Help to Save).” Eligibility for Help to Save is tied to eligibility for other means-tested credits. 70 70 GOV.UK, “Get Help with Savings if You’re on a Low Income (Help to Save): Eligibility.” Participants can continue using their Help to Save accounts if they stop claiming benefits. While asset limits for some (though not all) means-tested programs are sensitive to participants’ contributions to their Help to Save accounts (i.e., the amount of benefits participants receive will be affected if their own deposits exceed the asset limits of these programs), benefit payments are not affected by the bonuses paid through Help to Save. 71 71 GOV.UK, “Get Help with Savings if You’re on a Low Income (Help to Save): How It Will Affect Your Benefits.”
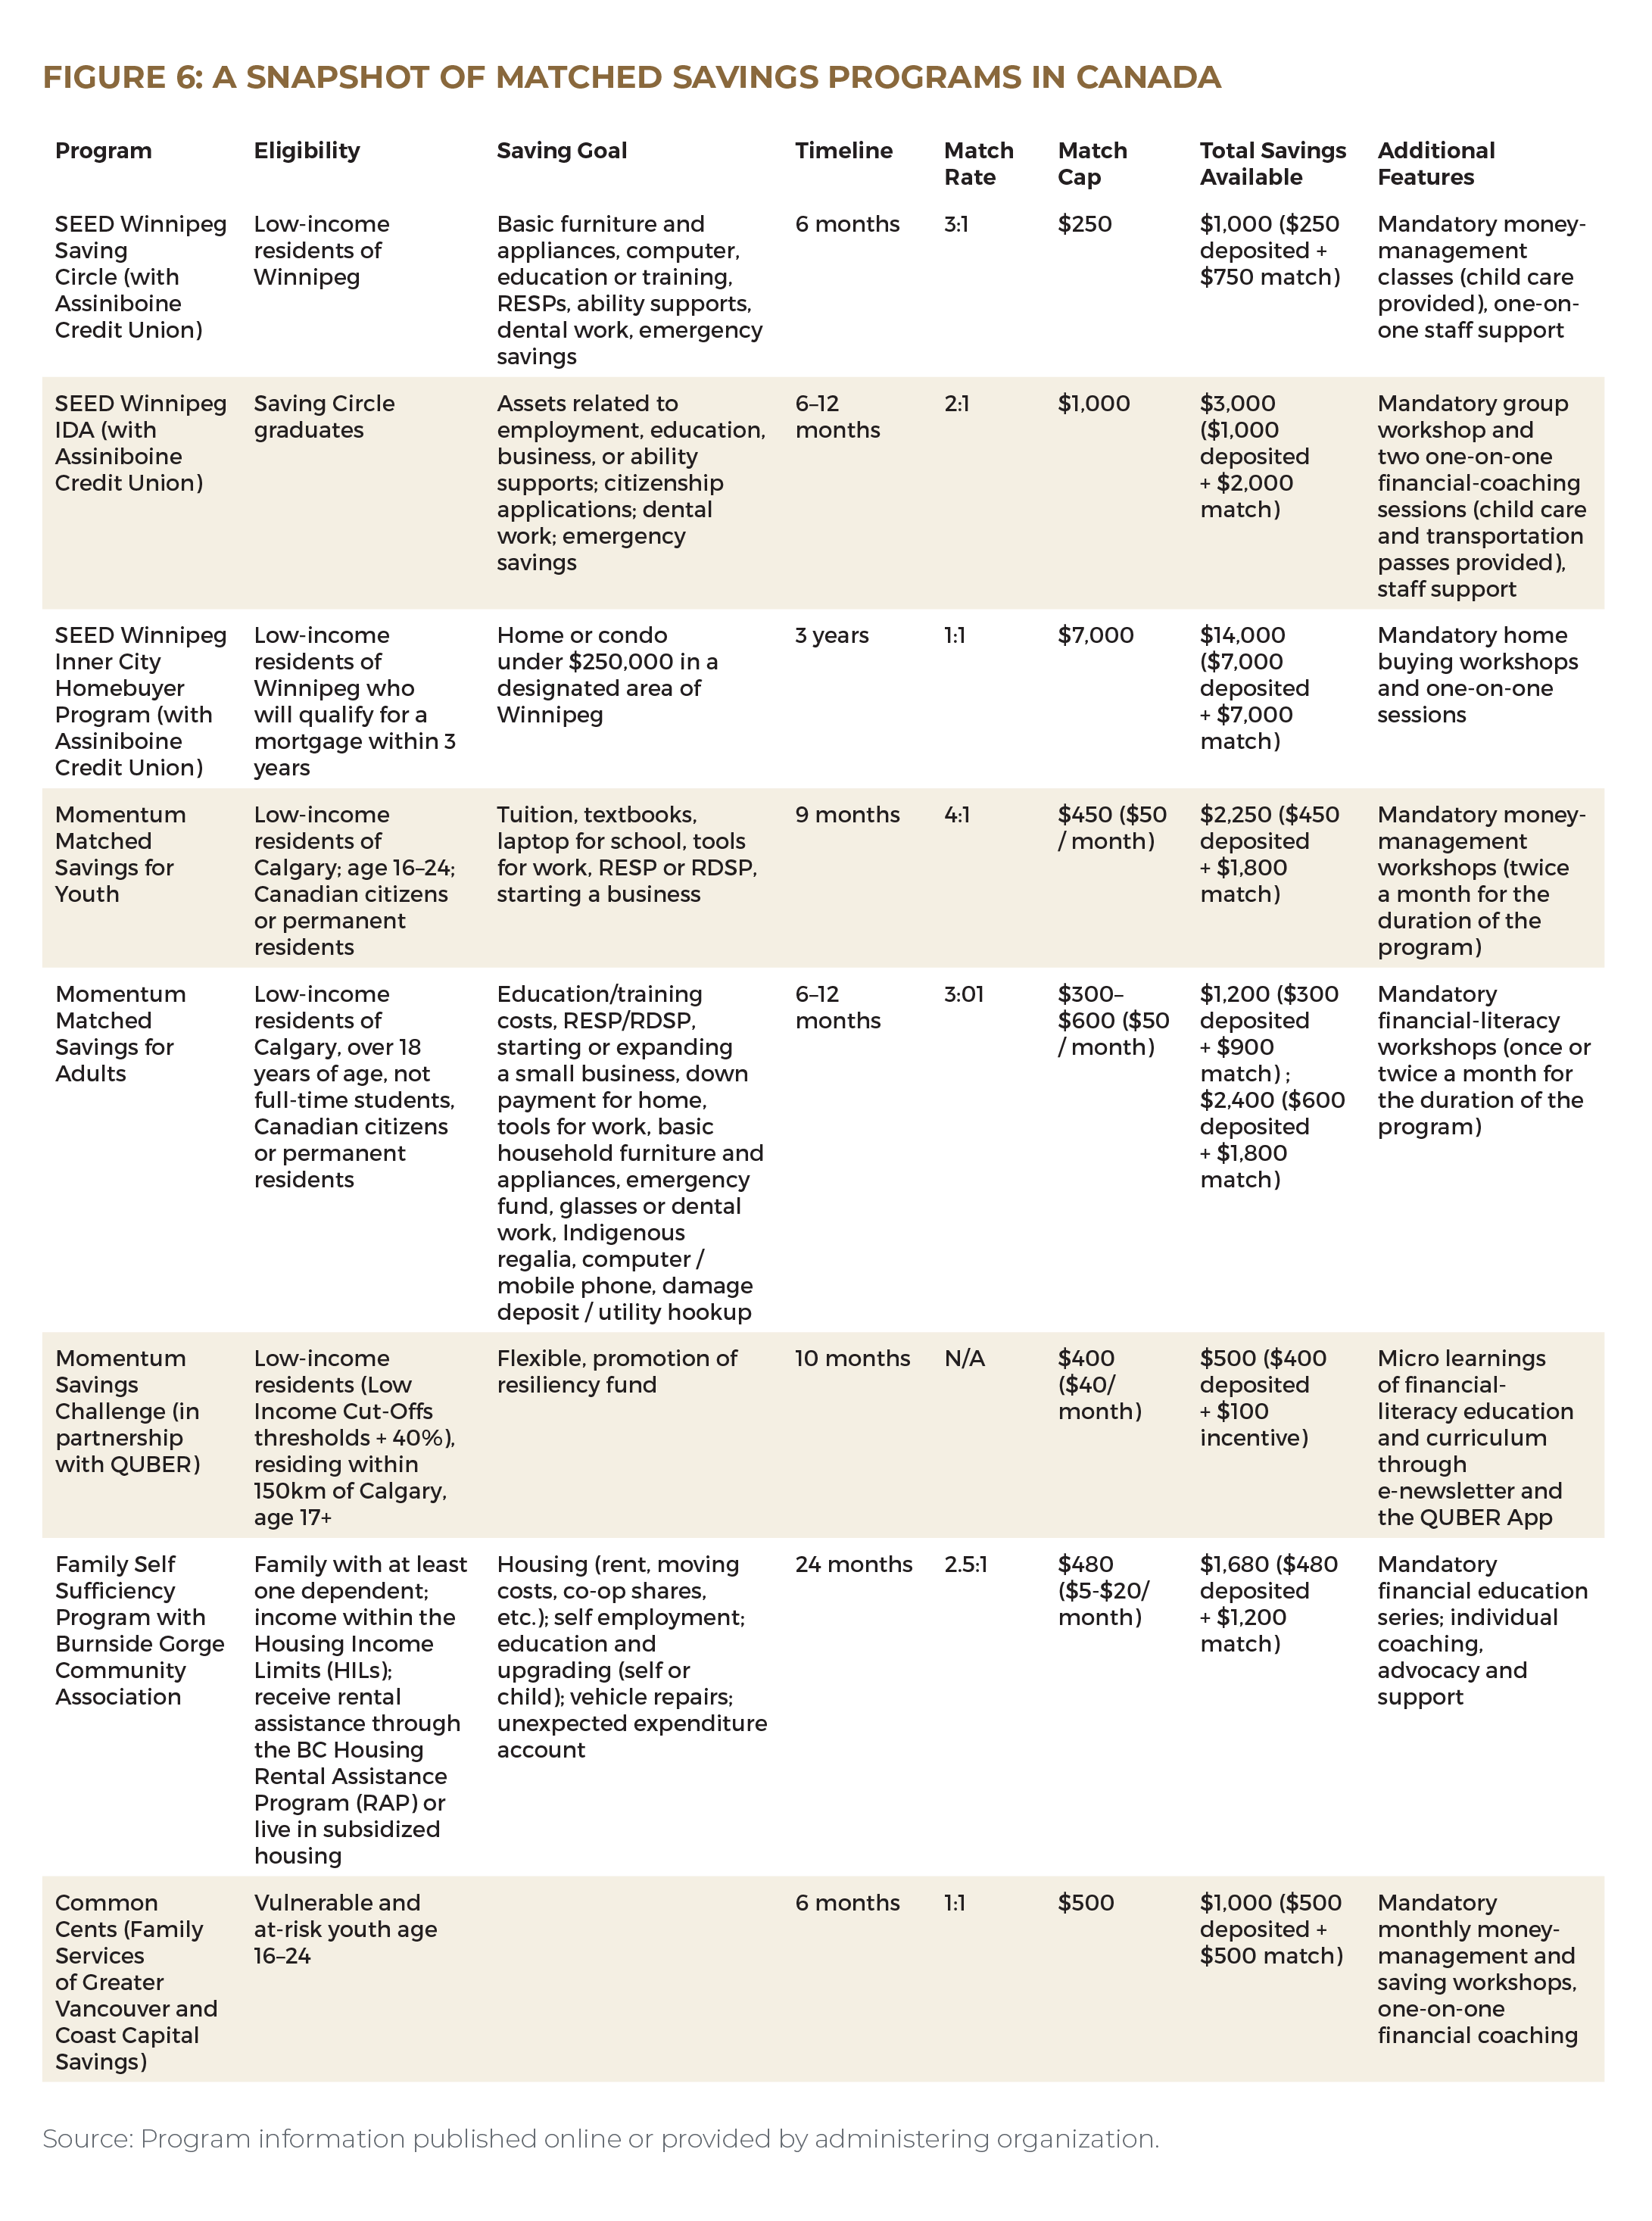
IDAs or similar matched savings accounts are also available in certain parts of Canada, where they are offered by non-profit organizations including SEED Winnipeg (Saving Circle, 72 72 SEED Winnipeg, “Saving Circle”; SEED Winnipeg, “Saving Circle Booklet.” IDA, 73 73 SEED Winnipeg, “Individual Development Account”; SEED Winnipeg, “IDA Booklet.” Inner City Homebuyer Program 74 74 SEED Winnipeg, “Inner City Homebuyer Program.” ), Momentum Calgary (Matched Savings for Youth, formerly Youth Fair Gains 75 75 Momentum, “Matched Savings for Youth”; Peariso, “Youth Fair Gains.” ; Matched Savings for Adults 76 76 Momentum, “Matched Savings for Adults.” ; Savings Challenge 77 77 Information provided by Momentum. ), Burnside Gorge Community Association (Family Self Sufficiency Program 78 78 Information provided by Burnside Gorge Community Association. An additional asset-development opportunity exists for those living in subsidized non-profit housing. If their household income increases (and rent goes up) during the program, an escrow savings program will kick in: the difference between their rent rate at the start of the program and the higher rent rate will be set aside by the subsidy provider until the end of the three-year program, up to a cap of $7,500. Not all participants will be eligible for this program as rents do not often change. ), and Family Services of Greater Vancouver (Common Cents 79 79 Family Services of Greater Vancouver, “Coaching and Workshops.” Saving goal not specified. ), often in partnership with credit unions such as Vancity, 80 80 Vancity, “Savings and Investments.” Assiniboine, 81 81 Assiniboine Credit Union, “Asset Building Programs.” and Coast Capital Savings (see Figure 6).
The learn$ave demonstration project
By far the most significant IDA program in Canada was the learn$ave demonstration project, a matched savings pilot program that began in June 2000 and issued its final report in November 2010. In total, the project enrolled 4,802 low-income working adults, including 3,808 participants at three experimental sites set up as a randomized control trial. 82 82 Applicants’ household income could not be above 120 percent of the low income cut-off, and the program included liquid-asset limits to ensure that participants used the program to build new savings rather than moving their existing assets into the high-yielding learn$ave accounts. If an applicant owned a home—which would give him or her access to relatively cheap credit—it could not exceed the median value of homes in the area. Leckie et al., “Final Report,” 9–10, 26. Applicants selected for the program at those sites were randomly sorted into one of three groups: learn$ave plus (who received matching savings credits plus financial-management training and case management), learn$ave only (who received matching savings credits without any additional training), or the control group (who received neither financial management training nor matching credits). 83 83 Leckie, Dowie, and Gyorfi-Dyke, “Early Impacts,” xi.
Most features of the program followed the traditional IDA model closely. Participants opened their learn$ave accounts at partner financial institutions, which included one bank and several credit unions. All learn$ave participants (i.e., not the control group) received basic administrative support, but learn$ave-plus group received more intensive case management and financial-skills training. 84 84 Leckie et al., “Final Report,” 15. Financial training was not specific to education and/or small business requirements. Both learn$ave-only and learn$ave-plus participants received three dollars in matching credits for every dollar they deposited and had three years to save. 85 85 The match rate was 3:1 at the three experimental sites, but some other sites offered match rates ranging from 2:1 to 5:1. To combat the risk of participants simply moving existing liquid assets into their learn$ave accounts rather than building a genuinely new saving habit, participants would qualify for matching credits only after making net deposits of at least $10 in each of twelve months (though these did not have to be consecutive). The program also included a match cap—the maximum deposit that would qualify for matched credits—of $250 per month. Leckie et al., “Final Report,” 11. After the project ended, participants could convert their learn$ave accounts into a regular deposit account at the same institution. 86 86 Leckie et al., “Final Report,” 12–13.
The demonstration showed that even those with relatively constrained finances can save. Most participants opened an account, saved in it (an average of $1,100 over three years), and used their matched credits. 87 87 Leckie et al., “Final Report,” 104. Based on learn$ave participants’ self reports, there was a small but statistically significant increase in the proportion of self-identified savers after the financial incentive expired. The program also helped participants save more regularly, with the combination of credits and services having a modest impact on regular saving. Program participants were more likely to report an intention to save in the future. 88 88 Leckie et al., “Final Report,” 69–70. Families did not give up essentials to max out their savings—participation in learn$ave did not lead to increased hardship. 89 89 Leckie et al., “Final Report,” 75. Measures of hardship included difficulty meeting expenses, needing to borrow to meet needs, food bank use, bankruptcy, and overdue bills at month forty. Participants also rated their life satisfaction on a scale of one to ten. Nevertheless, there was a significant proportion of participants whose early saving behaviour indicated that they would likely have been able to save without learn$ave’s added incentives; there were also several participants who failed to use all their earned credits. 90 90 Leckie et al., “Final Report,” 104.
Policy benefits and disadvantages
The matched savings policy option has the advantage of being highly customizable to the policy goals of various governments. Policy-makers would have the flexibility to determine the program’s match rate—for every dollar deposited by a low-income saver, government could contribute between, say, 50 cents (under a more modest program) and $3 (a more ambitious program)—and match cap. The program could be high-touch, with financial training and intensive case-management services offered to a select group of participants as featured in the conventional IDA model; alternatively, policy-makers could implement something more akin to Help to Save, offering a simple saving match to a broader group. Matching credits could be restricted to long-term investments such as buying a home, starting a small business, or enrolling in post-secondary education, or use of the credits could be unrestricted. Regardless of which model is used, the benefits are simple and easy for all users to understand—“anyone who saves $1 gets $2 from the government,” 91 91 Leckie et al., “Final Report,” 3. compared to, say, “depending on your annual income and family structure, you may be eligible for some or all of this new tax credit.”
Matched savings programs can help participants get into the habit of saving if they are designed with the right rules and incentives. Including monthly deposit requirements may help encourage regular and genuinely new saving rather than reallocation of assets. 92 92 See Harvey et al., “Final Evaluation,” 5. The income constraints experienced by poor households mean that policy-makers will have to design withdrawal rules carefully—restrictions should not be so strict that funds cannot be withdrawn if there is a real emergency, and there should be opportunities for both short- and medium-term savings. 93 93 Leckie et al., “Final Report,” 54. If the use of matched credits is restricted to certain purposes, there should still be some flexibility and the cash-out process should be made as easy as possible. 94 94 See, e.g., Proactive Information Services, “Matched Savings Programs.” An essential part of program setup is coordinating with different levels and departments of government on asset rules for means-tested programs so as to ensure that asset limits on income-assistance eligibility are not a disincentive to participate. 95 95 Leckie et al., “Final Report,” 103; see also Elliot, “IDA Accessibility,” 1–2. It will be difficult to convince a low-income household to sign up for a matched savings program if they believe it could jeopardize their existing benefits.
In addition to the promising results of learn$ave, evidence from other matched savings programs suggests that these programs are effective for building savings habits. In one of the relatively few studies of IDA participants’ longer-term savings outcomes, Loibl et al. found that after controlling for other variables, IDA program completion was a significant predictor of household saving and had a long-term effect on asset accumulation after the program ended, leading the researchers to conclude that “successful IDA program completion may improve the financial dispositions and behaviors associated with long-term savings.” 96 96 Loibl et al., “More than a Penny Saved,” 122. Another study of IDAs found that participants showed stronger habits of saving than comparable non-participants; this habit strength grew over time to peak at nineteen to twenty-four months, approximately the length of most IDA programs. 97 97 Loibl, Kraybill, and DeMay, “Accounting for the Role of Habit in Regular Saving.” American Dream Demonstration participants have also reported in qualitative interviews that the program helped them develop a saving habit. 98 98 Sherraden and McBride, Striving to Save. In the second Saving Gateway pilot, a large majority (71 percent) of account holders made net deposits in at least sixteen of the program’s eighteen months, and three in five (61 percent) saved enough to earn the maximum government match (two-thirds of whom continued to save even after reaching the limit). 99 99 Harvey et al., “Final Evaluation,” 5.
Even small-scale programs run by private non-profit organizations have experienced great success with matched savings programs. Participants in SEED Winnipeg’s Saving Circle experienced a statistically significant increase in money management and budgeting, among other financial behaviours; financial literacy increased as well. 100 100 Proactive Information Services, “Matched Savings Programs,” iii. Participants in both the Saving Circle and SEED’s IDA programs reported that they continued to practice the financial habits (saving, money management) they learned after cash-out and had increased confidence managing their money. 101 101 Proactive Information Services, “Matched Savings Programs,” iv. Momentum surveyed graduates of its matched savings program and found that 92 percent of respondents continued to save after exiting the program, 72 percent had emergency savings of at least $500, and 77 percent contributed to a registered savings account. 102 102 Momentum, “The Impact of Matched Savings.” Almost all (97 percent) responding alumni of Momentum’s Fair Gains program, which helps low-income youth save for post-secondary education, said they still save money every month; 86 percent of alumni reported that their financial situation had improved since they took the program, and 86 percent said they felt confident to deal with a financial emergency. 103 103 Momentum, “Investing in Youth.”
Alumni of more intensive matched savings programs have cited social support from program staff and other participants as one of the most important non-financial factors contributing to their saving success. Graduates of SEED’s matched savings programs, for example, reported that a major strength of the program was the opportunity to work toward their saving goal in a group, the other members of which were in a similar situation and faced the same financial barriers. 104 104 Proactive Information Services, “Matched Savings Programs,” 26. Participants valued the money-management training not just for the skills and habits they learned but also for the social support it provided. Through the training sessions, participants had the opportunity to make friends with others who faced similar barriers and challenges related to living in poverty. 105 105 Proactive Information Services, “Matched Savings Programs,” 32–33. American IDA research has also found that social and psychological factors, not just economic factors, matter when it comes to saving success. 106 106 Sherraden, “Innovations in Asset Building,” 198.
Even the most intensive, IDA-style matched savings programs offer opportunities for cost savings and cost sharing. The combination of private deposits and public match credits leverages participants’ own capital and government investment, stretching both public and private dollars. Depending on the program, administrative costs may be lower, because the accounts are administered through private financial institutions. The free-rider effect that can occur in many social-assistance programs may be reduced in a matched savings system, since a private contribution is required to trigger a public contribution. There may be more opportunities for employers or private third parties to participate in the program given the shared risk and lower administrative cost. 107 107 Leckie et al., “Final Report,” 3. Indeed, many IDAs operate as public-private partnerships: governments develop the structure of the programs, non-profit organizations deliver the programs, and banks or credit unions hold participants’ deposits; funding is provided by both government and private sources. 108 108 Loibl et al., “More than a Penny Saved,” 100. Expanding the role of financial institutions in order to streamline the delivery of matched savings programs may be an opportunity for efficiency gains. 109 109 Voyer, “Impacts of a Matched Saving Program.” Banks and credit unions would not incur any extra expenses, since governments would use gambling profits to cover program costs. 110 110 Leckie et al., “Final Report,” 44.
The government could reduce costs associated with the high-touch elements of the program by working with organizations that are already embedded in and have built high-touch relationships with their clients and communities, such as tax-filing volunteers, debt counsellors, and financial-assistance programs run by faith-based communities. IDA participants have stated in interviews and focus groups that it was the financial incentive that drew them to apply for the program, but it was the personal support they received that enabled them to succeed. 111 111 Leckie et al., “Final Report,” 13. Since this personalized support is both important and expensive, high-touch (and therefore high-cost) services should be carefully targeted to where they will have the greatest impact. 112 112 Leckie et al., “Final Report,” 45.
Policy-makers could likewise reduce costs by taking advantage of existing administrative structures. If eligibility for future IDA programs were tied to existing means-tested programs with their own administrative databases, it might be possible to substantially reduce costs associated with recruitment, verification of eligibility, and enrolment. 113 113 Leckie et al., “Final Report,” 101–2. Targeted recruitment may help reduce windfall gains. 114 114 For example, Rablen, “The Saving Gateway,” finds that the Saving Gateway program would be effective at increasing assets for credit-constrained agents, but not for those with access to credit.
Streamlining or eliminating the financial-management curriculum is another way to lower costs. One of the somewhat surprising findings of the learn$ave demonstration was that financial-management training had only a small incremental impact on savings outcomes, though participants expressed appreciation for the training. The program evaluation suggests several potential reasons for this result. The act of saving itself—as incentivized by the matching credits—may have been more important than learning about saving. 115 115 Leckie et al., “Final Report,” 105. Participants may have already been familiar with the content (many had fairly high levels of education). The training might have been effective for the very people who did not or could not apply. Participants might not have been able to apply the lessons they learned to their everyday financial lives due to economic hardship—institutional barriers rather than lack of knowledge may be more important in shaping saving behaviour. 116 116 Leckie et al., “Final Report,” 75. Moreover, while IDAs and other programs that include financial-management training often assume that low-income households have lower financial literacy and are less skilled at practices like budgeting, they may in fact be more skilled than are middle- and higher-income households. 117 117 Loibl et al., “More than a Penny Saved,” 119; SEDI, “Financial Capability and Poverty,” 6.
Despite these cost-saving opportunities, however, intensive matched savings programs tend to be quite expensive to administer. The high costs of getting participants started on the program—recruitment challenges are common, and verifying applicants’ eligibility is a labour-intensive (and thus expensive) process—mean fewer funds end up in participants’ pockets. 118 118 See Leckie, Dowie, and Gyorfi-Dyke, “Early Impacts,” 21. The cash-out process and assistance provided to participants throughout the program also drive up costs. American IDAs, for example, were found to cost $64 per participant per month to administer (i.e., excluding the cost of the match), much more than other major savings products such as 401(k)s. 119 119 Boshara, “Individual Development Accounts.” Feedback from IDA alumni suggests that high-cost services are essential to the program—participants express appreciation for the personalized support, so eliminating the extra services to administer the program through the tax system would likely reduce its effectiveness.
High costs were a significant finding of the learn$ave demonstration: “The estimated cost per additional person prompted to enrol in an education program by learn$ave matched saving credits and services would be fairly high—around $38,000, at best.” 120 120 Leckie et al., “Final Report,” 105. The authors note that learn$ave’s per-person price tag appears more reasonable when you consider the corresponding benefits over the long term: a thirty-three-year-old who enrols in additional education as a result of participating in the program needs to experience an earnings boost of only $2,400 per year over the rest of his or her career to cover this cost. The most expensive activities were recruiting participants, processing withdrawals, and case-management services (particularly for learn$ave-plus participants). 121 121 Leckie et al., “Final Report,” 94. However, the main reason the cost is so high is windfall gains—outcomes from the control group showed that the program funded many who would have enrolled in education without the added funds they accumulated through the program. 122 122 Leckie et al., “Final Report,” 105. Windfall gains are a common policy challenge, since participants in many publicly funded programs self-select: “The most motivated participate and benefit when they might have succeeded on their own without the program.” 123 123 Leckie et al., “Final Report,” 3. The total cost of the learn$ave demonstration was $30 million. 124 124 SEDI, “Financial Empowerment,” 6. Even if running a similar matched savings program did not involve any cost savings, provinces’ annual gambling profits run into the hundreds of millions (surpassing $1 billion in several provinces) and would provide ample revenue for a very substantial expansion of the program.
Critics have also raised questions about matched savings programs’ effectiveness at alleviating poverty. As discussed above, the government’s existing low-touch matched savings programs are underused by poorer Canadians. But high-touch, IDA-style programs do not appeal equally to all eligible low-income families—learn$ave participants were younger, had higher levels of formal education, were more likely to be single, were more likely to be employed, had higher incomes, and were more likely to have recently immigrated to Canada. 125 125 Kingwell et al., “Helping People Help Themselves,” 17–19. This is consistent with other IDA and matched savings programs, which have found those with higher levels of education are disproportionately attracted to the program (and are more likely to complete it). 126 126 Loibl et al., “More than a Penny Saved,” 106; Harvey et al., “Final Evaluation,” 3, 137. These findings suggest a new matched savings program might leave some behind, including those who could most benefit from it. IDAs have also been criticized for not paying enough attention to the structural causes of poverty. 127 127 Elliot, “IDA Accessibility”; Feldman, “Saving from Poverty.”
Many participants are unsuccessful at saving. High dropout rates are common in IDAs: almost half (48 percent) of American Dream Demonstration participants were classified as non-savers (they saved nothing or less than $100). 128 128 Feldman, “Saving from Poverty,” 189; Loibl et al., “More than a Penny Saved,” 101. For those participants who do save, it is unclear whether they actually decrease consumption to meet their saving goals. 129 129 Most participants in the Saving Gateway pilot, for example, reported that their contributions did not come from existing savings. At the same time, however, most participants did not report cutting back their spending to finance their contributions, raising questions about where the money for deposits came from. There was, however, a significant link between participation in the program and a reduction in spending on food consumed outside the home (i.e., eating out) among certain participants, namely, the lower-income group and those in rented accommodation. Harvey et al., “Final Evaluation,” 6. Saving in the program does not necessarily prepare participants for other kinds of saving available outside the program, where the return on deposits will be much lower and financial coaching is less readily available. In the Saving Gateway evaluation, for example, participants wondered whether the match rate was the best way to build a saving habit that would persist after the program ended. They noted that the matching credits were quite different from and substantially higher than interest rates that would be available for conventional saving products. 130 130 Harvey et al., “Final Evaluation,” 5.
Evidence is mixed at best as to whether IDAs have a significant impact on asset accumulation or net worth in the long term. 131 131 Feldman, “Saving from Poverty,” 190–91. Though Loibl et al. found a positive association between program completion and household saving, the report also notes that it can’t determine causality: it may be that people who were already savers were more likely to complete the program. 132 132 Loibl et al., “More than a Penny Saved,” 117. There is no statistically significant evidence of any link between participation in Saving Gateway—in which participants did not have to cash out their matched credits by the end of the program—and increased net worth. 133 133 Harvey et al., “Final Evaluation,” 7. At least two follow-up studies of matched savings programs did not find any relationship between program participation and saving. 134 134 Rothwell and Sultana, “Cash-Flow and Savings Practices of Low Income Households”; Tucker, Key, and Grinstein-Weiss, “The Benefits of Saving at Tax Time”; see also Feldman, “Saving from Poverty,” 189. Yet it is important to note the influence of program design on evaluations of net worth. The relatively short time frame of many IDAs and the requirement that participants cash out their savings mean that the long-term impact of the investment purchased through the program will likely not be evident until months if not years after the program’s end. For instance, learn$ave was expected to increase earnings in the long term, but researchers expected that these results, if they were to emerge, could not be observed by the fifty-four-month mark (which turned out to be true). 135 135 Leckie et al., “Final Report,” 87. Moreover, IDAs are premised on the assumption that the act of saving itself, rather than just the assets accumulated through saving, benefits the saver. Indeed, research suggests that the habit of saving is linked to improved feelings of accomplishment, financial control, independence, and security, as well as higher levels of perceived financial well-being. 136 136 Leckie et al., “Final Report,” 4; Loibl, Kraybill, and DeMay, “Accounting for the Role of Habit in Regular Saving,” 590; Consumer Financial Protection Bureau, “Perceived Financial Preparedness, Saving Habits, and Financial Security”; Consumer Financial Protection Bureau, “Financial Well-Being in America.”
Conclusion
A matched savings program for low-income Canadians is one way to get gambling money out of provincial coffers and (back) into the bank accounts of the poor. Implementing such a program would not be without challenges, as the issues outlined in the previous section make clear. Nevertheless, there are several important advantages to using gambling profits to help low-income families build assets rather than using these funds to supplement income transfers. First, it helps fill the policy gap related to low-income savings incentives described above. Second, this approach avoids the problem of earmarked funds becoming expected funds—casino and lottery profits are a more volatile, less reliable source of provincial revenue than taxes, and an unexpected shortfall could be devastating for those who have razor-thin margins in their household budget and rely on government benefits to pay their monthly bills. If gambling profits fall, providers may not be able to offer matched savings accounts to as many clients or at as high a match rate that year, but no family will find their expected supply of income cut back.
A third, related advantage of the matched savings option is that, because it does not touch the existing income transfers and benefits system, the government is less likely to be tempted to avoid meaningful gambling reform by cutting expenses elsewhere. One of the dangers we hope to avoid is mere cosmetic tweaks that render pointless the very structural transformation of gambling finances that this report urges. If policy-makers put gambling profits in a separate poverty-alleviation fund, but then decrease the amount spent on poverty alleviation from the consolidated revenue fund, nothing will have changed. The government may have moved some money around, but it is still using gambling money to fund its core services. Adopting a matched savings approach would not eliminate this possibility, of course. But real change is possible: governments currently spend relatively little on asset-building for low-income families (compared to income transfers), and the community organizations and financial institutions delivering the matched savings programs would likely welcome an investment in their program, or at the very least have significant learnings to share and potential support to offer.
Option 3: Help build emergency funds by offering prize-linked savings
The government could also use gambling profits to fund a prize-linked-savings (PLS) initiative. PLS programs are offered by both governments and financial institutions in a variety of forms, but all encourage saving by offering participants the chance to win. In a PLS system, the money that would normally be paid separately to each participating savings account as fixed interest is pooled into a single prize fund; instead of earning regular interest, every participating saver has a chance to win. As with a traditional lottery, participants have the chance to hit the jackpot, but every PLS account holder keeps their deposits—the interest is awarded randomly, but the principal is never lost. 137 137 Some PLS products also include guaranteed interest in addition to the prize pool.
Though relatively little-used in Canada, PLS programs are quite popular worldwide. From bank accounts featuring the chance to win a car in Brazil, to prize bonds in Ireland or Denmark, to the “multimillionaire” accounts offered by Pakistani banks, to the Kenya Post Office Savings Bank’s premium bonds, to the special draws for a Mercedes at Oman International Bank, the opportunity to win big has inspired savers across the globe. 138 138 Kearney et al., “Making Savers Winners,” 31–32. This paper will focus on three different PLS programs available in jurisdictions similar to Canada—namely, the United States and the United Kingdom.
In the past decade or so, PLS programs have become a major initiative among American credit unions. Save To Win, the largest of these programs, has seen great success across the United States since its launch by Michigan credit unions and the non-profit Commonwealth (formerly Doorway to Dreams or D2D Fund) in 2009. With only a small deposit of $25, members can open a twelve-month share certificate and earn entries into drawings for prizes, which usually range from $25 to $5,000. Every $25 deposited earns account holders an additional entry into the prize draw, up to a maximum of ten entries each month. 139 139 Save To Win, “Frequently Asked Questions”; Michigan Credit Union League, “Save To Win.” Organizations advocating for improving Americans’ financial security convinced Congress of the policy potential of PLS programs, leading to the passage of the American Savings Promotion Act with broad support in December 2014. 140 140 Cole, Iverson, and Tufano, “Can Gambling Increase Savings?,” 2. This legislation enabled PLS products at the federal level in the United States, paving the way for authorizing legislation at the state level and an expansion of PLS. At time of writing, thirty-three states allowed PLS. 141 141 Commonwealth, “Prize-Linked Savings Policy.”
More recently, American retail giant Walmart introduced PLS to millions of Americans through its highly successful MoneyCard Vault. Customers with a Walmart MoneyCard, a prepaid debit card, can transfer a portion of their balance into the Vault, a free savings feature from which funds cannot be spent directly. Every dollar saved in the MoneyCard Vault earns the saver an entry in the month’s prize drawing, up to a maximum of five hundred entries. There are 1,000 prizes to be won each month: 999 prizes worth $25 each, and one $1,000 grand prize. 142 142 Walmart, “Walmart and Green Dot Unveil First National Prize-Linked Savings Program”; Walmart, “Two Years Later”; Walmart, “Walmart MoneyCard Prize Savings Sweepstakes.” If someone has more than $500 in the Vault, they will still earn only five hundred entries, based on a calculation of average daily balance. This feature prevents cardholders with very large Vault balances receiving a disproportionate share of entries in each draw. In spring 2020, Walmart encouraged MoneyCard holders to deposit their pandemic stimulus checks directly into their Vault, offering waived maintenance fees and quick access. 143 143 PYMNTS, “Walmart to Customers.”
Among the largest and most popular national PLS products are Premium Bonds, offered by Britain’s National Savings and Investments, a government department and Executive Agency of the Chancellor of the Exchequer. The program’s history stretches back to UK “Million Adventure” of 1694, which Britain developed to manage its debt from the Nine Years’ War of 1689–1697. A total of 100,000 tickets, sold at £10 apiece, offered their holders £1 each year until 1710. A small percentage of the tickets would win their holders between £10 and £1,000 each year for those sixteen years. 144 144 Watson, “Save Now, Win Later,” 913; Kearney et al., “Making Savers Winners,” 9–12. The current Premium Bonds program officially launched in 1956 to curb inflation and encourage saving in the aftermath of World War II. On the first day of the program alone, eager investors bought £5 million worth of bonds (nearly $218 million in 2020 Canadian dollars). 145 145 National Savings and Investments, “Our Story.” Today, customers can buy prize-linked Premium Bonds from National Savings and Investments for £1 each. The annual prize fund interest rate is 1.40 percent; instead of earning this interest on their bonds directly, buyers have a shot at winning between £25 and £1 million in tax-free prizes each month. Every bond number gets a separate entry in the draw, an incentive to save more. 146 146 National Savings and Investments, “Premium Bonds.”
Policy benefits and disadvantages
PLS programs have proved popular among customers. Credit union members saved almost $200 million—and were awarded $3 million in prizes—in Save To Win’s first decade of operation. Since 2009, the program has expanded from eight credit unions in Michigan to 127 credit unions in sixteen states, with an additional 107 credit unions in nine other states introducing their own versions of PLS products; over 110,000 cumulative individual PLS accounts have been opened, and the average member saved over $2,000. 147 147 Michigan Credit Union League, “Save To Win”; Commonwealth, “Prize Linked Savings in Credit Unions: 2019.” Walmart customers moved more than $2 billion through the MoneyCard Vault after the program’s launch in August 2016. 148 148 Walmart, “Two Years Later.” Premium Bonds are immensely popular in the UK: twenty-one million Britons—almost a third of the country’s population—had nearly £80 million (CA$137 million) invested in these bonds at the start of 2019. 149 149 Barker, “Premium Bonds.” The Million-a-Month Account (MaMa), a PLS program offered by First National Bank in South Africa, was another hugely popular product. Within 18 months of the program’s launch, PLS accounts outnumbered the bank’s regular saving accounts. 150 150 Cole, Iverson, and Tufano, “Can Gambling Increase Savings?,” 3. In fact, evidence from several lab-based experiments suggests that PLS products encourage individuals to save at a higher rate than do accounts offering standard interest. 151 151 Filiz-Ozbay et al., “Do Lottery Payments Induce Savings Behavior?”; Atalay et al., “Saving and Prize-Linked Savings Accounts.”
Studies of PLS products have consistently found that PLS is particularly appealing to low-income savers. Among PLS account holders in American credit unions, 85–93 percent were classified as financially vulnerable: “not regular savers, asset poor, low to moderate income, had high debt, or had no emergency savings.” 152 152 Commonwealth, “Prize-Linked Savings in Credit Unions in 2018.” The relative appeal of Premium Bonds is strongest among lower-income households. 153 153 Kearney et al., “Making Savers Winners,” 12. Tufano, De Neve, and Maynard surveyed Walmart customers and found that respondents with less than $2,000 in assets were two and a half times more likely to express interest in PLS programs than those with $50,000 or more. 154 154 Tufano, De Neve, and Maynard, “U.S. Consumer Demand for Prize-linked Savings,” 117. In an online lab experiment, Atalay et al. found that the introduction of PLS increased total saving and that the result was stronger among participants with the lowest reported income. 155 155 Atalay et al., “Savings and Prize-Linked Savings Accounts.” The strong appeal of PLS among lower-income savers may be related to the low return these savers can expect from conventional interest, particularly if the account is intended to serve as an emergency fund. Compound interest can yield a significant return over time, but those with constrained incomes are likely to have smaller balances and need more liquidity in their savings. 156 156 Tufano, “Saving Whilst Gambling,” 322; Kearney et al., “Making Savers Winners,” 5. Regular interest would provide little more than pocket change for a low-income single mother who’s able to accumulate only $1,000 and needs to withdraw most of it for an emergency car repair after six months. Losing the few dollars she would earn by putting her money in a standard savings account won’t have a noticeable impact on her standard of living. Winning a $1,000 prize, in contrast, would significantly improve her financial situation.
PLS can also help non-savers develop a saving habit. Evidence suggests that PLS products are attractive to those who report low to nonexistent rates of formal saving. 157 157 See, e.g., Kearney et al., “Making Savers Winners,” 18; Cole, Iverson, and Tufano, “Can Gambling Increase Savings?”, 2; Doorway to Dreams Fund, “A Winning Proposition.” The survey conducted by Tufano, De Neve, and Maynard, for instance, found that those without regular savings plans were 70 percent more likely to express interest in PLS. 158 158 Tufano, De Neve, and Maynard, “U.S. Consumer Demand for Prize-Linked Savings,” 117. In Atalay et al.’s experiment, the increase in saving observed after the introduction of PLS was stronger among participants with the lowest reported savings. 159 159 Atalay et al., “Saving and Prize-Linked Savings Accounts.” Another lab experiment, conducted by Filiz-Ozbay et al., found evidence that the appeal of PLS was strongest among those with low bank-account balances. 160 160 Filiz-Ozbay et al., “Do Lottery Payments Induce Savings Behavior? Evidence from the Lab,” 17. A survey of participants in WINcentive, a PLS account offered by the Minnesota Credit Union Network, found that one-third (33 percent) did not save before opening their WINcentive account. The majority (57 percent) of these non-savers said they now save a fixed amount regularly; only 8 percent reported that they still do not save. 161 161 Commonwealth, “WINcentive Savings 2019,” 7. Given their appeal to non-savers, many PLS products are designed to encourage savers to start small and contribute what they can. The minimum Premium Bond investment is £25 (CA$44), manageable even for those with constrained incomes. 162 162 National Savings and Investments, “Premium Bonds.” Opening a WINcentive account requires just $5. Savers earn an entry into the monthly, quarterly, and yearly prize draws with each $25 deposit and can earn up to four entries each month. 163 163 Commonwealth, “WINcentive Savings 2019 Report,” 3. Customers who took advantage of the WINcentive option generally saved more than their comparable counterparts who didn’t use the program. 164 164 Pew Charitable Trusts, “Can Contests Help Fill Americans’ Savings Gap?”
It can be difficult to discern whether observed saving in PLS is genuinely new saving or simply moving accounts from one form of saving to another (i.e., cannibalizing existing saving), but evidence so far points to saving in PLS as new saving. High rollover levels—account holders reopening their certificates of deposit after the original twelve-month term ends—also point to the potential of PLS products to incentivize long-term saving. 165 165 Watford, “Save Now, Win Later,” 911. Indeed, the introduction of PLS may encourage other kinds of saving as well. At least two recent studies have found that offering PLS increases saving in both PLS and conventional savings accounts. Cole, Iverson, and Tufano’s analysis of account-level data on First National Bank’s MaMa program supports this result: “We do not see any evidence that the MaMa program cannibalized savings, and instead find the reverse: branches with higher MaMa usage also saw expansion of regular savings, and individuals who opened MaMa accounts typically increased their balances in standard savings accounts. Evidence from the random awarding of prizes suggest that these relationships may be causal.” 166 166 Cole, Iverson, and Tufano, “Can Gambling Increase Savings?,” 37. Similarly, Jindapon, Sujarittanonta, and Viriyavipart find that the introduction of PLS increases saving in both PLS and traditional savings (TS) vehicles: “When subjects are allowed to save in a PLS account in addition to a TS account, most of them choose to save in both. Most importantly, their total savings increase.” 167 167 Jindapon, Sujarittanonta, and Viriyavipart, “Prize-Linked Savings Games.”
Importantly, researchers have found evidence that PLS is appealing to lottery players and that at least some of the new saving in these accounts comes from a reduction in lottery spending. PLS does not cannibalize other forms of saving, but acts as a partial substitute for gambling—a substitute, importantly, that builds personal assets rather than state revenues. Tufano, De Neve, and Maynard found that respondents who reported spending at least $100 on lottery and gambling activity in the past six months were almost three times more likely to show interest in PLS than those who had spent less than $100. 168 168 Tufano, De Neve, and Maynard, “U.S. Consumer Demand for Prize-Linked Savings,” 117. Atalay et al. found in a lab experiment that the introduction of PLS incited participants to increase their saving by cutting back on spending, including lottery spending: “The introduction of PLS indeed increases total savings quite dramatically (on average by 12% points), and [the] demand for the PLS account comes from reductions in lottery expenditures as well as current consumption. Hence PLS leads to genuinely new savings, and even generates new savers.” 169 169 Atalay et al., “Saving and Prize-Linked Savings Accounts,” 100. Outside lab settings, Cole, Iverson, and Tufano used MaMa account data to demonstrate that “PLS participants tend to significantly increase overall savings rates and that at least some of this increase in net savings comes from reduced lottery play.” 170 170 Cole, Iverson, and Tufano, “Can Gambling Increase Savings?,” 2. Cookson analyzed data from casino cash withdrawals to study the effect of the introduction of PLS to Nebraska on casino-gambling expenditures. He finds that “PLS substitutes strongly for gambling” and that “the introduction of savings lotteries reduces the amount of casino gambling. That is, households’ newfound opportunity to gamble while saving in STW [Save To Win] accounts is a strong substitute for gambling at commercial casinos. . . . individuals who were exposed to savings lotteries were 15 percentage points less likely to visit the casino in the post period.” 171 171 Cookson, “When Saving Is Gambling,” 1–2. The substitution effect is much stronger among gamblers who display evidence of greater self-control. Those with low self-control do not change their spending in response to the introduction of PLS.
It is possible that this substitution effect could be amplified if saving in a PLS account were as easy as buying a lottery ticket. Lottery tickets can be found behind every convenience- and grocery-store counter—why shouldn’t savings opportunities be equally ubiquitous? Commonwealth (formerly D2D Fund) has proposed taking advantage of the lottery’s existing footprint and infrastructure to sell savings tickets. It conducted a market-research survey and found strong interest in such a product, with appeal widespread across diverse demographic groups. 172 172 Doorway to Dreams Fund, “A Winning Proposition.” Holmes likewise recommends explicitly marketing PLS as an alternative to the lottery to encourage substitution for lottery expenditure. Credit unions could take advantage of the lottery’s reach by “[selling] scratch-off tickets behind the counter at convenience stores. Each ticket would yield a prize (varying, perhaps, from $5 to $25) that the bearer could use as an initial deposit in a new PLS account.” 173 173 Holmes, “Prize-Linked Savings,” 15; see also Doorway to Dreams Fund, “A Winning Proposition.”
Like IDAs, PLS products can promote financial inclusion since they serve people who are less likely to use formal savings products. 174 174 Commonwealth, “Prize-Linked Savings in Credit Unions in 2018”; Kearney et al., “Making Savers Winners”; Commonwealth, “Walmart MoneyCard Prize Saving”; Cole, Iverson, and Tufano, “Can Gambling Increase Savings?” Commonwealth’s report on PLS at credit unions noted that many of those who opened PLS accounts had never used a formal savings product before. In fact, up to 19 percent of PLS account holders cited the PLS product as the reason they joined their credit union. Between three-fifths and four-fifths (60–78 percent) of PLS account holders said that building their savings would make them more likely to use their credit union’s other financial products. 175 175 Commonwealth, “Prize-Linked Savings in Credit Unions in 2018.” Walmart’s MoneyCard Vault—on a prepaid card offered not by a bank or credit union, but by a retailer—is America’s largest single PLS program. 176 176 Commonwealth, “The State of Prize-Linked Savings.” Prepaid cards are common among unbanked and underbanked populations who are excluded from or do not feel comfortable accessing mainstream financial institutions. 177 177 Commonwealth, “Walmart MoneyCard Prize Savings: One Year Anniversary Brief.” Though the unbanked are a lower proportion of the population in Canada than in the United States, 178 178 Demirguc-Kunt et al., “Global Findex Database 2014,” 83–84. prepaid cards are a growing market in Canada, particularly among younger Canadians and those making under $40,000 a year. 179 179 Canada Prepaid Providers Organization, “Canadian Open-Loop Prepaid Market is Growing”; Canadian Prepaid Providers Organization, “How Canadians Pay Today.” Increasing financial inclusion for unbanked and underbanked people not only improves their financial security but also benefits society as a whole since their funds are no longer stashed under a mattress but are at work in the economy. 180 180 See Dubner and Lam, “Is America Ready.”
Unlike IDAs, however, there is a solid business case to be made for financial institutions to offer PLS products. A PLS account is cheaper and easier to administer than an IDA, which is a strong selling point for both businesses and policy-makers. 181 181 Kearney et al., “Making Savers Winners,” 2–6. Unlike a matched savings account, the financial incentive that attracts customers to a PLS product does not impose substantial additional costs on the financial institutions that offer it, since what they pay in prizes is no more than what they would otherwise be paying in guaranteed interest. 182 182 Holmes, “Prize-Linked Savings,” 6–7. These products would be easy to explain to potential customers, since everyone knows what a lottery is and how it works; easy to produce, since no complex investment management is needed; and easy to keep liquid, since those who withdraw their funds can simply have their total entries reduced (as long as they maintain some balance). 183 183 Kearney et al., “Making Savers Winners,” 6. As decades of lottery marketing have made clear, winners are a great promotion opportunity. 184 184 Walker, “How to Trick People into Saving Money.” Cole, Iverson, and Tufano demonstrate that prize-winning affects the saving behaviour of both winners and witnesses: those who won a MaMa prize tended to substantially increase their account balance (sometimes by even more than the value of their prize), and a branch that awarded a large prize would experience a surge in demand for the PLS product in the month that followed. 185 185 Cole, Iverson, and Tufano, “Can Gambling Increase Savings?,” 38.
It is nevertheless important to remember that PLS is not a panacea for low-income households’ financial security. The evidence on whether using PLS reliably builds good financial habits remains somewhat limited. Though survey research and lab experiments have yielded promising results, systematic empirical research demonstrating the long-term impact of PLS participation on savings habits and financial inclusion is currently unavailable. 186 186 Kowalski, “Prize-Linked Savings Products,” 139. Nor has every study been equally promising. One 2019 study examined whether prize-linked incentives were effective at helping borrowers reduce their debt burdens and found that “prize-linked incentives may simply attract individuals who are already more likely to repay their debts, and not causally change behavior.” 187 187 Burke, “Can Prize-Linked Incentives Promote Debt Reduction.” In addition, although many PLS programs have been designed with low-income savers in mind, the ability to increase one’s odds of winning by increasing one’s savings account balance can have a regressive effect that disadvantages those at the bottom of the income distribution. Lowest-income participants, who have the least disposable income to contribute, may have the lowest chance of winning a prize, since they can’t purchase as many entries into the draw as their higher-income counterparts. 188 188 Holmes, “Prize-Linked Savings.” However, many PLS programs, including Save To Win and WINcentive, do limit the number of entries that account holders can earn each month, providing an incentive to save more while still keeping the playing field relatively level for those with more constrained incomes. Moreover, a regressive effect on one’s chance of winning is still an improvement over the regressive effect of taxation under the current lottery system.
The provinces’ monopoly on gambling means that offering PLS products on a wide scale would require overcoming regulatory barriers. According to Canada’s Criminal Code, only provincial governments (or organizations granted provincial licenses, such as fairs or charities) can operate lotteries or other games of chance. A program meets the definition of an illegal lottery if it consists of three elements: a prize, chance, and “consideration”—that is, something of value that participants are required to provide in order to be eligible to win the prize. If a company wants to run a promotional contest in Canada featuring, say, a draw for a grand prize, it has to remove one of those three elements for its contest to be legal. This is why contest rules often require winners to answer a skill-testing question (making the contest a game of mixed chance and skill rather than a game of pure chance) and/or include the clause that there is “no purchase necessary” to win (removing the element of consideration). 189 189 Canada, Criminal Code, RSC 1985, c. C-34, s. 74.06; Canada, Criminal Code, RSC 1985, c. C-46, s. 206–207; Canadian Contest Law, “Contests.” Since a standard PLS product would include all three elements of a lottery—participation requires depositing money at the issuing institution, and winners of cash prizes are chosen by chance—an institution offering PLS products would have to use one of these openings to operate legally in Canada. In the PLS feature of savings app QUBER, for example, winners are required to answer a skill-testing question before they can claim their prize. 190 190 QUBER, “Terms and Conditions.” Removing these regulatory barriers would make it easier for financial institutions to offer PLS to their customers. Given the risks already involved in developing a new product, possible legal issues might discourage banks and credit unions from investing in a PLS program. Amending Canadian legislation to enable PLS may seem like a daunting task, but the American experience is promising. In 2014, the American Savings Promotion Act, which authorized financial institutions to offer PLS and exempted PLS products from lottery prohibitions in the federal criminal code, was passed with bipartisan support. 191 191 Rolland, “D2D Tests Innovations,” 3. One of the many advantages of PLS is that it appeals to politicians on both sides of the aisle: PLS programs are designed with the goal of helping low-income households get out of poverty, but through promoting responsible financial habits for individuals and enabling financial institutions to offer innovative, consumer-friendly products. 192 192 See Baxter, “Prize-Linked Savings Promotions.”
Yet bipartisan political support does not mean universal support, and the gambling industry may fight back if it senses competition invading their market. Despite—or perhaps because of—its widespread popularity, South Africa’s MaMa program lasted only three years. The government forced First National Bank to end the program after the South African Lottery Board sued to have it shut down as an illegal lottery. 193 193 Kearney et al., “Making Savers Winners,” 12–14. The gambling industry’s opposition to the program suggests that saving in PLS may have been, at the very least, perceived to be cannibalizing consumers’ lottery spending and as such represented a threat to the lottery’s bottom line. Given emerging evidence that consumers do reduce their gambling spending to save in PLS accounts, a Canadian PLS program could meet with similar opposition from the gambling industry, a risk likely to grow as the program expanded. On the other hand, the fact that Canada’s gambling sector is operated by provincial governments rather than private businesses may reduce this risk.
Nor is easing regulatory restrictions sufficient in itself to bring PLS to potential savers. Financial institutions need to be on board to offer PLS products and promote them to their customers. The American experience suggests that participation is not guaranteed. Michigan was one of the first states to pass PLS-enabling legislation, but four years after Save To Win was introduced, less than a fifth (17 percent) of the state’s credit-union members had access to the PLS program. Even though PLS was legal it was mostly unavailable, since relatively few people banked at institutions that offered Save To Win. 194 194 The Pew Charitable Trusts, “Can Contests Help Fill Americans’ Savings Gap?,” 2. Credit unions have been leading the way with PLS products in the United States, but that still puts PLS out of reach of most Americans, since most use banks and banks have been slow on the PLS uptake. 195 195 Commonwealth, “The State of Prize-Linked Savings.” Part of the problem is that lower-income people are by definition less profitable to financial institutions than high-income customers, who can be underwritten for mortgages and charged asset-management fees. For conventional banks, whose mandate requires making a profit for shareholders, focusing on these high-income customers may be more attractive than investing in small-dollar savings programs for those with few assets. 196 196 Walker, “How to Trick People into Saving Money.” PLS products may be more suited to credit unions with their non-profit mandate and focus on community development, or to fintech start-ups focused on innovation. The government could also use gambling proceeds to help innovative organizations cover the costs of getting new PLS programs off the ground.
Moreover, the availability of a PLS product does not guarantee mass enrollment. A study by the Pew Charitable Trusts found that take-up of PLS accounts at credit unions that offer them is relatively low: the typical credit union with a PLS product saw only 1.3 percent of its members open an account. 197 197 Pew Charitable Trusts, “Can Contests Help Fill Americans’ Savings Gap?” Another factor that may contribute to low take-up rates is the structure of Save To Win and WINcentive, both of which involve a fairly restrictive certificate of deposit with significant withdrawal restrictions. A more flexible, liquid savings account offered alongside or in place of a standard savings account might have much higher take-up. These low figures stand in stark contrast to the popularity and ubiquity of Premium Bonds in the United Kingdom. This may be due to the latter’s longer history: British PLS had a half-century head start on its American counterpart. 198 198 Save To Win was introduced in 2009, fifty-three years after the Premium Bond program was launched. Michigan Credit Union League, “Save To Win”; National Savings and Investments, “Our Story.” The postal system also gave Premium Bonds a competitive edge. Though National Savings and Investments discontinued post-office sales in 2015, distribution through a well-trafficked public institution made the Premium Bond program highly accessible for most of its history. 199 199 Hiscott, “Post Office to Stop Selling Premium Bonds”; Doorway to Dreams Fund, “A Winning Proposition,” 2. Since credit unions and fintech start-ups generally operate on a much smaller scale than banks—particularly in Canada, where five or six banks dominate the market—they may lack the reach needed to make PLS products widely available. If savings tickets were to be offered alongside lottery tickets, we recommend that the government work with existing ticket retailers (such as grocery and convenience stores) to ensure as broad a market as possible. Bringing lottery retailers on board makes good policy as well as good politics: for many of these retailers, the commissions they earn on lottery-ticket sales are an important source of revenue, and they are more likely to support a new PLS product if it contributes to rather than competes with their bottom line. In order to protect the business model of ticket retailers while keeping costs low for the financial institutions offering the new savings accounts, the government could pay commissions to retailers for selling savings tickets equal to the commissions paid for lottery tickets (using proceeds from its gambling fund, of course). Given the increasing popularity of both online banking and online shopping, savings tickets should be available online as well. 200 200 See, e.g., Statistics Canada, “One-Quarter of Canadian Businesses”; BNN Bloomberg, “76% of Canadians Now Bank Online or through an App, Poll Finds.”
Despite evidence that PLS deposits are financed at least in part by cutting back on gambling spending, PLS prizes will struggle to compete with the lottery’s large jackpots. Large prizes are key to PLS programs’ effectiveness. Though smaller, more frequent prizes are important to prevent program fatigue from the low likelihood of winning, research suggests that account holders are willing to accept lower small and medium prizes in exchange for larger jackpots. 201 201 See Guillén and Tschoegl, “Banking on Gambling,” 223; Pfiffelmann, “What Is the Optimal Design for Lottery-Linked Savings Programmes?,” 4870–71; Kowalski, “Prize-Linked Savings Products,” 139. This is consistent with gambling research demonstrating that large jackpots, rather than improved odds of winning, drive up participation. 202 202 Tufano, “Saving whilst Gambling,” 323–24. PLS prizes will never be as large as lottery prizes, however, since PLS participants keep their principal and issuers still need to cover administrative and other expenses. PLS programs may also be negatively affected by “jackpot fatigue”: among traditional lotteries, the size of jackpots required to create a surge in sales has been increasing as customers’ idea of a large jackpot grows ever bigger, which makes PLS prizes seem increasingly small and likely carries over to PLS prize fatigue. 203 203 Holmes, “Prize-Linked Savings,” 13. This challenge suggests that promoting PLS products to potential savers is another place where government could put gambling revenue to good use: lottery and casino profits could be used to fund marketing campaigns for new PLS products, both the new savings tickets at the convenience-store counter and the new products available at local credit unions.
Given our earlier arguments about the poor financial habits that gambling encourages, critics might reasonably question whether PLS products are simply gambling in another form. Should we be promoting a product that appeals to users because of (not even in spite of) their skewed perceptions? Should we be encouraging people to save by exploiting the same cognitive biases as the lottery does? 204 204 Filiz-Ozbay et al., “Do Lottery Payments Induce Savings Behavior? Evidence from the Lab,” 18. Lottery marketing takes advantage of and encourages availability bias—our tendency to overestimate the likelihood of something happening based on how easily we can envision it—by heavily advertising winners so that available information skews customers’ beliefs about the odds of winning. 205 205 See Doorway to Dreams Fund, “A Winning Proposition,” 5. What if PLS backfires, and winning prizes through the program (or seeing others win) makes savers more likely to overestimate their chance of winning the lottery? 206 206 Holmes, “Prize-Linked Savings,” 14. We believe, however, that PLS products are a viable step in the right direction when it comes to financial habits. 207 207 See also John, Butler, and Ross, “Boosting Economic Mobility Through Prize-Linked Savings.” Prize-linked saving is still saving. If non-savers are attracted to PLS by the same desire for risk that would otherwise be fulfilled with a lottery ticket, we consider that a win.
Conclusion
Prize-linked-savings products have their limitations, but they have strong potential as an innovative response to the savings challenge. Critics may point out that a PLS account is not the best place for someone to park his or her money—the magic of compound interest means investments, or even a standard savings account offering regular interest, would yield a greater return over time. We agree that PLS may not be the best option for large, long-term investments, such as retirement savings. They are, however, an excellent option as an emergency savings vehicle. The point of a rainy-day fund isn’t to grow through accumulated interest but to act as a buffer in case of an unexpected expense. Between low interest rates and the relatively small amounts saved—particularly in the case of low-income savers—the interest earned on emergency funds would amount to little more than pocket change; account holders are unlikely to notice a few extra dollars (or the lack thereof) a year. Compound interest is at best a weak incentive to save in these cases. 208 208 Kearney et al., “Making Savers Winners,” 5. Winning a thousand dollars, however, is quite another story. In our opinion, giving up an insignificant amount of regular interest payments for the chance to win a substantial prize makes good financial sense. Indeed, many PLS account holders are using their accounts to build emergency savings. When the Minnesota Credit Union Network surveyed participants in its PLS product WINcentive, a rainy-day fund was the most commonly cited savings goal—40 percent of respondents said they were building emergency savings. 209 209 Commonwealth, “WINcentive Savings 2019 Report,” 6.
Option 4: Increase problem-gambling funding out of provincial gambling corporations’ marketing budgets
Up to this point, the policy options we review in this paper have focused on helping the poor, since they bear a disproportionate share of the burden of state-run gambling. Our fourth and final policy suggestion aims to help the other group most harmed by gambling: problem gamblers. Recent research identifies around 0.6 percent of Canadians as problem gamblers, with an additional 2.7 percent identified as at-risk gamblers. 210 210 Williams et al., “Gambling and Problem Gambling in Canada in 2018.” Yet it is crucial to remember that these seemingly small figures conceal the broader impact of problem gambling on families and communities. Fully one in four Canadians (26 percent) report being personally affected by problem gambling—that is, they either have a close friend or family member struggling with this addiction or have gambling problems themselves. Of this group, nearly two in three (65 percent) say the problem gambler suffered a significant economic loss—such as losing a car or house or going heavily into debt—as a result of their gambling. 211 211 Angus Reid Institute, “Canadians Don’t Want to Roll the Dice.”
Though those classified as having a gambling problem make up a very small proportion of the population in any given province, they are responsible for a large share of gambling revenue. In Ontario, problem gamblers make up 1–2 percent of the population and contribute up to 24 percent of gambling revenue; in British Columbia, 4–5 percent contribute up to 26 percent; in Alberta, 2–3 percent contribute up to 50 percent; and in the Atlantic provinces, 1–2 percent contribute up to 30 percent (see Figure 7). 212 212 Williams and Volberg, “Gambling and Problem Gambling in Ontario”; British Columbia Provincial Health Officer, “Lower the Stakes”; Williams, Belanger, and Arthur, “Gambling in Alberta”; Williams and Wood, “What Proportion of Gambling Revenue.”

Yet the budgets of provincial gambling corporations suggest that provinces’ priorities are skewed heavily in favour of marketing—that is, encouraging people to gamble more—rather than prevention and treatment of problem gambling. In 2018, the Ontario Lottery and Gaming Corporation spent $282 million on marketing and promotion but only $64 million on problem-gambling prevention and treatment: $45 million was directed to the Ontario Ministry of Health and Long-Term Care, as per a policy that earmarks 2 percent of gross slot-machine revenue for problem gambling, and $19 million was devoted to its own Responsible Gambling program. 213 213 Ontario Lottery and Gaming, “OLG Annual Report 2017–18”; see also Dijkema and Lewis, “Pressing Its Luck.” Due to a change in financial reporting practices, these figures were not available for 2018–19 or 2019–20, the most recent reports available at time of writing. In other words, Ontario Lottery and Gaming is spending four and a half times as much on marketing as it does on gambling addictions. The same pattern is true in BC: the British Columbia Lottery Corporation dedicated just $5.6 million to responsible gambling strategies in 2019, but spent $26 million—nearly five times more—on advertising, marketing, and promotions. Put in context of these two corporations’ total annual revenues, Ontario Lottery and Gaming and British Columbia Lottery are spending on problem-gambling mitigation just 0.8 percent and 0.2 percent, respectively, of the money they make each year ($7.5 billion and $2.6 billion) (see Figures 8 through 11). 214 214 British Columbia Lottery Corporation, “2018/19 Annual Service Plan Report”; British Columbia Lottery Corporation, “Where the Money Goes.”
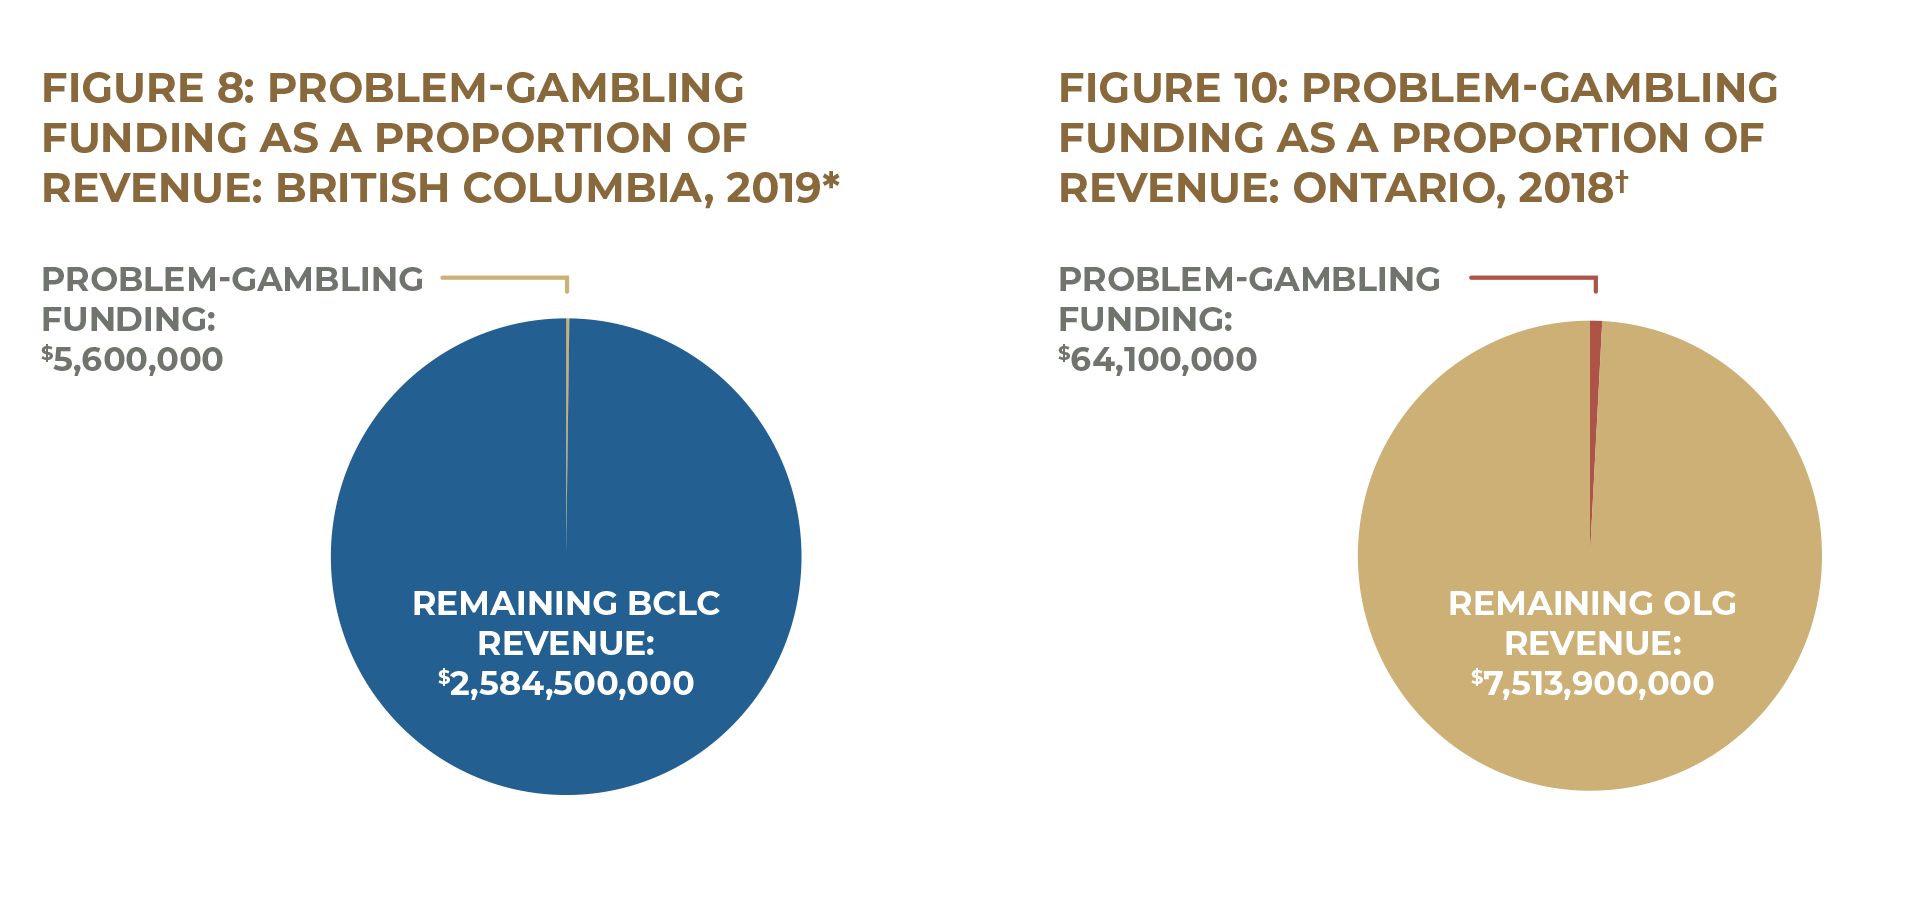
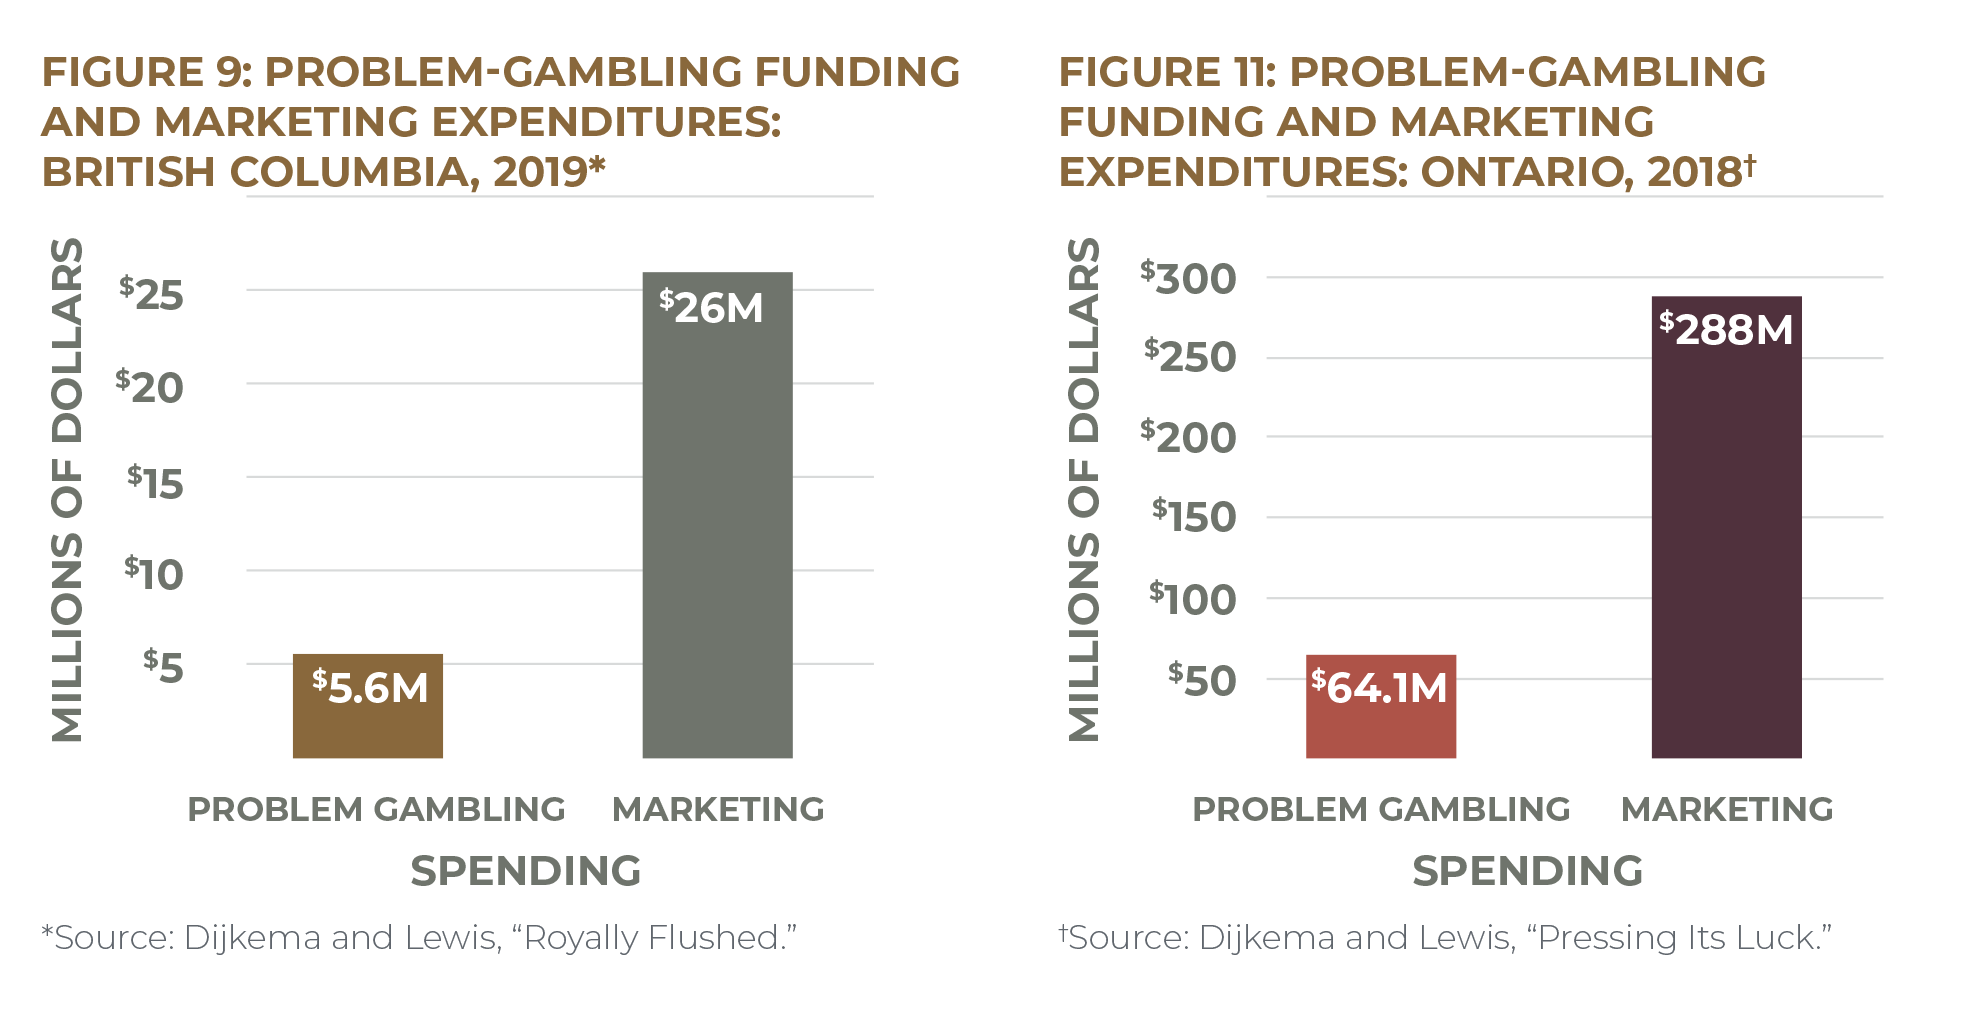
If the goal of provincial governments is to promote the well-being of its citizens more than boost its bottom line, these figures should at the very least be rebalanced. A reversal of this ratio would be ideal; better still would be cutting the marketing line from provincial gambling corporations’ budgets altogether. At minimum, policy-makers should mandate that Ontario Lottery and Gaming Corporation and British Columbia Lottery Corporation (and their counterparts in other provinces, for which marketing and problem-gambling expenditure data were not available) halve their advertising budgets and put the difference toward problem-gambling reduction initiatives so that these corporations spend at least as much on helping those who gamble too much as they do on convincing people to gamble more.
Policy benefits and disadvantages
The first and most obvious benefit of this policy is that it would provide more money for problem-gambling research, prevention, and treatment. As with poverty-reduction strategies, money is being used to help the groups disproportionately harmed by the expansion of gambling. Provinces could choose where to spend the money, based on provincial needs and priorities. Some of the funds could be dedicated to awareness and prevention. This could include educational campaigns to inform the public of the harms of gambling or boosting the capacity of provincial gambling corporations’ in-house responsible-gambling programs, such as Ontario Lottery and Gaming’s PlaySmart, British Columbia Lottery Corporation and Alberta Gaming, Liquor and Cannabis Corporation’s GameSense, or Atlantic Lottery Corporation’s PlayWise. Governments could allocate more funds to frontline services and treatment, including problem-gambling helplines, addiction counselling, and credit- and debt-counselling organizations. Prevention and treatment initiatives would be strengthened by investments in gambling research, providing resources on problem-gambling prevalence, demographic trends, risk factors, best practices for responsible gambling, and effective treatments. 215 215 Existing gambling research groups in Canada include the following: Gambling Research Exchange, Alberta Gambling Research Institute, the Gambling Research Lab at the University of Waterloo, the Centre for Gambling Research at UBC, and the International Centre for Youth Gambling Problems and High-Risk Behaviours at McGill University. Canadian organizations offering problem-gambling prevention and support include the Responsible Gambling Council, the Canadian Partnership for Responsible Gambling, the Centre for Addiction and Mental Health, provincial gambling helplines, Gamblers Anonymous, Gam-Anon, and GamTalk. Many non-profit organizations offer debt- and credit-counselling services, such as Credit Canada, Christians Against Poverty, the Ontario Association of Credit Counselling Services, Credit Counselling Canada, and the Credit Counselling Society.
Cutting back on advertising could also reduce governments’ intentional stimulation of demand for gambling. If the purpose of investing in advertising is to encourage people to gamble more than they would without exposure to the advertising, it follows that less advertising could lead to less gambling. (And if there turns out to be no reduction in gambling behaviour after significant cuts to the marketing line, it would seem that those dollars would have been better spent elsewhere.) Research evidence suggests that higher exposure to gambling advertising is associated with both greater intention to gamble in the future and increased gambling behaviour. That is, those exposed to more gambling ads tended to gamble more often and to spend more money when they did. 216 216 Ipsos MORI, “Final Synthesis Report”; Bouguettaya et al., “The Relationship Between Gambling Advertising and Gambling Attitudes, Intentions and Behaviours.” We agree that people who desire to gamble should have an outlet for it, and the best institution to ensure that gambling is safe and fair is the state. Yet there is no good reason for a state to try to increase the amount its citizens gamble, since there is no benefit apart from increased revenue and—as we have argued extensively in our earlier papers—collecting revenue in this way is unjust and predatory. 217 217 Dijkema and Lewis, “Pressing Its Luck”; see also Dijkema and Lewis, Royally Flushed. The duty to minimize harms rather than maximize revenue is the very reason we believe that the state, not private corporations, should run the province’s gambling industry—the bottom line for a business is profit, but the bottom line for a just government is the well-being of its people.
While cash-strapped provinces may protest any loss of revenue, less money to Canada’s gambling industry may not be a bad thing. Defenders of the gambling industry argue that casinos create jobs, but are these the best kinds of jobs for the state to be creating? Critics have countered that “most of the jobs created in gambling only substitute one for one (at best) for the jobs destroyed when expenditure switches from other activities.” 218 218 Henriksson and Lipsey, “Should Provinces Expand Gambling?” In a recent study, Marionneau and Nikkinen systematically reviewed the evidence on gambling’s impact on other industries. They find that the influence of gambling on local economies is mixed at best. While destination gambling (gambling used mainly by tourists, such as in Las Vegas or Atlantic City) can benefit nearby hospitality-related businesses or real estate, the impact of convenience gambling (gambling used mainly by locals) is mostly harmful to local economies. 219 219 Marionneau and Nikkinen, “Does Gambling Harm or Benefit Other Industries?” Most Canadian casinos extract virtually all of their revenue from local populations—often at the expense of other local businesses—rather than bringing in new money through tourism. 220 220 For example, Williams, Belanger, and Arthur, “Gambling in Alberta,” 93–94, examine Alberta tourism data and find that out-of-province visitors represent only a tiny proportion of patronage and revenue at Alberta casinos. As such, “almost all Albertan gambling revenue dollars represents money spent by Albertans.” In addition, the typical casino in Alberta derives nearly half (46 percent) of its revenue from people who live within five kilometres of it and almost three-quarters (73 percent) of its revenue from people who live within twenty kilometres. See also Williams, Rehm, and Stevens, “The Social and Economic Impacts of Gambling,” 38–41. Even Canadian casinos located near the border with the US draw most of their revenue from Canadians: Caesar’s Windsor and Ontario’s two Niagara casinos, the province’s largest border venues, collect only 35 percent and 3 percent of their revenue, respectively, from American patrons. 221 221 Ontario Lottery and Gaming, “Annual Report 2017–18,” 30. Rated US play figures represent “theoretical win contributed by U.S. carded patrons as a percentage of theoretical win contributed by all carded patrons. Theoretical win is based on probability theory, the intended win according to table games rule of play and slots payout schedule” and is not budgeted. Rated US play data were not published in OLG’s 2018–19 or 2019–20 annual reports, so 2017–18 figures are used.
It is also important to remember that when taxpayers stop spending money on gambling, that money does not disappear. It may be saved—and if these savings are deposited at a financial institution, the funds will be invested in other areas of the economy—or spent on other taxable activities. A comprehensive national report on gambling commissioned by the Australian government concluded that if gambling were scaled back, “some tax revenue would be lost. However, spending diverted from gambling would still be taxed, so the actual loss in revenue would not be equivalent to the apparent loss in revenue.” 222 222 Government of Australia, Productivity Commission, “Inquiry Report: Gambling,” 6.40.
Funnelling gambling dollars into the provincial treasury is an easy way for governments to get a quick infusion of cash, but is not a sustainable source of revenue in the long term. Encouraging Ontarians to gamble more just moves the province’s money around, circulating citizens’ dollars rather than directing them toward value-added production. 223 223 See, e.g., Baxter, “Why Expanding Casinos in Ontario Is a Big Gamble”; Frank, “Casinos a Lazy Way to Deal with Economic Issues”; see also Institute for American Values, “An American Declaration on Government and Gambling.” Gambling’s reliance on the appetite of local populations also raises the risk of diminishing returns as the consumer base loses interest. While the early years of gambling legalization saw the newly legal industry expand rapidly, the growth in provinces’ gambling revenue has slowed dramatically since the late 1990s as the novelty of casinos wore off (see Figures 12 and 13). 224 224 See also Dadayan, “Are States Betting on Sin?”; Dadayan, “State Revenues from Gambling.” Recent research has found that gambling participation in Canada has declined from nearly four-fifths (77.2 percent) in 2002 to around two-thirds (66.2 percent) in 2018. (Meanwhile, gambling revenue per Canadian adult has remained stable over the same period, meaning that the spending per gambler has increased.) 225 225 Williams et al., “Gambling and Problem Gambling in Canada 2018.” Lotteries, for example, have been experiencing a demographic-driven decline in sales, with millennials buying fewer tickets than older generations. Ontario Lottery and Gaming’s market research has found that adults younger than thirty-five are less than half as likely as the average Ontarian to be a “current player,” that is, to have bought a lottery ticket in the past two months (15 percent compared to 38 percent). In contrast, adults older than fifty-five play the lottery at a significantly higher rate than the provincial average, with nearly half (46 percent) of that age group classified as a current player. 226 226 Ontario Lottery and Gaming, “Lottery Players Fact Sheet”; see also Jones, “Lotteries Struggle to Attract Millennial Players.”
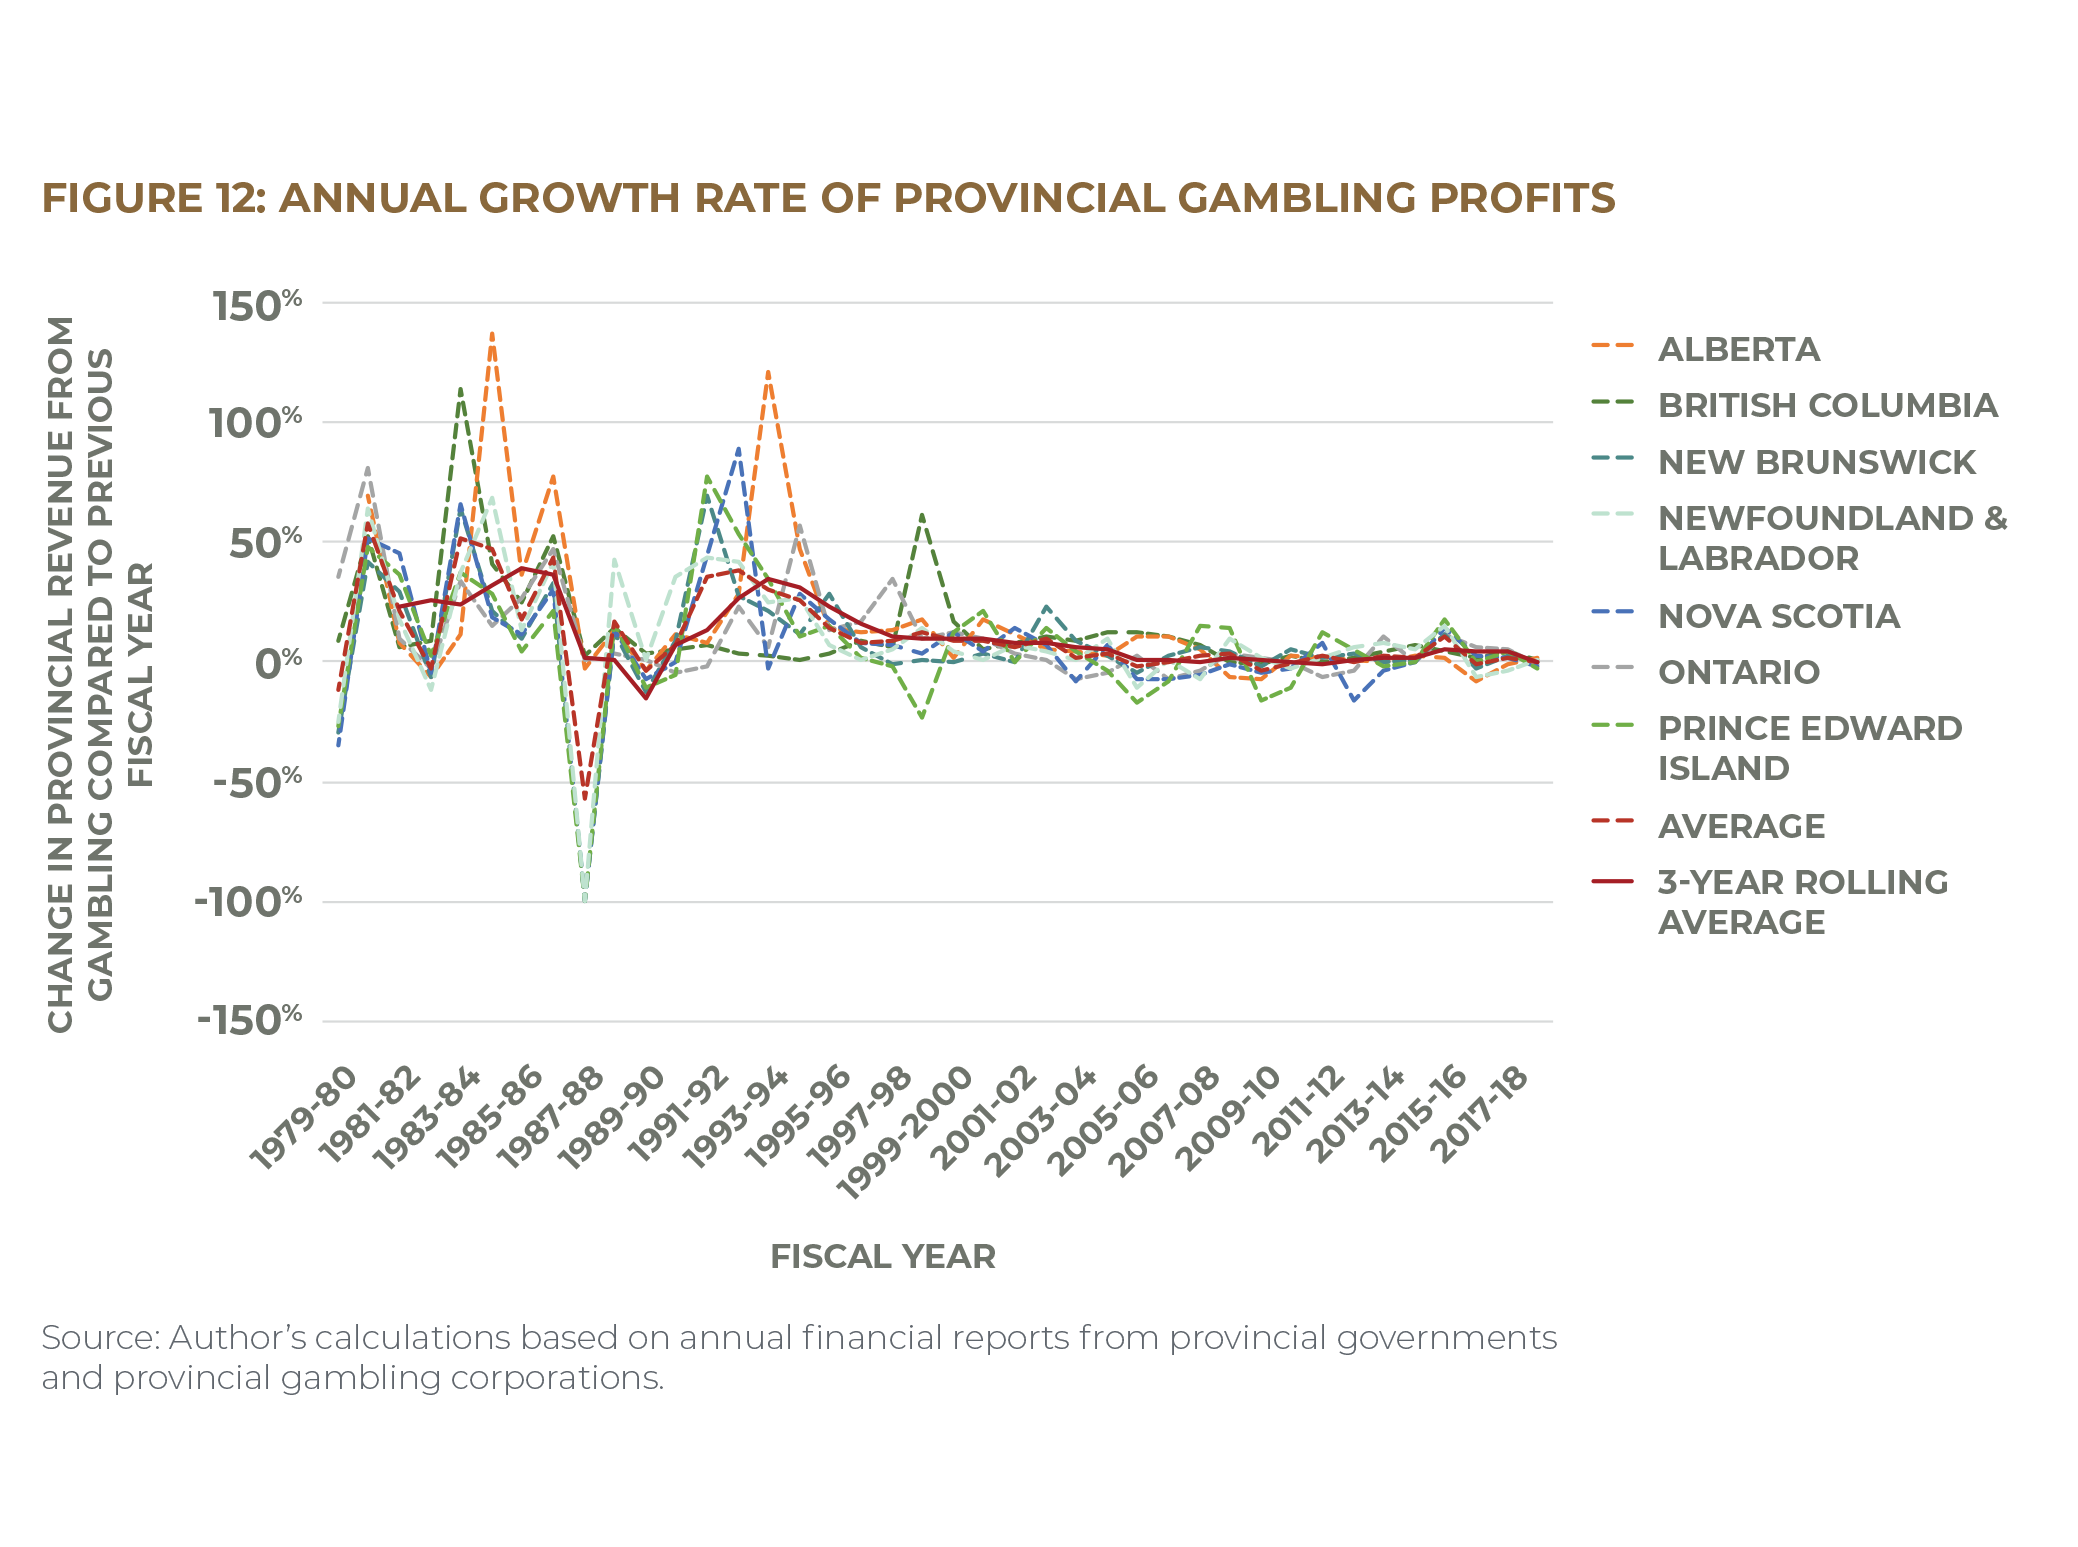
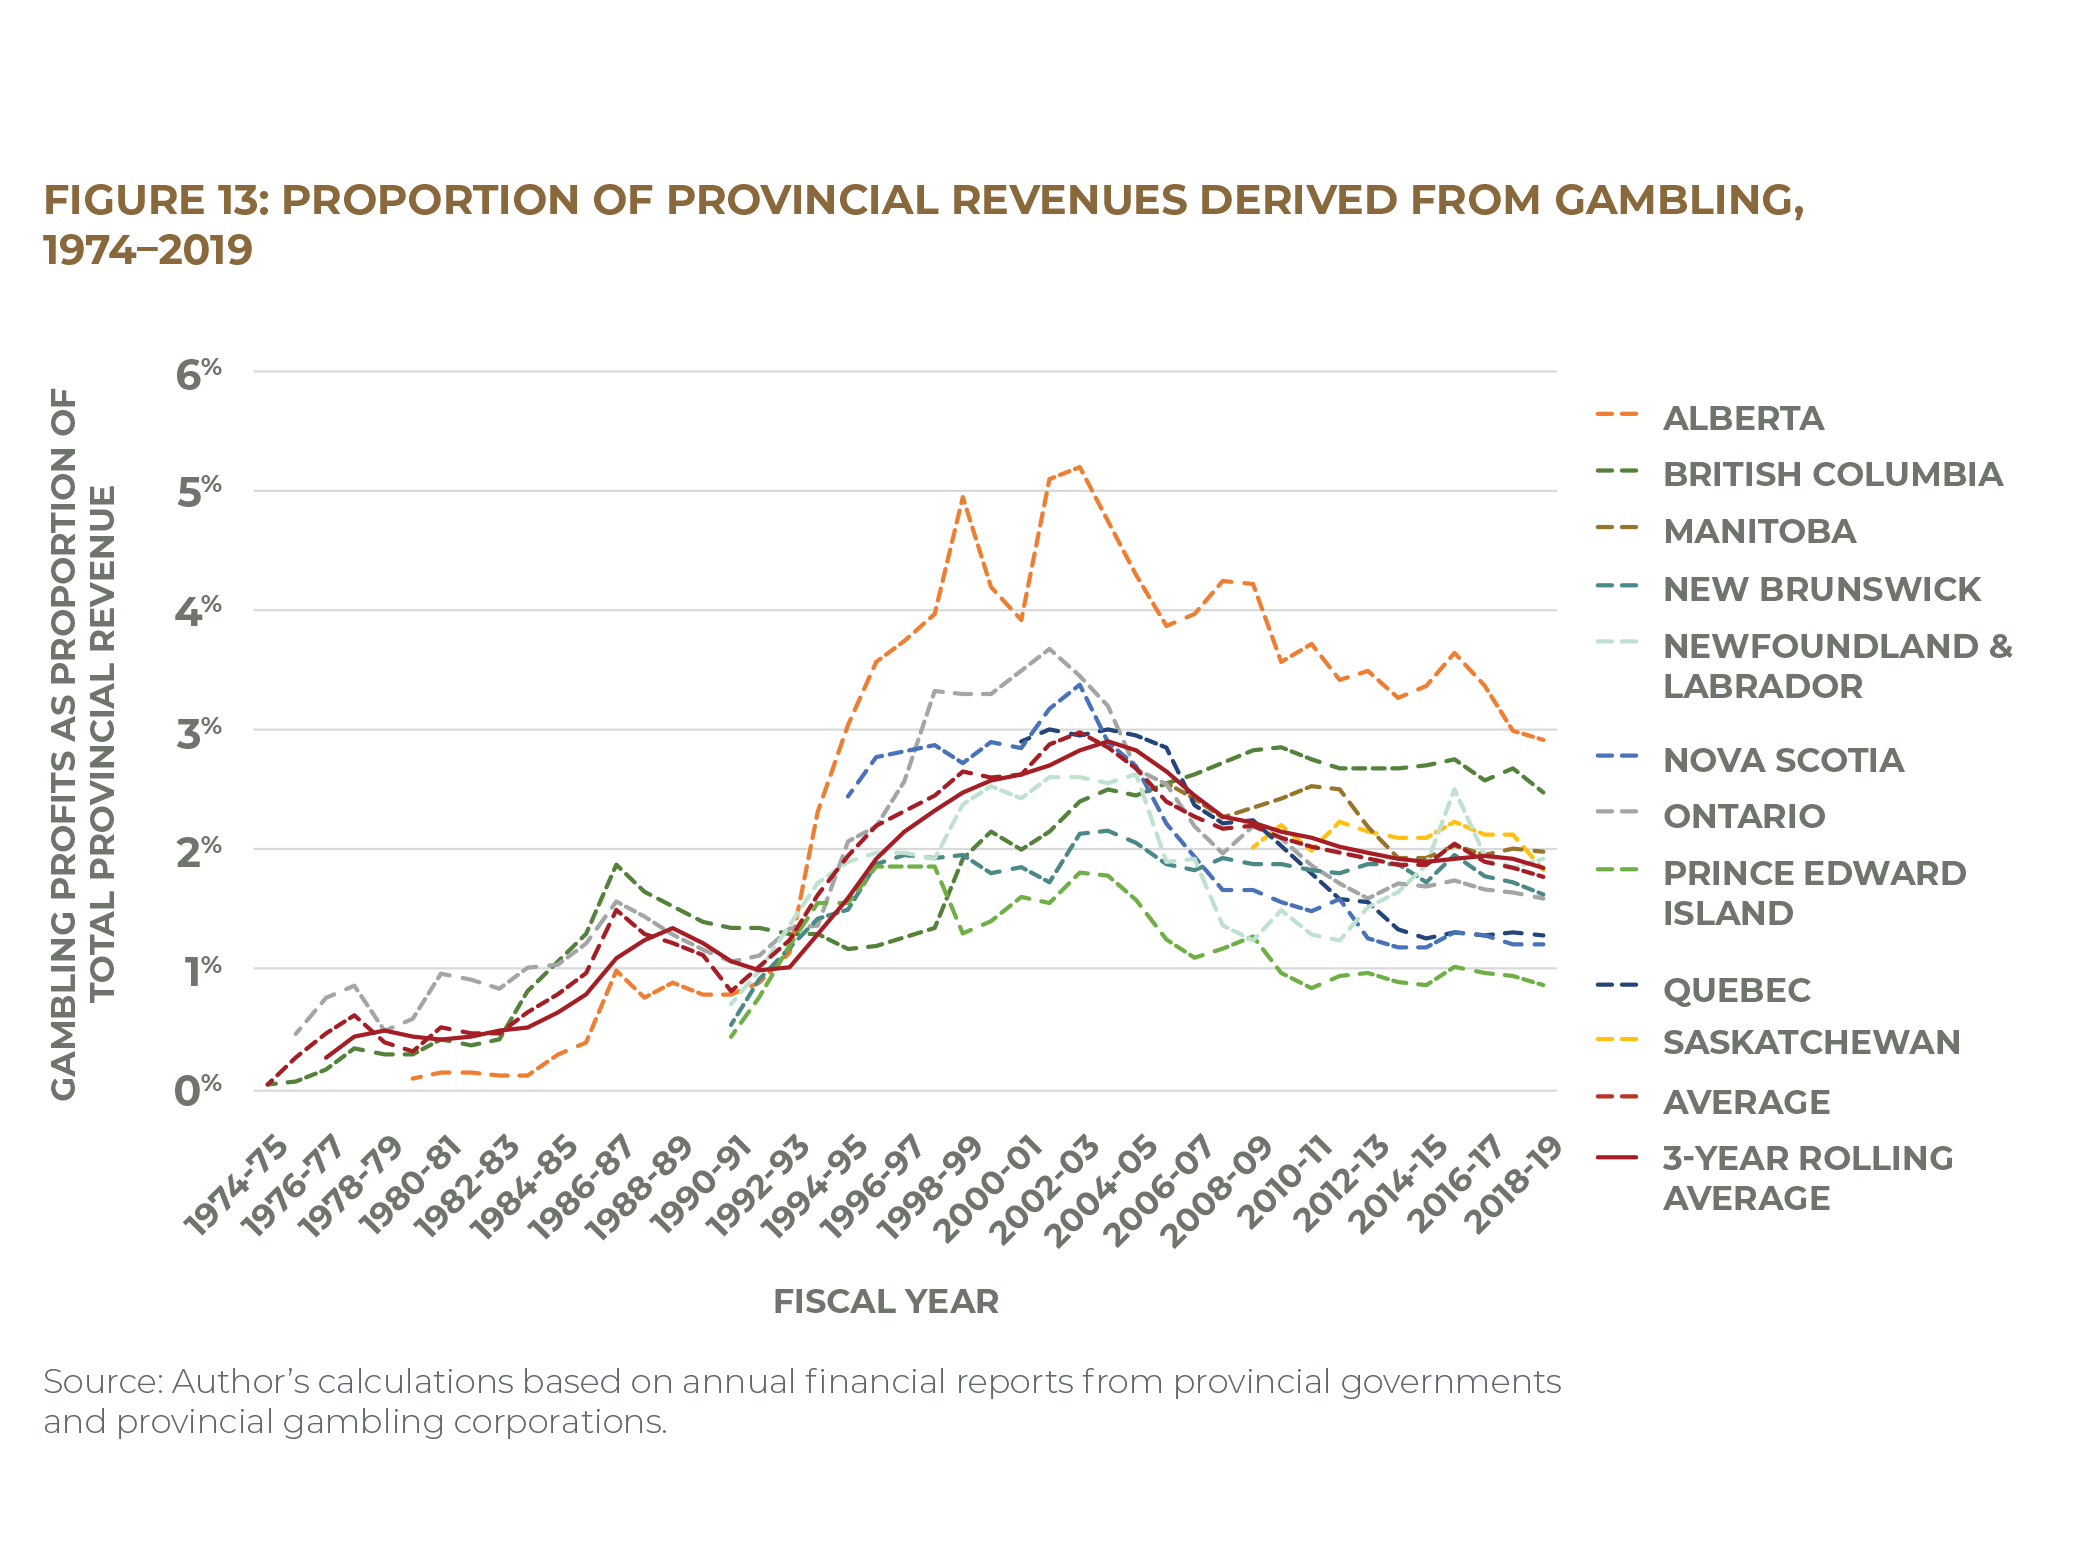
Lotteries and casinos are also a highly inefficient way for the government to generate revenue. Provinces and other levels of government—including federal, municipal, and First Nations—get barely half the money that leaves gamblers’ pockets: in the 2018–19 fiscal year, the proportion of gambling revenue sent to governments totaled 38 percent in Ontario, 40 percent in Atlantic Canada, and 55 percent in Alberta and British Columbia (see Figures 14 through 17). 227 227 Author’s calculations based on data from British Columbia Lottery Corporation, “2018/19 Annual Service Plan Report”; Alberta Gaming, Liquor and Cannabis Corporation, “Annual Report 2018–19”; Ontario Lottery and Gaming, “Annual Report 2018–19”; ALC, “Annual Report 2018–19.” The rest of the money goes to operating expenses and to lottery prizes—wealth skimmed from the pockets of the many, to be concentrated in the hands of the very, very few. As recent reporting has pointed out, the past few years have seen Ontario Lottery and Gaming’s profits fall even as revenue rises, raising questions about Ontario Lottery and Gaming Corporation executives’ compensation. 228 228 See Lilley, “OLG Boss Sets the Tone”; Lilley, “OLG Bosses Cash In Big”; Lilley, “OLG Prez on His Way Out.” Of course, as leaders of a multi-billion-dollar organization, members of the corporation’s executive team are exactly the kind of experienced and capable professionals Ontario would need to restructure its gambling system toward saving; their skills and expertise would be better spent building the wealth of individuals rather than funnelling ever more revenue to the state.
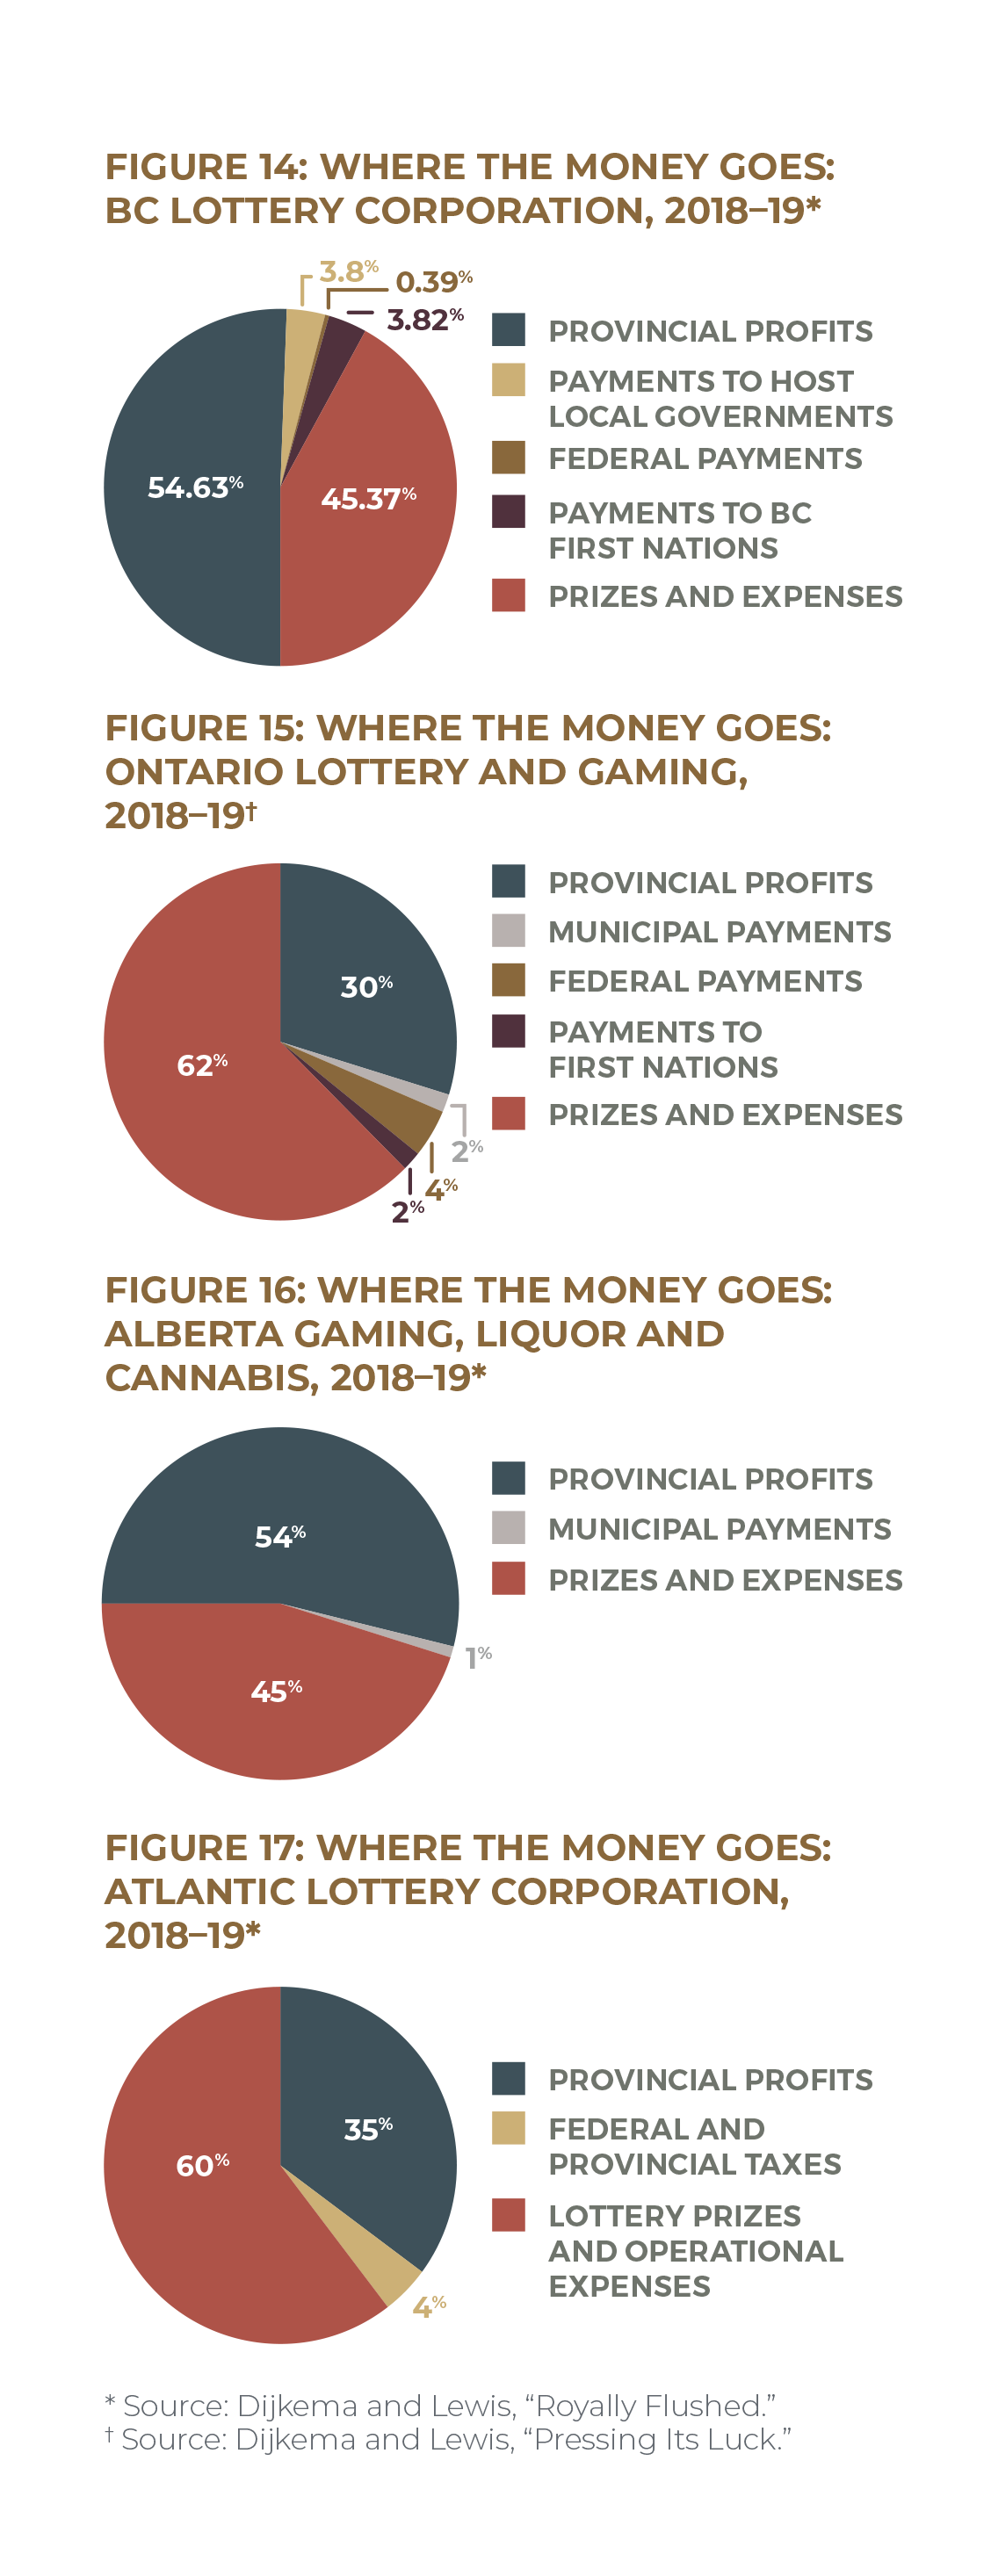
Greater restrictions on gambling advertising would help align the policy framework for gambling with the regulatory approach used for other “sin tax” products, such as alcohol, tobacco, and cannabis. Provincial gambling corporations’ aggressive promotion strategy is conspicuously inconsistent with the marketing restrictions for other government-controlled “vices.” Advertising regulations for alcohol and tobacco are strictly worded so as to prevent artificial stimulation of demand. In Ontario, for example, an alcohol commercial is permitted only if it “promotes a general brand or type of liquor and not the consumption of liquor in general.” 229 229 Alcohol Gaming Commission of Ontario, “Liquor Advertising.” Tobacco products and accessories cannot even be visible to consumers until after they’ve been purchased, and cigarette packages are plastered with labels that urge consumers to stop smoking, often with graphic images. 230 230 A few exemptions exist for specialty sellers. Ontario, “Rules for Selling Tobacco and Vapour Products”; Ontario, Smoke-Free Ontario Act, 2017, S.O. 2017, c. 26, Sched. 3; Government of Canada, “New Health Labelling for Tobacco Packaging.” The government restrains the market for these products because it knows that unhealthy consumption—more of a risk when they’re more easily available—has social costs. As a money-draining form of entertainment with a potential for devastating addiction, gambling falls into the same category. 231 231 See Doughney, “Ethical Blindness, EGMs and Public Policy”; Williams, West, and Simpson, “Prevention of Problem Gambling”; Williams and Wood, “What Proportion of Gambling.” Yet Ontario Lottery and Gaming provides 24/7 access to slots and urges Ontarians to try them out with messages like “Your fun starts here.” 232 232 Ontario Lottery and Gaming, “Find a Casino.”


Rebalancing gambling corporations’ budgets to ensure that problem gambling receives at least as much funding as advertising is a sound first step. But this policy option has important limits. Reducing advertising and boosting problem-gambling funding are, on their own, unlikely to substantially reduce the prevalence of problem gambling. A review of evidence and best practices to prevent problem gambling notes that “educational strategies tend to have limited ability to prevent addictive behaviour, and that meaningful policy measures are usually more effective.” 233 233 Williams, West, and Simpson, “Prevention of Problem Gambling,” 87. The authors find that information and awareness campaigns, on-site responsible-gambling centres, problem-gambling training for employees of gambling venues, and statistical instruction (i.e., educating players about the odds of different games) have moderately low effectiveness. In contrast, substantial restrictions on the number and location of gambling venues, on more harmful gambling formats, and on concurrent use of alcohol and tobacco have moderately high effectiveness. 234 234 Williams, West, and Simpson, “Prevention of Problem Gambling,” 82.
Moreover, very few problem gamblers seek treatment—likely only one in ten at most, according to available data. While the figures are higher for pathological gamblers—those with the most severe gambling problems—they are also the smallest group; low- or moderate-risk gamblers, whose gambling problems are milder, are a much larger group and as such experience the most gambling harms overall. Low treatment rates may suggest a need to improve the supply and accessibility of treatment, rather than a lack of demand, but more funding for treatment is unlikely to have more than a small impact on problem-gambling prevalence rates if only a small fraction of problem gamblers use the treatment. 235 235 Suurvali et al., “Treatment Seeking Among Ontario Problem Gamblers”; Suurvali, Hodgins, and Cunningham, “Motivators for Resolving or Seeking Help for Gambling Problems”; Cunningham, “Little Use of Treatment Among Problem Gamblers”; Rush et al., “Characteristics of People Seeking Help.” In contrast, a policy that includes meaningful restrictions on the supply of gambling affects everyone experiencing gambling harm. One of the factors linked to problem gambling is gambling availability—a national survey of problem gambling in Canada found the highest rates of gambling problems in provinces with permanent casinos alongside high concentrations of video lottery terminals (VLTs), 236 236 Cox et al., “A National Survey of Gambling Problems in Canada.” and there is evidence that proximity to gambling venues is associated with problem gambling. 237 237 Rush, Veldhuizen, and Adlaf, “Mapping the Prevalence of Problem Gambling”; Pearce et al., “A National Study of Neighbourhood Access”; Welte et al., “The Relationship of Ecological and Geographic Factors to Gambling Behaviour and Pathology”; Vasiliadis et al., “Physical Accessibility of Gaming Opportunity”; Tong and Chim, “The Relationship Between Casino Proximity and Problem Gambling”; Welte et al., “The Relationship Between Distance from Gambling Venues.” Some studies have found that the relationship between problem gambling and proximity to gambling venues weakens with time—problem gambling may spike when a casino is introduced to the community but may decline somewhat after several years.
Including the supply side in problem-gambling prevention strategies is consistent with a public health approach to gambling, which involves shifting focus away from the behaviour and responsibility of individuals to the systemic factors affecting gambling harm. 238 238 Gambling Research Exchange Ontario, “Gambling from a Public Health Perspective.” In addition, policies restricting supply are consistent with the state’s approach to other potentially dangerous products: “Jurisdictional approaches to reducing the harm from tobacco, alcohol, motor vehicles, etc., consistently give equal if not higher priority to policy initiatives (i.e., restricting access and operation), so it is unclear why gambling should be limited to just educational initiatives.” 239 239 Williams, West, and Simpson, “Prevention of Problem Gambling,” 87. Educational initiatives are important, but are less effective on their own—or when policy measures give the opposite message. This might mean ending twenty-four-hour access to casinos, restricting loyalty programs that stretch out players’ losing streaks with complimentary rewards, barring casinos from offering complimentary alcohol to gamblers, or limiting the number of electronic gambling machines and implementing stricter regulations on their deceptive features (e.g., losses disguised as wins and near misses). 240 240 See Toronto Public Health, “Position Statement: Gambling and Health”; Williams, West, and Simpson, “Prevention of Problem Gambling,” 90–91.
One danger of this policy option is that policy-makers and the gambling industry will implement some restrictions on the supply of gambling but will keep these restrictions nominal to minimize the impact on the bottom line. A meaningful reduction in problem gambling necessitates a meaningful reduction in revenue. Given that problem gamblers contribute between a quarter and half of provinces’ gambling revenue, any new restriction not followed by at least a modest dip in profits would almost certainly be an ineffective one. While policy-makers may prefer to have their cake and eat it too, “the reality is that the effective prevention of problem gambling . . . is only likely to occur with some level of inconvenience to non-problem gamblers and necessarily involves a loss of revenue because of the significant contribution problem gamblers make to overall gambling revenue.” 241 241 Williams, West, and Simpson, “Prevention of Problem Gambling,” 86.
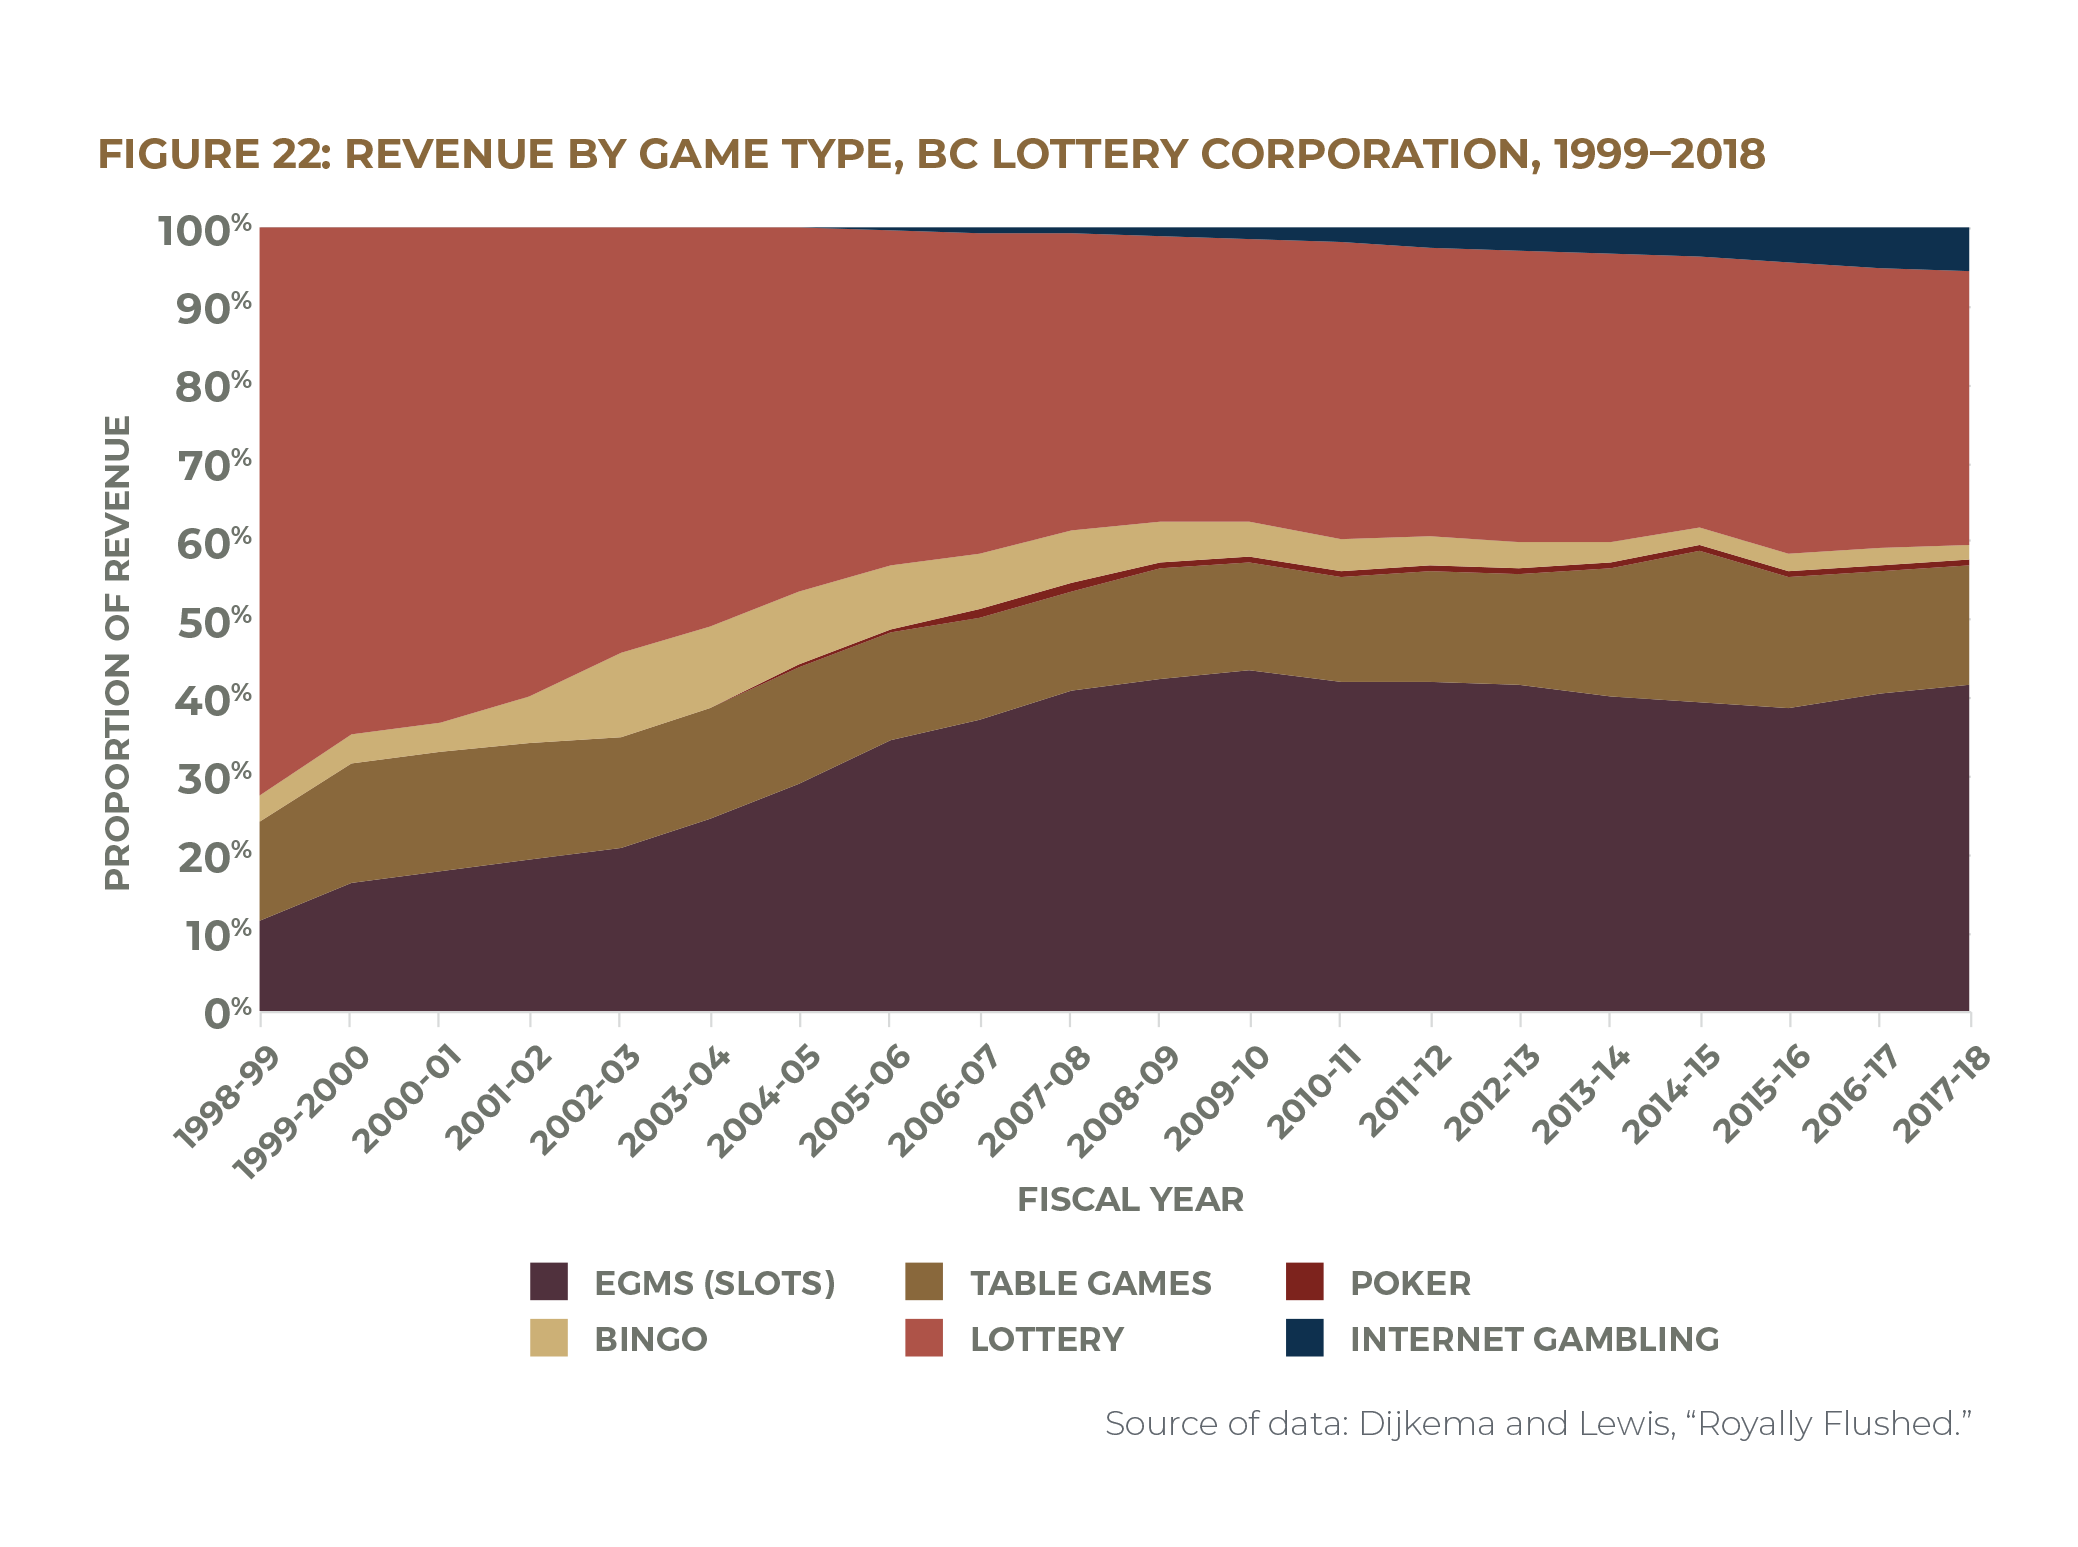
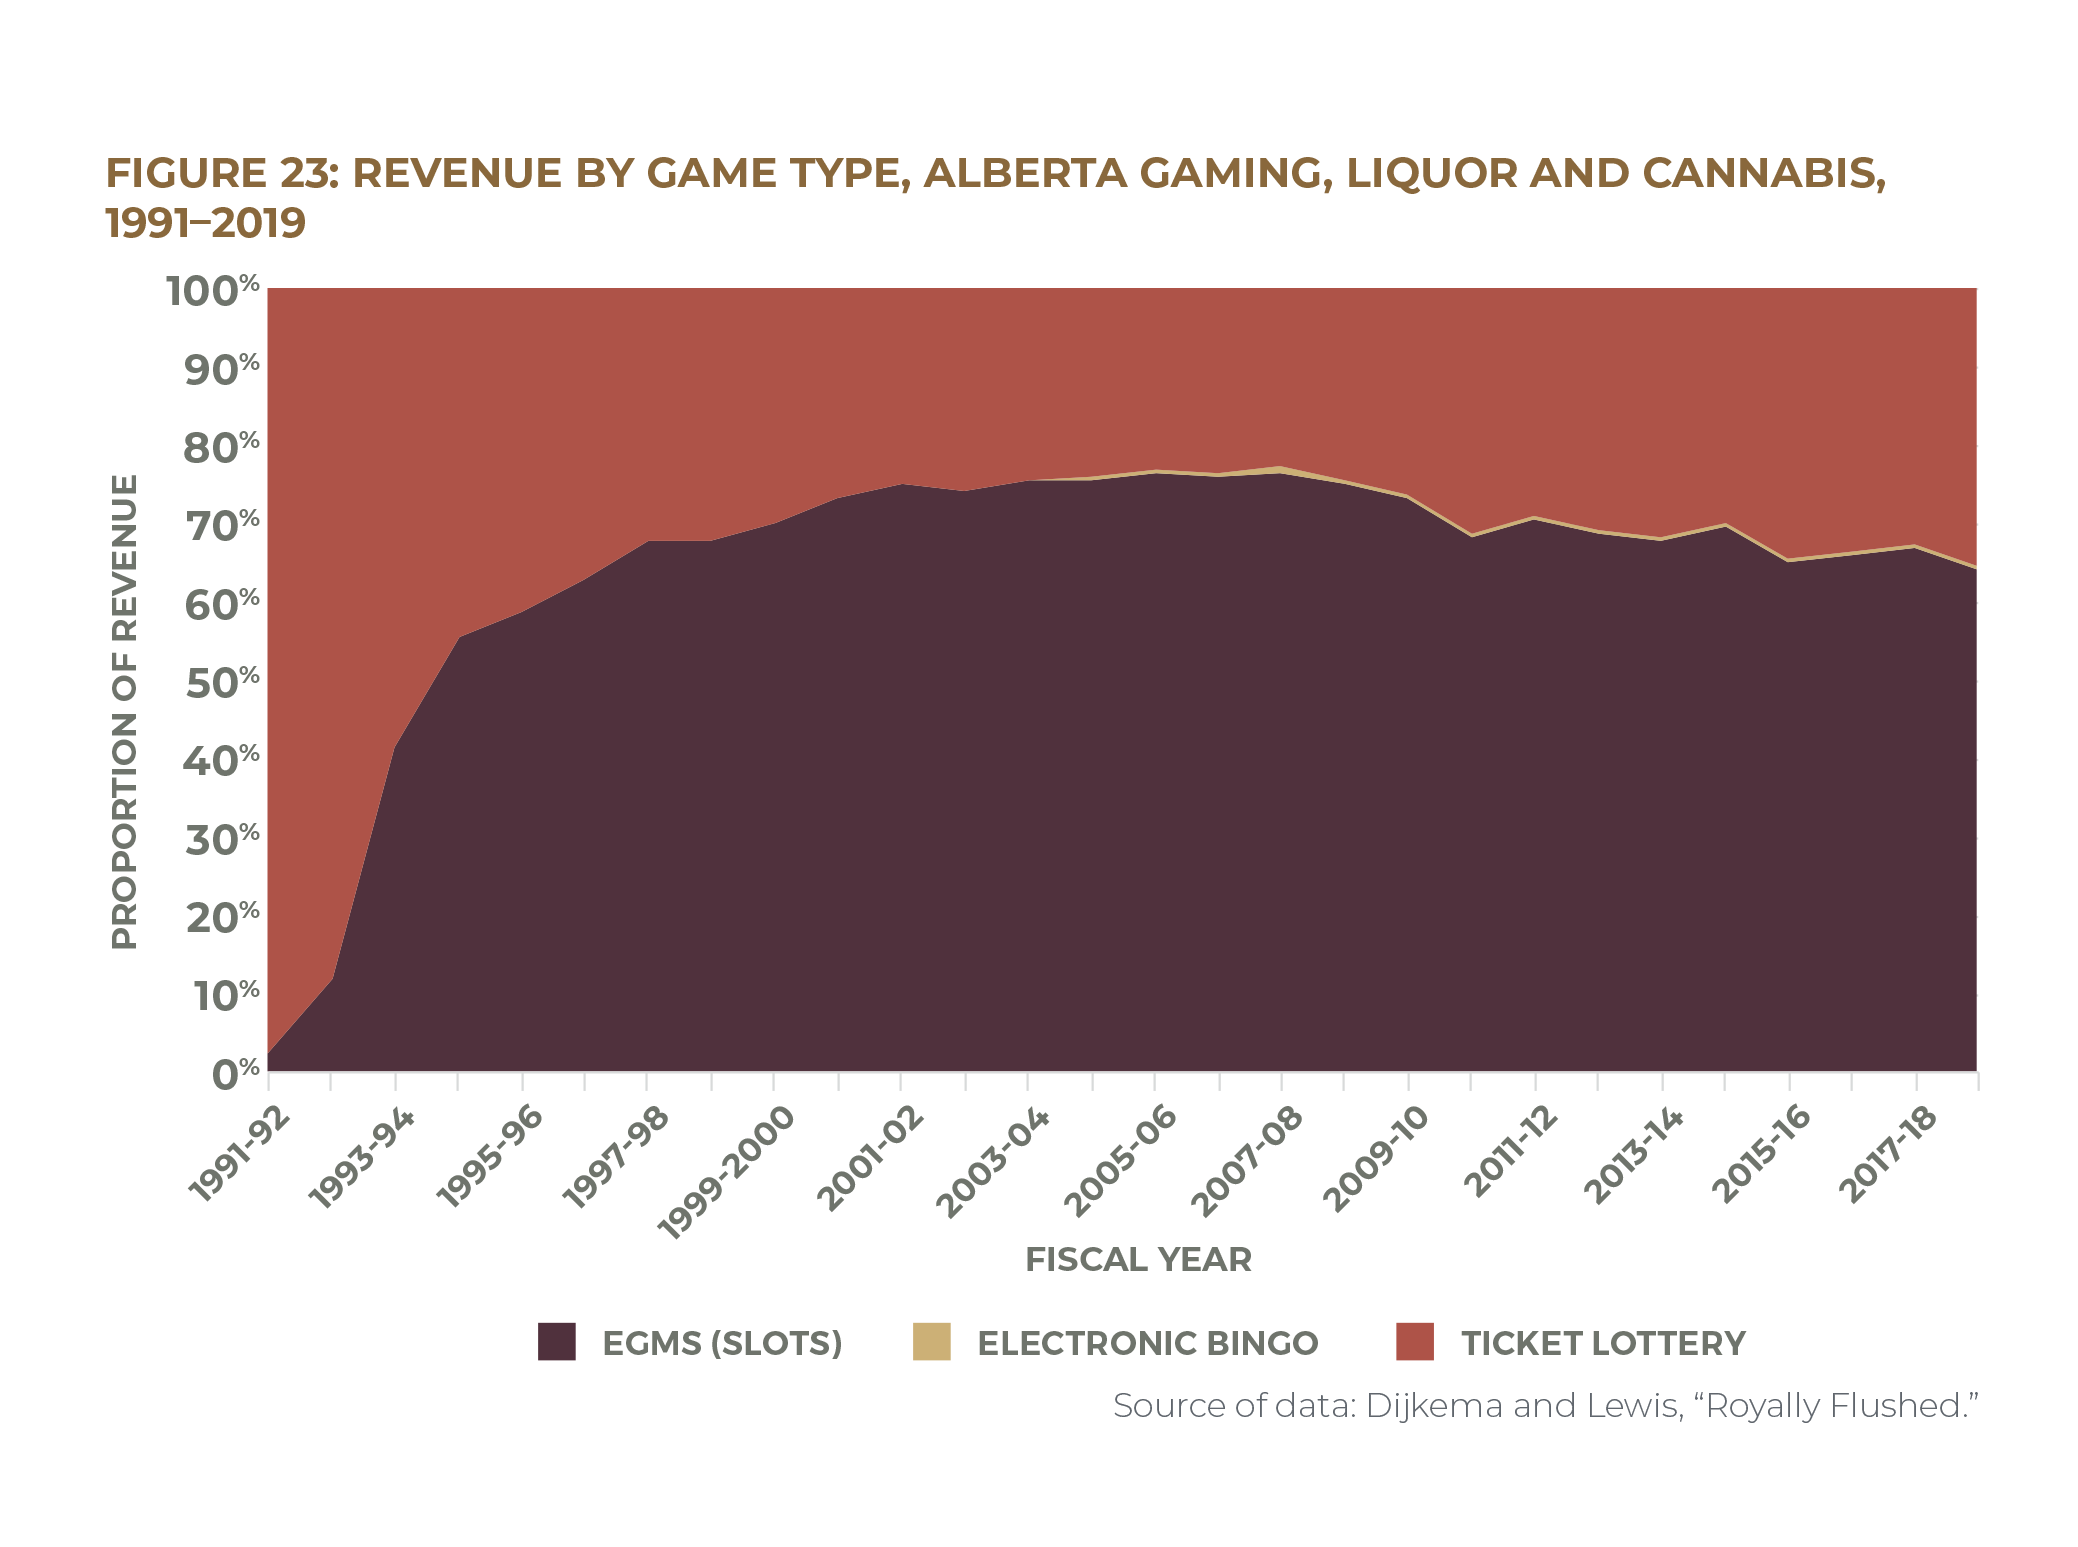
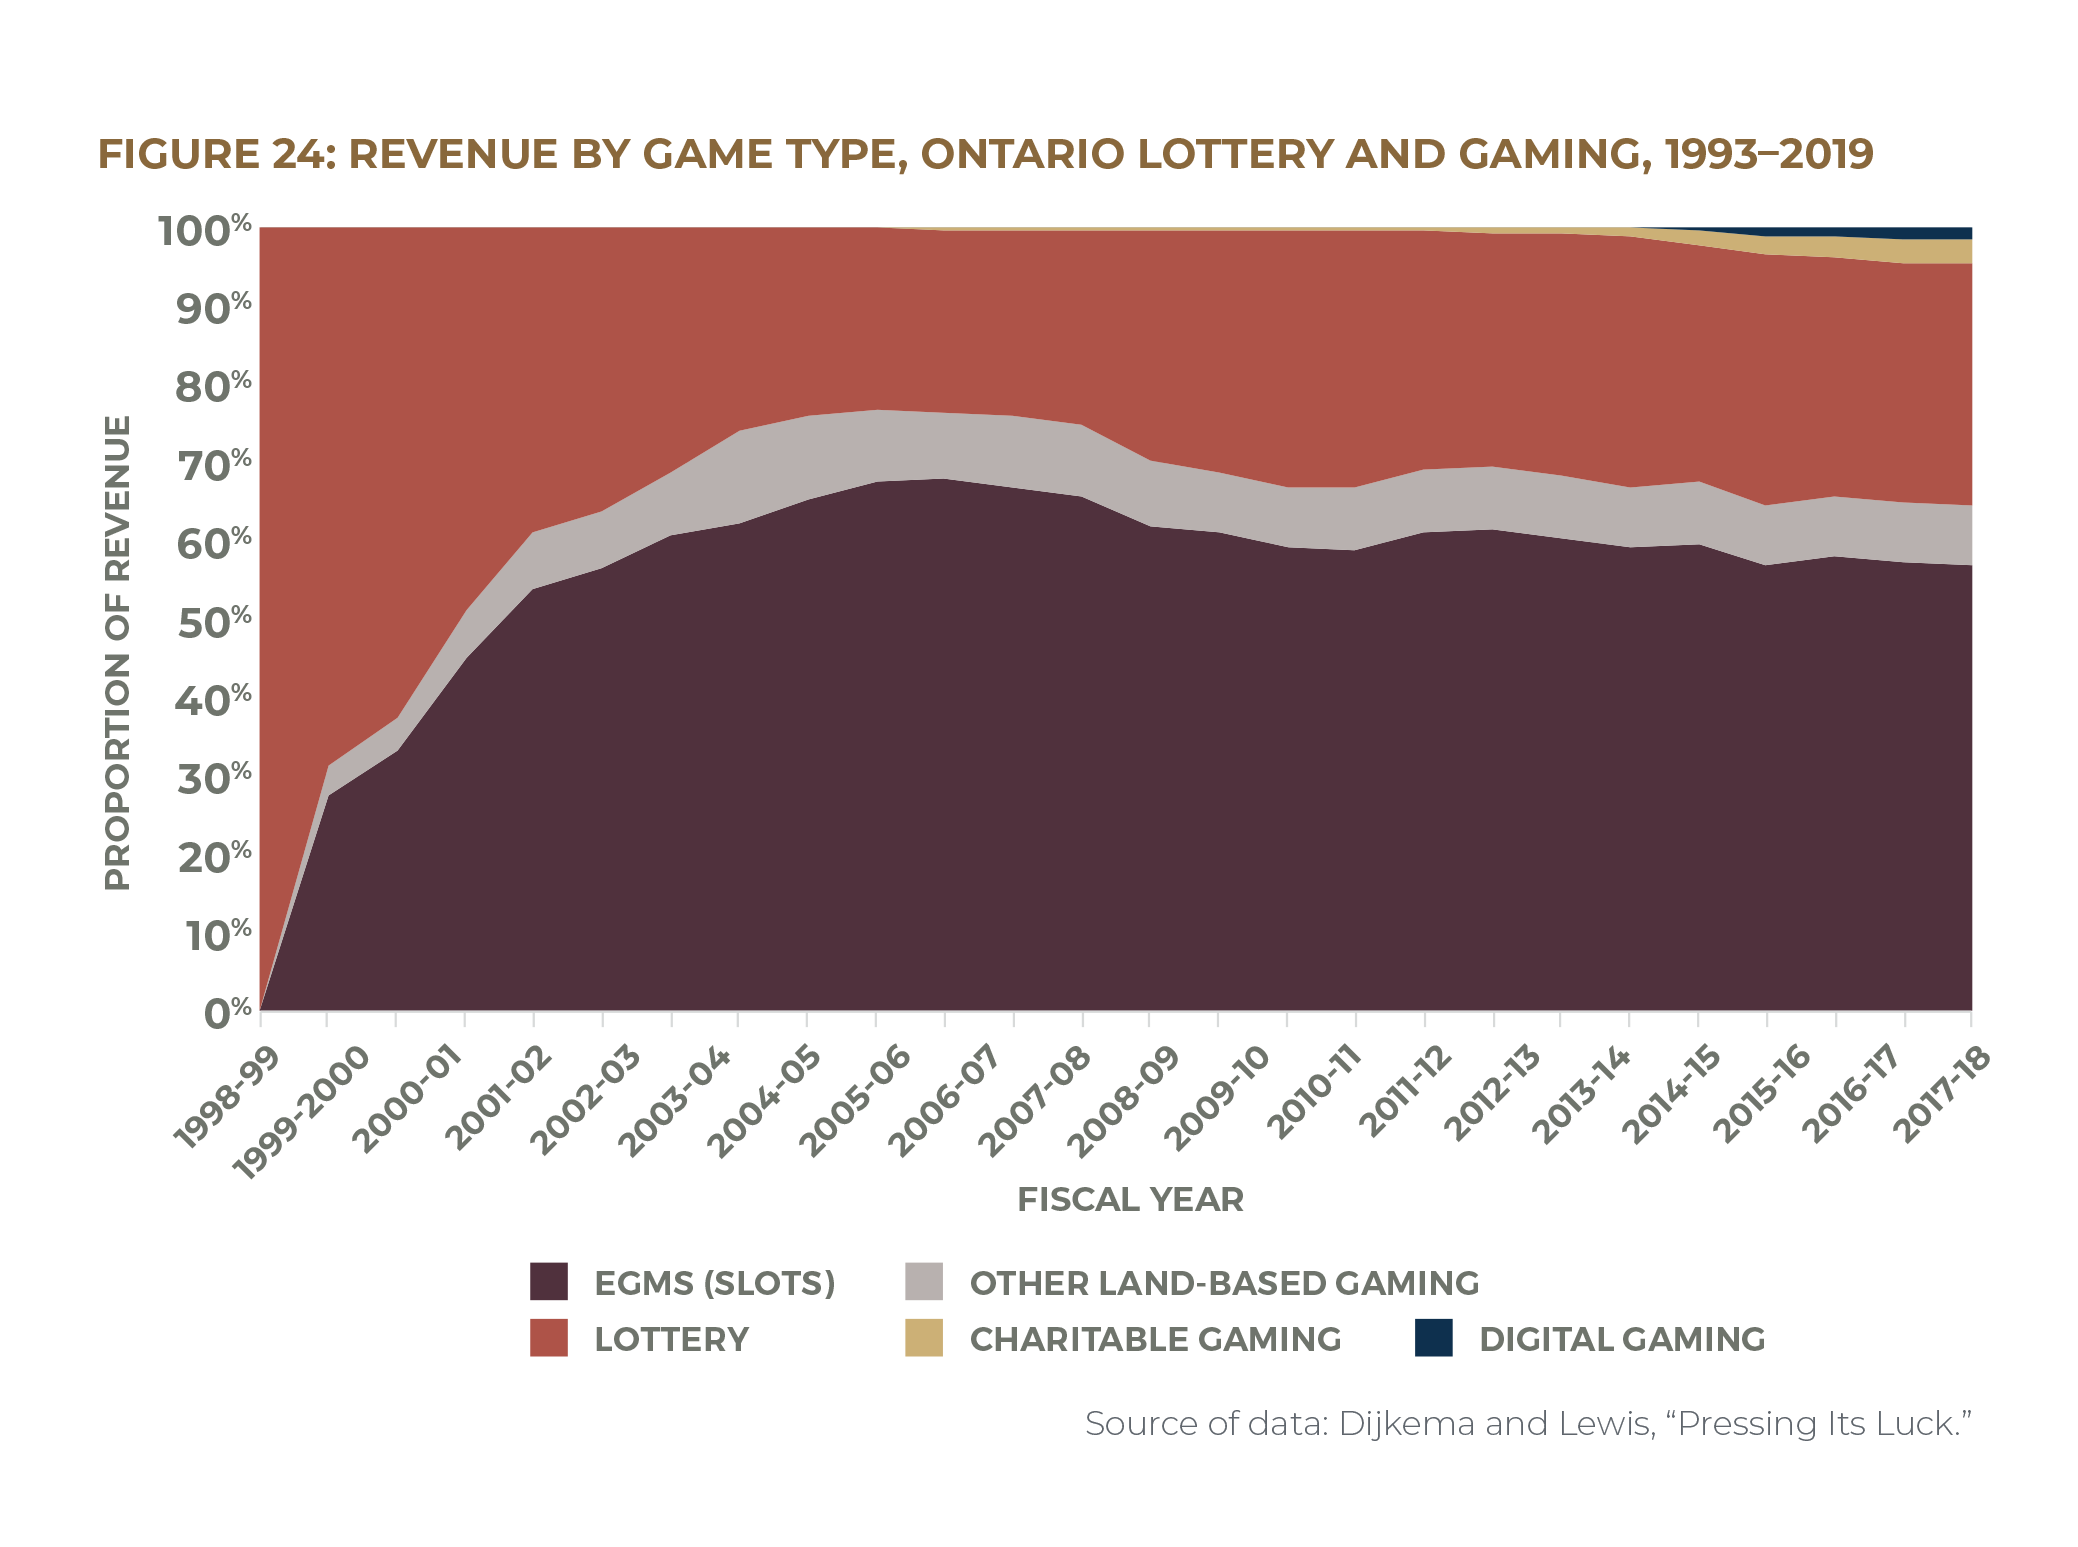
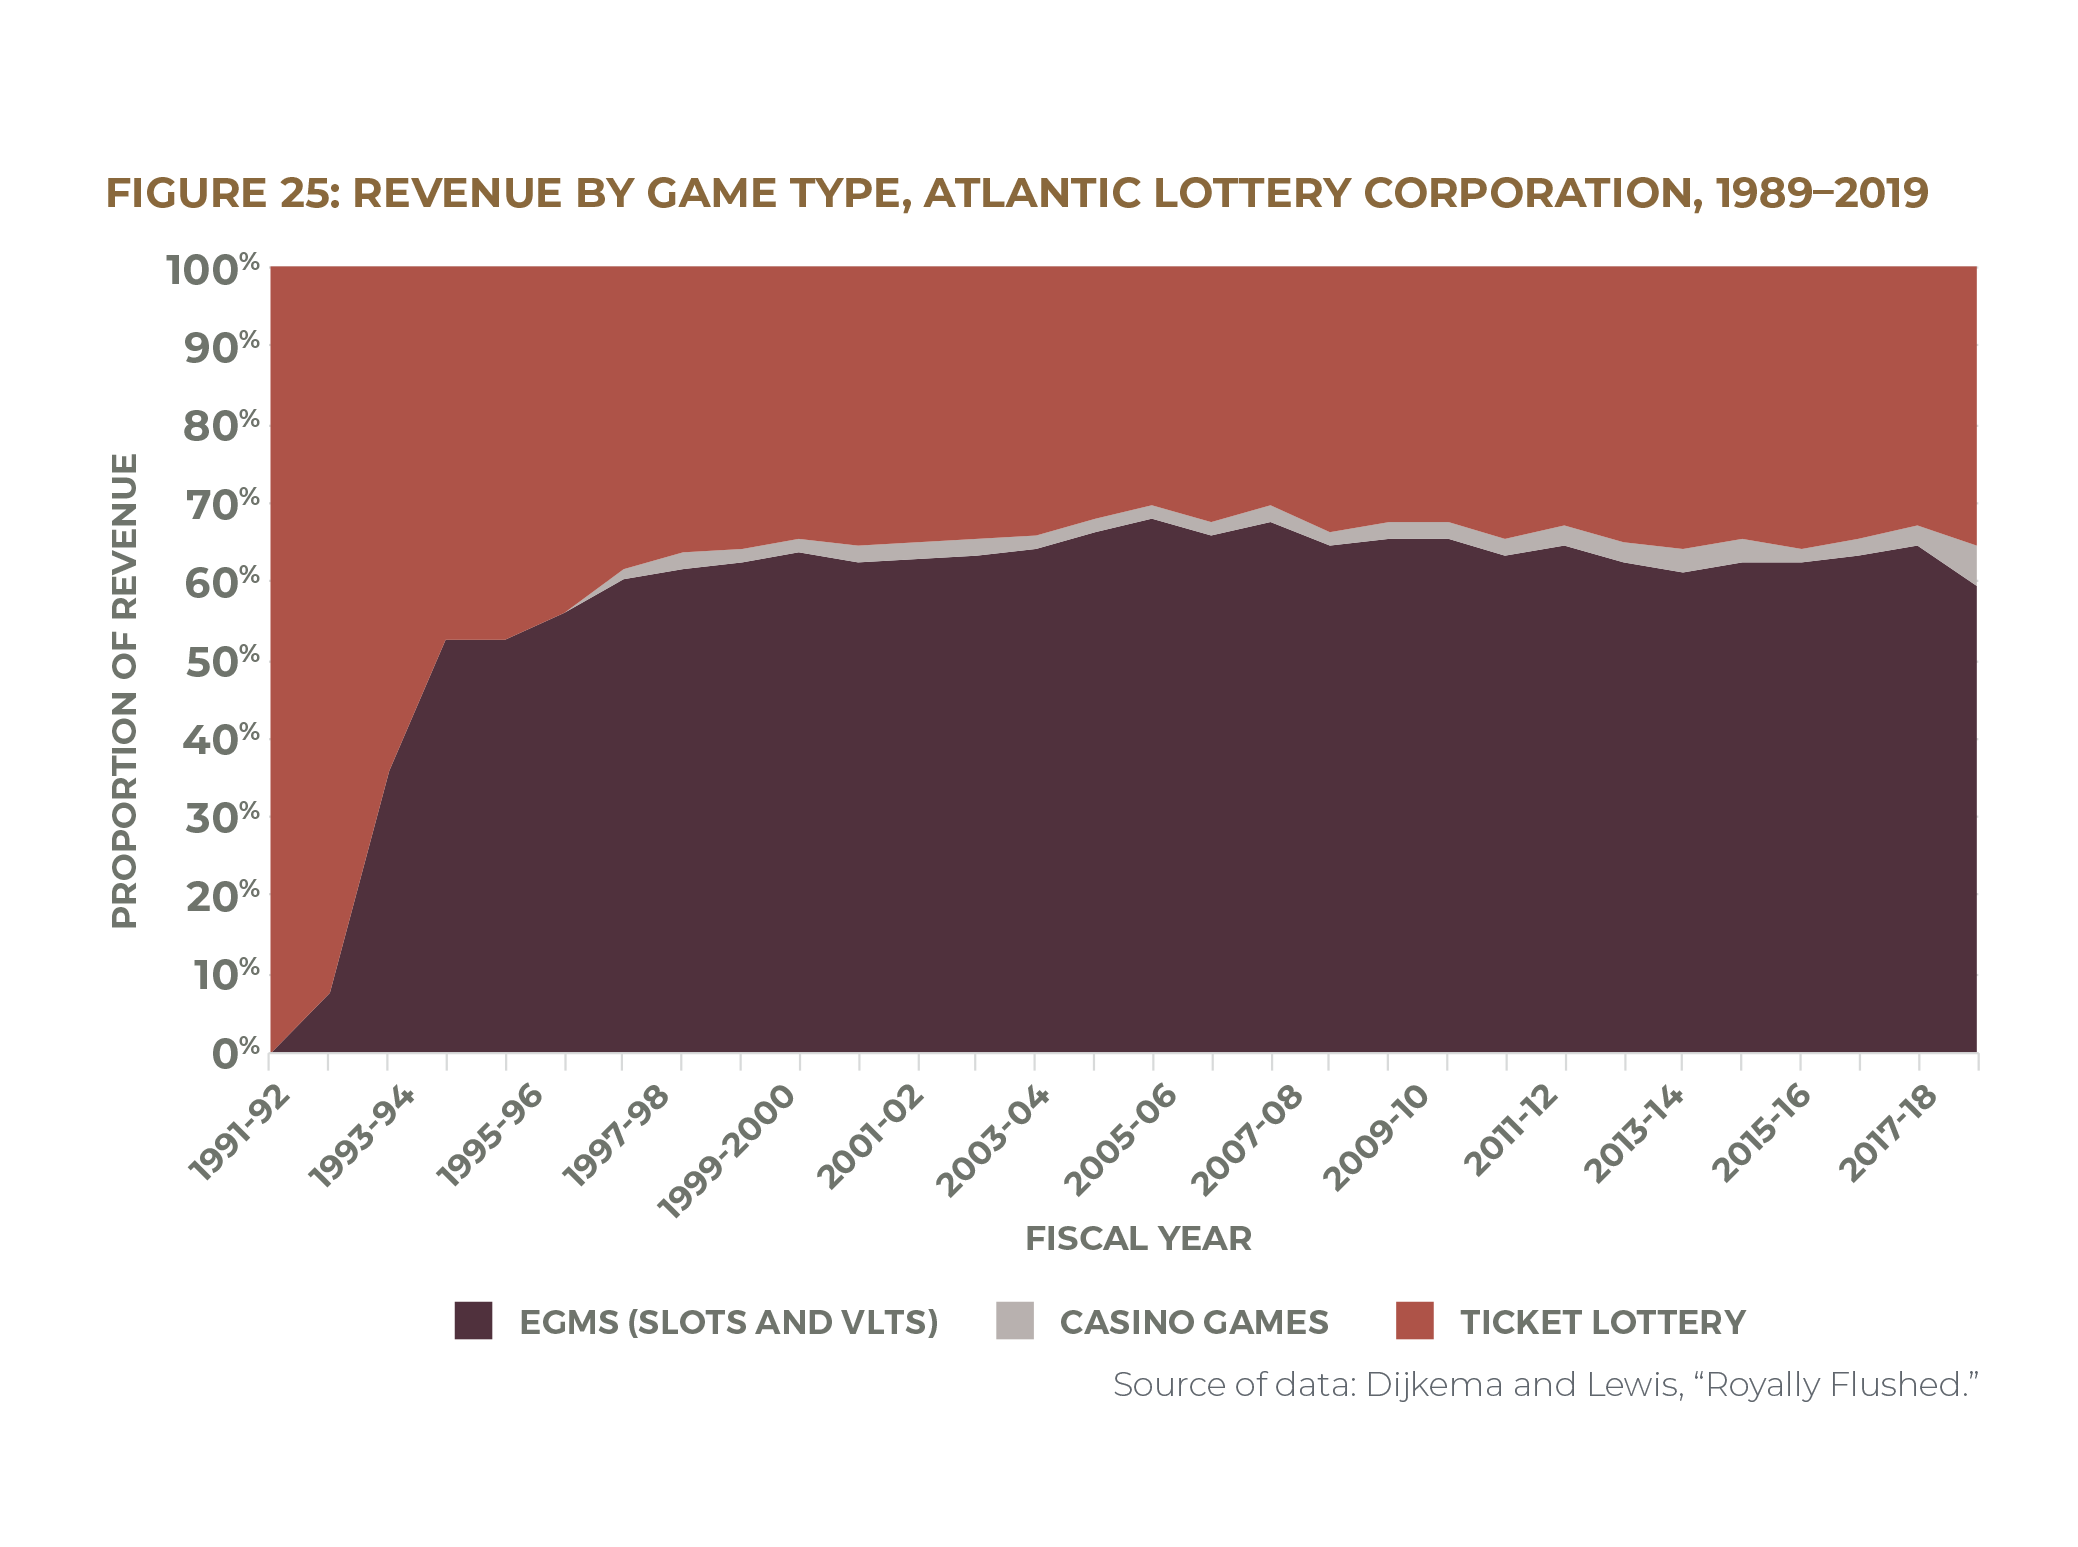
Conclusion
Governments spend hundreds of millions of dollars each year on ads designed to make people think they might win at games they’re designed to lose. These funds would be better spent on research-based best practices for problem-gambling prevention and treatment. More importantly, rebalancing the ratio of marketing to responsible-gambling funding would reflect a change in priorities from maximization of revenue to the protection of citizens’ well-being, which is more in line with the proper role of the state. These days, it is common for discussions of government responsibility to focus almost exclusively on growing the economy. But this materialistic emphasis is a fundamental distortion of the proper role of the state in the lives of its citizens: “Contrary to notions current in North American society, the maximizing of national wealth and the raising of our living standards is not the principal responsibility of government. . . . It is the undeniable and irrevocable obligation of governments to rule with justice for all and with charity towards the weak and powerless.” 245 245 Dieleman et al., “Committee to Study the Problem of Gambling,” 265; see also Moscovich, “Gambling with Our (Kids’) Futures,” 19. A government should promote healthy economic growth, yes, but this should always be subordinate to its defining responsibility to administer justice for the common good. 246 246 Dieleman et al., “Committee to Study the Problem of Gambling,” 265; see also Pontifical Council for Justice and Peace, Compendium of the Social Doctrine of the Church. The provinces’ dependency on gambling money compromises this duty. The ways in which gambling affects individuals should not distract us from the broader injustice of a state that relies on a robust gambling industry to pay its bills: “To associate all the evils of gambling with personal choice is to overlook the complicity of a system that needs gamblers in order to flourish.” 247 247 MacNeil et al., “The False Eden of Gambling.”
Conclusion
In this paper we examined ways in which policy-makers could reform their use of gambling funds so that these profits work for, not against, low-income households. We provided four policy options that would disentangle gambling dollars from legitimate tax revenue while helping the poor build both saving habits and assets.
A cash-transfer program, which we’ve provisionally named the Gaming Savings Credit, is the simplest option. It would be easy for constituents to understand, relatively straightforward to implement (particularly if designers take advantage of existing benefits infrastructure), and have the potential to reduce income inequality by boosting the incomes of the poor. Research shows that recipients of these kinds of unconditional cash-transfer programs generally spend the funds in line with the intention of the policy. Such a program does not address the gap in savings incentives for the poor, however. While the program could be oriented toward saving by adding a tax-time incentive to set Gaming Savings Credit money aside, such an addition would eliminate the very simplicity that this policy option has as one of its core strengths.
Another option is to use gambling profits to fund a matched savings program, which would stretch both public and private dollars by adding a government contribution to an individual’s savings. This incentive has been an effective way to build savings habits among participants in matched savings programs, from non-profits’ small-scale interventions at tax time to intensive, state-funded individual development accounts (IDAs). In program evaluations, alumni report higher levels of saving, and saving more regularly, after participating in the program, spurred on by the financial incentive and support from their fellow participants. Yet windfall gains and high administrative costs mean these benefits often come with a steep price tag, and evidence on their long-term effectiveness at reducing poverty remains inconclusive.
Alternatively, governments could use gambling profits to start a prize-linked savings (PLS) program. By awarding interest as lottery-like prizes rather than as regular payments, PLS introduces an element of fun and excitement to saving. Financial institutions around the world have found a strong market for PLS products, and research suggests that these savings vehicles are particularly appealing to low-income customers who are not in the habit of saving. Saving in PLS accounts has been found to substitute for gambling expenditures—a win for users’ financial security, though it may draw the ire of the gambling industry. As with matched savings programs, the long-term effect of participating in a PLS program on financial security remains unclear, since systematic evidence is limited. And making PLS options available to Canadians requires both the removal of regulatory barriers and widespread take-up by the financial institutions that could issue them.
The most immediate course of action that policy-makers could take is to reduce provincial gambling corporations’ marketing budgets and put the money toward problem-gambling research, prevention, and treatment. Problem gamblers are responsible for a vastly disproportionate share of total gambling revenue, and the most addictive gambling format—electronic gambling machines or EGMs—is also the most lucrative. Yet available data suggest provinces are investing far more in ads encouraging citizens to gamble than they are in services and research to help problem gamblers. Balancing this ratio (or, better yet, reversing it) would reflect a shift in governments’ priorities, from the maximization of profit to the protection of people, and would be more consistent with the regulations in place for other potentially addictive products such as alcohol and tobacco. Though policy-makers may fear a reduction in revenue if marketing is scaled back, diverting consumers’ spending away from gambling and toward more sustainable industries (or toward their own savings) may make for a more resilient economy in the long term. However, increased funding for problem gambling is unlikely to lead to major reductions in gambling harm unless policy-makers also implement meaningful restrictions on the supply of gambling, especially more harmful formats like EGMs.
We do not claim that any of these reforms will be easy. The gambling industry—and provincial treasuries’ addiction to its profits—is a multi-billion-dollar affair, and withdrawal will inevitably involve some short-term pain. Yet given the significant issues of justice—economic, political, social, and moral—at stake, we believe that the rewards of getting clean are well worth it.
References
Adams, J., S.A. Amedah, and M. Fougère. “Measuring the Effect of Child Benefit on Household Expenditures: Evidence from Canadian Households’ Survey Data.” Open Journal of Social Sciences 8, no. 6 (June 2020): 44–58. https://doi.org/10.4236/jss.2020.86005.
Adeevee. “Lotto Max: Yacht, House, Helicopter.” February 28, 2014. http://www.adeevee.com/2014/02/lotto-max-yacht-house-helicopter-print/.
Agostinelli, F., E. Borghesan, and G. Sorrenti. “Welfare, Workfare and Labor Supply: A Unified Ex Post and Ex Ante Evaluation.” Human Capital and Economic Opportunity Global Working Group Series no. 2020-083. November 2020. http://humcap.uchicago.edu/RePEc/hka/wpaper/Agostinelli_Borghesan_Sorrenti_2020_welfare-workfare-labor-supply.pdf.
Alberta Gambling Research Institute. “Adult Prevalence Studies of Problem Gambling.” Last modified June 17, 2016. https://docs.google.com/spreadsheets/u/0/d/1e9bZc0BOW0c-5MiAAddp_ECB4F-bqnCmJ2_n0atiIuc/pub?output=html.
Alberta Gaming, Liquor and Cannabis. “Annual Report 2017–18.” 2018. https://aglc.ca/sites/aglc.ca/files/aglc_files/2017-2018-AGLC_Annual_Report.pdf.
———. “Annual Report 2018–19.” 2019. https://aglc.ca/sites/aglc.ca/files/aglc_files/AGLC_AnnualReport_2019.pdf.
Alcohol and Gaming Commission of Ontario. “Liquor Advertising.” Accessed February 25, 2021. https://www.agco.ca/alcohol/liquor-advertising.
Alini, E. “Coronavirus: Nearly 1 Million Canadians Applied for EI Last Week.” Global News, March 24, 2020. https://globalnews.ca/news/6726111/coronavirus-ei-claims-1-million/.
Angus Reid Institute. “Canadians Don’t Want to Roll the Dice on Expanded Gambling.” October 13, 2016. https://angusreid.org/gambling/.
Annabi, N., Y. Boudribilia, and S. Harvey. “Labour Supply and Income Distribution Effects of the Working Income Tax Benefit: A General Equilibrium Microsimulation Analysis.” IZA Journal of Labour Policy 2, no. 19 (December 2013). https://doi.org/10.1186/2193-9004-2-19.
Assiniboine Credit Union. “Asset Building Programs.” Accessed August 6, 2020. https://www.assiniboine.mb.ca/Personal/Bank/Programs/Asset-Building-Programs/.
Atalay, K., E. Garbarino, and R. Slonim. “Prize-Linked Savings Accounts: Combining Virtue and Vice to Make Savings More Enticing.” Journal of Consumer Marketing 37, no. 2 (2019): 180–90. https://doi.org/10.1108/JCM-03-2019-3109.
Atalay, K., F. Bakhtiar, S. Cheung, and R. Slonim. “Savings and Prize-Linked Savings Accounts.” Journal of Economic Behavior & Organization 107 (2014): 86–106. https://doi.org/10.1016/j.jebo.2014.07.015.
Atlantic Lottery Corporation. “Atlantic Lottery: Annual Report 2017–2018.” 2018. https://www.alc.ca/content/dam/alc/docs-en/Corp/AboutAL/WhoisAL/AnnRepts/ALC_Annual%20Report_ENG_sep%2020_2018_DIGITAL.pdf.
———. “Atlantic Lottery: Annual Report 2018–2019.” 2019. https://www.alc.ca/content/dam/alc/docs-en/Corp/AboutAL/WhoisAL/AnnRepts/Annual%20Report%202018-19.pdf.
Azurdia, G., and S. Freedman. “Encouraging Nonretirement Savings at Tax Time: Final Impact Findings from the SaveUSA Evaluation.” MDRC, January 2016. https://www.mdrc.org/publication/encouraging-nonretirement-savings-tax-time.
Baird, S., F.H.G. Ferreira, B. Özler, and M. Woolcock. “Conditional, Unconditional and Everything in Between: A Systematic Review of the Effects of Cash Transfer Programmes on Schooling Outcomes.” Journal of Development Effectiveness 6, no. 1 (2014): 1–43. https://doi.org/10.1080/19439342.2014.890362.
Bank of Montreal. “Average Emergency Savings Fund up 18 per cent from 2014; One Quarter Living Paycheque to Paycheque: BMO Rainy Day Survey.” September 1, 2015. https://newsroom.bmo.com/2015-09-01-Average-Emergency-Savings-Fund-up-18-per-cent-From-2014-One-Quarter-Living-Paycheque-to-Paycheque-BMO-Rainy-Day-Survey.
———. “BMO Household Savings Report: 15 Per Cent of Canadians Managed to Tuck Away More than $10,000 in 2018, but One Quarter Didn’t Save a Penny.” February 12, 2019. https://newsroom.bmo.com/2019-02-12-BMO-Household-Savings-Report-15-Per-Cent-of-Canadians-Managed-to-Tuck-Away-More-than-10-000-in-2018-but-One-Quarter-Didnt-Save-a-Penny.
Barker, S. “Premium Bonds: Record Payouts, but Here’s Why You Should Save Elsewhere.” The Telegraph, January 13, 2019. https://www.telegraph.co.uk/personal-banking/savings/premium-bonds-record-payouts-should-save-elsewhere/.
Bastagli, F., J. Hagen-Zanker, L. Harman, V. Barca, G. Sturge, T. Schmidt, and L. Pellerano. “Cash Transfers: What Does the Evidence Say?” Overseas Development Institute, 2016. https://www.odi.org/publications/10505-cash-transfers-what-does-evidence-say-rigorous-review-impacts-and-role-design-and-implementation.
Baxter, Mary. “Why Expanding Casinos in Ontario Is a Big Gamble.” TVO, April 20, 2018. https://www.tvo.org/article/why-expanding-casinos-in-ontario-is-a-big-gamble.
Baxter, Missy. “Prize-Linked Savings Promotions: Gambling or Gamification?” Credit Union Times, September 12, 2014. https://www.cutimes.com/2014/09/12/prize-linked-savings-promotions-gambling-or-gamification/?slreturn=20201109100526.
BBC News. “Budget: Saving Gateway Scheme Is Scrapped.” June 22, 2010. https://www.bbc.com/news/10376543.
BNN Bloomberg. “76% of Canadians Now Bank Online or Through an App, Poll Finds.” March 13, 2019. https://www.bnnbloomberg.ca/76-of-canadians-now-bank-online-or-through-an-app-poll-finds-1.1228359.
Boshara, R. “Individual Development Accounts: Policies to Build Savings and Assets for the Poor.” Brookings Institution Policy Brief: Welfare Reform & Beyond 32 (March 2005). https://www.brookings.edu/wp-content/uploads/2016/06/pb32.pdf.
Bouguettaya, A., D. Lynott, A. Carter, O. Zerhouni, S. Meyer, I. Ladegaard, J. Gardner, and K.S. O’Brien. “The Relationship Between Gambling Advertising and Gambling Attitudes, Intentions and Behaviours: A Critical and Meta-Analytic Review.” Current Opinion in Behavioural Sciences 31 (February 2020): 89–101. https://doi.org/10.1016/j.cobeha.2020.02.010.
British Columbia Lottery Corporation. “BC Lottery Corporation 2017/18 Annual Service Plan Report.” July 2018. https://corporate.bclc.com/content/dam/bclccorporate/reports/annual-reports/2018/2017-18-annual-service-plan-report.pdf.
———. “BC Lottery Corporation 2018/19 Annual Service Plan Report.” July 2019. https://corporate.bclc.com/content/dam/bclccorporate/reports/annual-reports/2019/2018-19-annual-service-plan-report.pdf.
———. “Where the Money Goes.” Accessed August 13, 2020. https://corporate.bclc.com/community-benefits/where-the-money-goes.html.
British Columbia Provincial Health Officer. “Lower the Stakes: A Public Health Approach to Gambling in British Columbia. Provincial Health Officer’s 2009 Annual Report.” BC Ministry of Health, 2009. https://www2.gov.bc.ca/assets/gov/health/about-bc-s-health-care-system/office-of-the-provincial-health-officer/reports-publications/annual-reports/gambling-in-bc.pdf.
Brown, E.M., and V. Tarasuk. “Money Speaks: Reductions in Severe Food Insecurity Follow the Canada Child Benefit.” Preventative Medicine 129 (December 2019): 105876. https://doi.org/10.1016/j.ypmed.2019.105876.
Brownell, M., N.C. Nickel, M. Chartier, J.E. Enns, D. Chateau, J. Sarkar, E. Burland, D.P. Jutte, C. Taylor, and A. Katz. “An Unconditional Prenatal Income Supplement Reduces Population Inequities in Birth Outcomes.” Health Affairs 37, no. 3 (March 2018): 447–55. https://doi.org/10.1377/hlthaff.2017.1290.
Burke, J. “Can Prize-Linked Incentives Promote Debt Reduction in the United States?” Innovations for Poverty Action. https://www.poverty-action.org/study/can-prize-linked-incentives-promote-debt-reduction-united-states.
Burnside Gorge Community Association. “Family Self Sufficiency Program.” Accessed February 25, 2021. https://burnsidegorge.ca/family-programs/family-self-sufficiency/.
Canada. Criminal Code, RSC 1985, c. C-34, s. 74.06. https://laws-lois.justice.gc.ca/eng/acts/C-34/page-19.html?txthl=lottery#s-74.06.
———. Criminal Code, RSC 1985, c. C-46, s. 206–207. https://laws-lois.justice.gc.ca/eng/acts/c-46/page-49.html#docCont.
Canadian Contest Law. “Contests.” Accessed February 25, 2021. http://www.contestlawyer.ca/contests/.
Canadian Prepaid Providers Organization. “Canadian Open-Loop Prepaid Market Is Growing.” 2016. https://cppo.ca/wp-content/uploads/2019/06/canadian-prepaid-market-infographic-2016.pdf.
———. “How Canadians Pay Today.” 2016 CPPO Research. https://cppo.ca/wp-content/uploads/2019/06/How-Canadians-Pay-2017.pdf.
Cole, S., B. Iverson, and P. Tufano. “Can Gambling Increase Savings? Empirical Evidence on Prize-Linked Savings Accounts.” Saïd Business School Working Paper, 2014. https://doi.org/10.2139/ssrn.2441286.
Commonwealth. “Prize-Linked Savings in Credit Unions: 2018.” 2019. https://buildcommonwealth.org/publications/prize-linked-savings-in-credit-unions-2018.
———. “Prize-Linked Savings in Credit Unions: 2019.” 2020. https://buildcommonwealth.org/publications/prize-linked-savings-in-credit-unions-2019.
———. “Prize-Linked Savings Policy.” Accessed December 8, 2020. https://buildcommonwealth.org/work/info/prize-linked-savings-policy.
———. “Walmart MoneyCard Prize Savings: One Year Anniversary Brief.” https://buildcommonwealth.org/publications/walmart-moneycard-prize-savings-one-year-anniversary-brief.
———. “WINcentive Savings 2019 Report.” July 2020. https://buildcommonwealth.org/assets/downloads/WINcentive_Savings_2019_Report.pdf.
Compass Working Capital. “Why Asset Poverty Matters.” Accessed December 7, 2020. https://www.compassworkingcapital.org/why-asset-poverty-matters.
Consumer Federation of America and The Financial Planning Association. “How Americans View Personal Wealth vs. How Financial Planners View This Wealth.” January 9, 2006. https://consumerfed.org/pdfs/Financial_Planners_Study011006.pdf.
Consumer Financial Protection Bureau. “Financial Well-Being in America.” September 2017. https://files.consumerfinance.gov/f/documents/201709_cfpb_financial-well-being-in-America.pdf.
———. “Increasing Saving at Tax Time and Promising Practices for the Field.” CFPB Office of Financial Empowerment, August 2015. https://files.consumerfinance.gov/f/201509_cfpb_increasing-saving-at-tax-time-and-promising-practices-for-the-field.pdf.
———. “Perceived Financial Preparedness, Saving Habits, and Financial Security.” CFPB Office of Research, September 2020. https://files.consumerfinance.gov/f/documents/cfpb_perceived-financial-preparedness-saving-habits-and-financial-security_2020-09.pdf.
Cookson, J.A. “When Saving Is Gambling.” Journal of Financial Economics 129 (2018): 24–45. https://doi.org/10.1016/j.jfineco.2018.04.001.
Côté, A., A. Mazer, and J. Weisstub. “The Canada Saver’s Credit: A Proposal to Build Financial Security for Lower- and Modest-Income Canadians.” Maytree, 2019. https://maytree.com/wp-content/uploads/Canada_Savers_Credit.pdf.
Cox, B., N. Yu, T. Afifi, and R. Ladouceur. “A National Survey of Gambling Problems in Canada.” Canadian Journal of Psychiatry 50, no. 4 (March 2005): 213–17. https://journals.sagepub.com/doi/pdf/10.1177/070674370505000404.
Cramer, R., R. O’Brien, D. Cooper, and M. Luengo-Prado. “A Penny Saved Is Mobility Earned: Advancing Economic Mobility through Savings.” Pew Charitable Trust Economic Mobility Project, November 2009. https://www.pewtrusts.org/~/media/legacy/uploadedfiles/pcs_assets/2009/empsavingsreportpdf.pdf.
Cunningham, J. “Little Use of Treatment Among Problem Gamblers.” Psychiatric Services 56, no. 8 (2005): 1024a–25. https://ps.psychiatryonline.org/doi/full/10.1176/appi.ps.56.8.1024-a.
Dadayan, L. “Are States Betting on Sin? The Murky Future of State Taxation.” Urban-Brookings Tax Policy Center, October 2019. https://www.urban.org/sites/default/files/publication/101132/are_states_betting_on_sin-the_murky_future_of_state_taxation.pdf.
———. “State Revenues from Gambling: Short-Term Relief, Long-Term Disappointment.” Rockefeller Institute, April 2016. https://rockinst.org/wp-content/uploads/2017/11/2016-04-12-Blinken_Report_Three-min.pdf.
Daley, A. “Income and the Mental Health of Canadian Mothers: Evidence from the Universal Child Care Benefit.” SSM—Population Health 3 (December 2017): 674–83. https://doi.org/10.1016/j.ssmph.2017.08.002.
Demirguc-Kunt, A., L. Klapper, D. Singer, and P. Van Oudheusden. “The Global Findex Database 2014: Measuring Financial Inclusion Around the World.” World Bank Group, Development Research Group, Finance and Private Sector Development Team, Policy Research Working Paper 7255, April 2015. http://documents1.worldbank.org/curated/en/187761468179367706/pdf/WPS7255.pdf.
Despard, M.R., D.C. Perantie, J. Oliphant, and M. Grinstein-Weiss. “Do EITC Recipients Use Tax Refunds to Get Ahead? New Evidence from Refund to Savings.” Center for Social Development Research Brief 15-38, July 2015. https://community-wealth.org/content/do-eitc-recipients-use-tax-refunds-get-ahead-new-evidence-refund-savings.
Di Matteo, L. “The Fiscal Wages of Sin.” Finances of the Nation, January 15, 2021. https://financesofthenation.ca/2021/01/15/the-fiscal-wages-of-sin/.
Dieleman, W.W., S. Draayer, H.G. Etingh, J.R.J. Klein, and T. Minnema. “Report 28: Committee to Study the Problem of Gambling.” In Acts of Synod 1992. Grand Rapids, MI: Christian Reformed Church in North America, 1992. https://www.calvin.edu/library/database/crcnasynod/1992agendaacts.pdf.
Dijkema, B., and J. Lewis. “Pressing Its Luck: How Ontario Lottery and Gaming Can Work for, not against, Low-Income Households.” Cardus, 2020. https://www.cardus.ca/research/work-economics/reports/pressing-its-luck/.
———. Royally Flushed (series). Cardus, 2020. https://www.cardus.ca/topic/gambling/.
Dijkema, B., and R. McKendry. “Banking on the Margins: Finding Ways to Build an Enabling Small-Dollar Credit Market.” Cardus, 2016. https://www.cardus.ca/research/work-economics/reports/banking-on-the-margins/.
Doiron, J. “Gambling and Problem Gambling in Prince Edward Island.” Report submitted to the Prince Edward Island Department of Health, February 2006. http://www.gov.pe.ca/photos/original/doh_GambReport.pdf.
Doorways to Dreams Fund. “A Winning Proposition: Creating Economic Opportunities Through the State Lottery.” February 2013. https://buildcommonwealth.org/assets/downloads/D2D_Lottery_WhitePaper_Revision.pdf.
Doughney, J. “Ethical Blindness, EGMs and Public Policy: A Tentative Essay Comparing the EGM and Tobacco Industries.” International Journal of Mental Health & Addiction 5 (2007): 311–15. http://dx.doi.org/10.1007/s11469-007-9067-7.
Dubner, S.J., and B. Lam. “Is America Ready for a ‘No-Lose Lottery’? (Update).” Freakonomics, November 22, 2017. https://freakonomics.com/podcast/say-no-no-lose-lottery-rebroadcast/.
Edin, K., L. Tach, and S. Halpern-Meekin. “Tax Code Knowledge and Behavioural Responses Among EITC Recipients: Policy Insights from Qualitative Data.” Journal of Policy Analysis and Management 33, no. 2 (Spring 2014): 413–39. https://doi.org/10.1002/pam.21739.
Eissa, N., and H.W. Hoynes. “Behavioral Responses to Taxes: Lessons from the EITC and Labor Supply.” Tax Policy and the Economy 20 (2006): 73–110. https://doi.org/10.1086/tpe.20.20061905.
Eissa, N., and J.B. Liebman. “Labour Supply Response to the Earned Income Tax Credit.” Quarterly Journal of Economics 111, no. 2 (May 1996): 605–37. https://doi.org/10.2307/2946689.
Elliot, M. “IDA Accessibility: Learning More About Whether Individual Development Accounts Can Work for Canada’s Poor.” Theses and Dissertations (Comprehensive) 864, 2007. https://scholars.wlu.ca/etd/864.
Family Services of Greater Vancouver. “Coaching and Workshops.” Accessed February 25, 2021. https://fsgv.ca/programs/financial-empowerment-2/coaching-workshops/.
Feldman, G. “Saving from Poverty: A Critical Review of Individual Development Accounts.” Critical Social Policy 38, no. 2 (2018): 181–200. https://doi.org/10.1177/0261018317695451.
Filiz-Ozbay, E., J. Guryan, K. Hyndman, M. Kearney, and E.Y. Ozbay. “Do Lottery Payments Induce Savings Behavior? Evidence from the Lab.” Journal of Public Economics 126 (2015): 1–24. https://doi.org/10.1016/j.jpubeco.2015.02.007.
Fortin, N., D.A. Green, T. Lemieux, K. Milligan, and W.C. Riddell. “Canadian Inequality: Recent Development and Policy Options.” Canadian Public Policy 38, no. 2 (June 2012): 121–45.
Frank, S. “Casinos a Lazy Way to Deal with Economic Issues: Trent Professor.” MyKawartha, July 10, 2013. https://www.mykawartha.com/news-story/3886326-casinos-a-lazy-way-to-deal-with-economic-issues-trent-professor/.
Gamblers Anonymous. “Recovery Program.” Accessed July 31, 2019. http://www.gamblersanonymous.org/ga/content/recovery-program.
Gambling Research Exchange Ontario. “Gambling from a Public Health Perspective: About.” https://www.greo.ca/en/programs-services/PH-About.aspx?_mid_=26951.
Goodman-Bacon, A., and L. McGranahan. “How Do EITC Recipients Spend Their Refunds?” Economic Perspectives 32, no. 2 (2008). https://papers.ssrn.com/sol3/papers.cfm?abstract_id=1134060.
Gopnik, M., and D. Collins. “Emergency Savings: A Life Jacket in Rough Seas.” Commonwealth. August 25, 2020. https://buildcommonwealth.org/publications/emergency-savings-a-life-jacket-in-rough-seas.
Government of Australia, Productivity Commission. “Inquiry Report: Gambling.” 2010. https://www.pc.gov.au/inquiries/completed/gambling-2010/report.
Government of Canada. “Canada Child Benefit.” Accessed December 7, 2020. https://www.canada.ca/en/revenue-agency/services/child-family-benefits/canada-child-benefit-overview.html.
———. “Canada Workers Benefit—Overview.” Accessed December 7, 2020. https://www.canada.ca/en/revenue-agency/services/child-family-benefits/canada-workers-benefit.html.
———. “GST/HST Credit—Overview.” Accessed March 19, 2021. https://www.canada.ca/en/revenue-agency/services/child-family-benefits/goods-services-tax-harmonized-sales-tax-gst-hst-credit.html.
———. “Guaranteed Income Supplement: Overview.” Accessed December 7, 2020. https://www.canada.ca/en/services/benefits/publicpensions/cpp/old-age-security/guaranteed-income-supplement.html.
———. “Health Labels for Cigarettes and Little Cigars.” Accessed February 25, 2021. https://www.canada.ca/en/health-canada/services/publications/healthy-living/health-labels-cigarettes-little-cigars.html#info.
———. “New Health Labelling for Tobacco Packaging.” https://www.canada.ca/en/health-canada/programs/consultation-tobacco-labelling/document.html.
———. “Old Age Security: Overview.” Accessed December 7, 2020. https://www.canada.ca/en/services/benefits/publicpensions/cpp/old-age-security.html.
Government of the United Kingdom (GOV.UK). “Get Help with Savings if You’re on a Low Income (Help to Save).” Accessed August 6, 2020. https://www.gov.uk/get-help-savings-low-income.
———. “Get Help with Savings if You’re on a Low Income (Help to Save): Eligibility.” Accessed August 6, 2020. https://www.gov.uk/get-help-savings-low-income/eligibility.
———. “Get Help with Savings if You’re on a Low Income (Help to Save): How It Will Affect Your Benefits.” Accessed August 6, 2020. https://www.gov.uk/get-help-savings-low-income/how-it-will-affect-your-benefits.
Guillén, M.F., and A.E. Tschoegl. “Banking on Gambling: Banks and Lottery-Linked Deposit Accounts.” Journal of Financial Services Research 21, no. 3 (2002): 219–31. https://doi.org/10.1023/A:1015081427038.
Halpern-Meekin, S. “It’s Not Like I’m Poor: Perceptions of the Earned Income Tax Credit.” Federal Reserve Bank of Boston. Communities and Banking, Fall 2015, 8–9. https://www.bostonfed.org/-/media/Documents/cb/Halpern-Meekin-perceptions-of-the-earned-income-tax-credit.pdf.
Harding, A. “The Effect of Government Transfer Programs on Low-Income Rates: A Gender-Based Analysis, 1995 to 2016.” Statistics Canada Income Research Paper Series, Catalogue no. 75F0002M. https://www150.statcan.gc.ca/n1/en/pub/75f0002m/75f0002m2018003-eng.pdf?st=GVzJLW2d.
Harrigan, K. “Gap Analysis: Structural Characteristics of EGMs as Indirect Risk Factors for Problem Gambling Versus the Gaming Regulations.” Ontario Problem Gambling Research Centre, 2007. https://www.greo.ca/Modules/EvidenceCentre/Details/gap-analysis-structural-characteristics-egms-indirect-risk-factors-problem-gambling-versus-1.
Harrigan, K.A., D. Brown, J. Stapleton, K. Barton, A. Yazdani, N. Ayer, S. Brown, and S. Kalvapelle. “The Effect and Regulation of Electronic Gaming Machine Near Misses and Losses Disguised as Wins (LDWs) on Players.” Gambling Research Exchange, August 24, 2016. https://www.greo.ca/Modules/EvidenceCentre/Details/effect-and-regulation-electronic-gaming-machine-near-misses-and-losses-disguised-wins-ldws.
Harvey, P., N. Pettigrew, R. Madden, C. Emmerson, G. Tetlow, and M. Wakefield. “Final Evaluation of the Saving Gateway 2 Pilot: Main Report.” Research study conducted for HM Treasury/Department for Education and Skills, May 2007. https://discovery.ucl.ac.uk/id/eprint/18337/.
Hasan, S. “Labour Supply Response to the Working Income Tax Benefit (WITB): A Difference-in-Differences Approach.” MA thesis, Simon Fraser University, 2015. http://summit.sfu.ca/item/15353.
Henriksson, L.E., and R.G. Lipsey. “Should Provinces Expand Gambling?” Canadian Public Policy 25, no. 2 (June 1999): 259–75. https://doi.org/10.2307/3551892.
Hiscott, G. “Post Office to Stop Selling Premium Bonds—Where You Can Still Buy Them.” Mirror, June 25, 2015. https://www.mirror.co.uk/money/post-office-premium-bonds-where-to-buy-5947221.
Holmes, S.E. “Prize-Linked Savings: Balancing Near-Term Gains with Longer-Term Consequences.” MA thesis, George Washington University, 2017. https://search.proquest.com/openview/8a0410c763dd2cbdc6b344361398c7c0/1.pdf?pq-origsite=gscholar&cbl=18750&diss=y.
Hotz, V.J., and J.K. Scholz. “The Earned Income Tax Credit.” NBER Working Paper no. 8078, January 2001. https://www.nber.org/papers/w8078.
Institute for American Values. “An American Declaration on Government and Gambling.” 2012. http://www.americanvalues.org/search/item.php?id=790.
Ipsos MORI. “Final Synthesis Report: The Effect of Gambling Marketing and Advertising on Children, Young People and Vulnerable Adults.” March 2020. https://www.ipsos.com/sites/default/files/ct/publication/documents/2020-03/gambling-marketing-advertising-effect-young-people-final-report.pdf.
Jensen, C., M.J. Dixon, K.A. Harrigan, E. Sheepy, J.A. Fugelsang, and M. Jarick. “Misinterpreting ‘Winning’ in Multiline Slot Machine Games.” International Gambling Studies 13, no. 1 (2012): 112–26. https://doi.org/10.1080/14459795.2012.717635.
Jindapon, P., P. Sujarittanonta, and A. Viriyavipart. “Prize-Linked Savings Games: Theory and Experiment.” American University of Sharjah School of Business Administration Working Paper Series 07-09, 2018. https://dspace.aus.edu:8443/xmlui/handle/11073/16217.
John, D., S. Butler, and S. Rust. “Boosting Economic Mobility Through Prize-Linked Savings.” Heritage Foundation, May 29, 2013. https://www.heritage.org/economic-and-property-rights/report/boosting-economic-mobility-through-prize-linked-savings.
Jones, A. “Lotteries Struggle to Attract Millennial Players.” Maclean’s, July 10, 2016. https://www.macleans.ca/news/canada/lotteries-struggle-to-attract-millennial-players/.
Jones, L.E., and K. Michelmore. “The Impact of the Earned Income Tax Credit on Household Finances.” Journal of Policy Analysis and Management 37, no. 3 (2018): 521–45. https://dx.doi.org/10.2139/ssrn.2856627.
Jones, L.E., K.S. Milligan, and M. Stabile. “Child Cash Benefits and Family Expenditures: Evidence from the National Child Benefit.” NBER Working Paper no. 21101, April 2015. https://www.nber.org/papers/w21101.
Kearney, M., P. Tufano, J. Guryan, and E. Hurst. “Making Savers Winners: An Overview of Prize-Linked Savings Products.” NBER Working Paper 1644, 2010. http://www.nber.org/papers/w16433.
Kelly, G. “Welcome Back, Help to Save—What Took You So Long? (And What Should We Learn from this Saga?).” Medium, March 14, 2016. https://gavinkellyblog.com/welcome-back-help-to-save-what-took-you-so-long-and-what-should-we-learn-from-this-saga-eca8ccf8c2f.
Kingston, A. “Retirement 6/49.” Maclean’s, March 8, 2011. https://www.macleans.ca/news/canada/retirement-649/.
Kingwell, P., M. Dowie, B. Holler, and L. Jimenez. “Helping People Help Themselves: An Early Look at learn$ave.” Social Research and Demonstration Corporation, May 2004. http://www.srdc.org/publications/learnSave-project–Helping-People-Help-Themselves-An-Early-Look-at-learnave-details.aspx.
Kowalski, J. “Prize-Linked Savings Products: An Innovative Tool for Increasing Savings among Low-Income Households?” The Public Sphere: Journal of Public Policy 3, no. 2 (2015): 131–149. https://psj.lse.ac.uk/articles/abstract/36/.
Laurin, A. “Two-Parent Families with Children: How Effective Tax Rates Affect Work Decisions.” C.D. Howe Institute, January 9, 2018. https://www.cdhowe.org/sites/default/files/attachments/research_papers/mixed/METRs%20for%20Families%20E-Brief.pdf.
Lebihan, L., and C.O. Mao Takongmo. “Unconditional Cash Transfers and Parental Obesity.” Social Science and Medicine 224 (2019): 116–26. https://doi.org/10.1016/j.socscimed.2019.01.043.
Leckie, N., M. Dowie, and C. Gyorfi-Dyke. “Learning to Save, Saving to Learn: Early Impacts of the learn$ave Individual Development Accounts Project.” Social Research and Demonstration Corporation, 2008. http://www.srdc.org/publications/learnSave-Project–Learning-to-Save-Saving-to-Learn-Early-Impacts-of-the-learnave-Individual-Development-Accounts-Project-details.aspx.
Leckie, N., T.S. Hui, D. Tattrie, J. Robson, and J. Voyer. “Learning to Save, Saving to Learn: Final Report of the learn$ave Individual Development Accounts Project.” Social Research and Demonstration Corporation, 2010. http://www.srdc.org/publications/learnSave-project–Learning-to-Save-Saving-to-Learn-Final-Report-of-the-learnave-Individual-Development-Accounts-Project-details.aspx.
Lilley, B. “OLG Boss Sets the Tone for Out-of-Control Spending.” Toronto Sun, November 20, 2019. https://torontosun.com/opinion/columnists/lilley-olg-boss-sets-the-tone-for-out-of-control-spending.
———. “OLG Bosses Cash in Big while Workers Sit Idle.” Toronto Sun, August 14, 2020. https://torontosun.com/opinion/columnists/lilley-olg-bosses-cash-in-big-while-workers-sit-idle.
———. “OLG Prez on His Way out amid Dropping Profits, Questions on Expenses.” Toronto Sun, February 26, 2020. https://torontosun.com/opinion/columnists/lilley-olg-prez-quits-amid-dropping-profits-questions-on-expenses.
Livingstone, C. “How Electronic Gambling Machines Work: EGM Structural Characteristics.” Australian Institute of Family Studies. Australian Gambling Research Centre Discussion Paper 8, July 2017. https://aifs.gov.au/agrc/sites/default/files/publication-documents/1706_argc_dp8_how_electronic_gambling_machines_work.pdf.
Loibl, C., D. Kraybill, and S.W. DeMay, “Accounting for the Role of Habit in Regular Saving.” Journal of Economic Psychology 32 (2011): 581–92.
Loibl, C., M. Grinstein-Weiss, M. Zhan, and B. Red Bird. “More Than a Penny Saved: Long-Term Changes in Behavior Among Savings Program Participants.” Journal of Consumer Affairs 44, no. 1 (2010): 98–126. https://doi.org/10.1111/j.1745-6606.2010.01159.x.
MacNeil, J., P. O’Byrne, D. Croteau, H. Goudreault, T. Collins, and L. Huculak. “The False Eden of Gambling.” Western Catholic Reporter, January 12, 1998. https://www.wcr.ab.ca/This-Week/Stories/entryid/121.
Marinescu, I. “No Strings Attached: The Behavioral Effects of US Unconditional Cash Transfer Programs.” NBER Working Paper 24337, 2018. http://www.nber.org/papers/w24337.
Marionneau, V., and J. Nikkinen. “Does Gambling Harm or Benefit Other Industries? A Systematic Review.” Journal of Gambling Issues 44 (Spring 2020): 4–44. http://jgi.camh.net/index.php/jgi/article/view/4063/4514/.
McGill University. “Half of Canadians Don’t Have Enough Savings.” Newsroom: Institutional Communications. May 11, 2015. https://www.mcgill.ca/newsroom/channels/news/half-canadians-dont-have-enough-savings-250447.
McGranahan, L. “Tax Credits and the Debt Position of U.S. Households.” Federal Reserve Bank of Chicago Working Paper No. WP-2016-12, October 2016. https://www.chicagofed.org/publications/working-papers/2016/wp2016-12.
McKernan, S., C. Ratcliffe, B. Braga, and E.C. Kalish. “Thriving Residents, Thriving Cities: Family Financial Security Matters for Cities.” Urban Institute, 2016. https://www.urban.org/sites/default/files/publication/79776/2000747-thriving-residents-thriving-cities-family-financial-security-matters-for-cities_0.pdf.
Mendenhall, R., K. Edin, S. Crowley, J. Sykes, L. Tach, K. Kriz, and J.R. Kling. “The Role of Earned Income Tax Credit in the Budgets of Low-Income Households.” Social Science Review 86, no. 3 (2012): 367–400. https://www.journals.uchicago.edu/doi/abs/10.1086/667972.
Michigan Credit Union League. “Save To Win Celebrates 10 Years, $50 Million Saved in First Half of 2019.” July 23, 2019. https://www.mcul.org/News?article_id=29123.
Milligan, K. and M. Stabile. “Do Child Tax Benefits Affect the Well-Being of Children? Evidence from Canadian Child Benefit Expansions.” American Economic Journal: Economic Policy 3 (August 2011): 175–205. https://doi.org/10.1257/pol.3.3.175.
Momentum. “Asset Building: An Effective Poverty-Reduction Strategy.” January 2014. https://files.momentum.org/wp-content/uploads/2018/02/AssetBuilding.pdf.
———. “The Impact of Matched Savings Programs: Building Assets and Lasting Habits.” July 2020. https://files.momentum.org/wp-content/uploads/2020/07/23153212/The-Impact-of-Matched-Savings-Programs-2020-Final.pdf.
———. “Incentivized Saving: An Effective Approach at Tax Time.” November 2019. https://files.momentum.org/wp-content/uploads/2019/11/Incentivized-Savings-An-Effective-Approach-at-Tax-Time.pdf.
———. “Investing in Youth Pays Off: An Evaluation of the Youth Fair Gains Program.” September 2015. https://files.momentum.org/wp-content/uploads/2018/02/YFG-Investing-in-Youth.pdf.
———. “Matched Savings for Adults.” Accessed August 6, 2020. https://momentum.org/programs-services/manage-your-money/matched-savings-programs-for-adults/.
———. “Matched Savings for Youth.” Accessed February 25, 2021. https://momentum.org/programs-services/manage-your-money/matched-savings-for-youth/.
Moscovich, A. “Gambling with Our (Kids’) Futures: Gambling as a Family Policy Issue.” Vanier Institute of the Family, 2006. http://citeseerx.ist.psu.edu/viewdoc/download?doi=10.1.1.130.7727&rep=rep1&type=pdf.
National Savings and Investments. “Our Story.” Accessed December 9, 2020. https://nsandi-corporate.com/about-nsi/our-heritage-timeline#our_story.
———. “Premium Bonds.” Accessed April 1, 2021. https://www.nsandi.com/premium-bonds-25?ccd=NQBPAC.
Ontario Lottery and Gaming. “2018–19 Annual Report: Ontario Lottery and Gaming Corporation.” 2019. https://about.olg.ca/wp-content/uploads/2019/10/OLG-Annual-Report-2018-19_EN.pdf.
———. “Find a Casino.” Accessed February 25, 2021. https://www.olg.ca/en/casino/find-a-casino.html.
———. “Home Page.” Accessed February 12, 2021. https://www.olg.ca/en/home.html.
———. “Lottery Players Fact Sheet.” Accessed February 11, 2021. https://about.olg.ca/news-information/lottery-players-fact-sheet/.
———. “The Next Winner Could Be You.” Accessed April 14, 2021. https://www.olg.ca/content/dam/olg/web/product/winners/lottery/LT-120800-olg-winners-mega-nav-tile-Fred-975×500.png.
———. “OLG Annual Report 2017–18.” 2018. https://about.olg.ca/wp-content/uploads/2018/11/OLGAnnualReport-2017-18-en.pdf.
Ontario Ministry of Children, Community and Social Services. “Ontario Works.” Last modified November 2, 2020. https://www.mcss.gov.on.ca/en/mcss/programs/social/ow/index.aspx.
Ontario. “Rules for Selling Tobacco and Vapour Products.” https://www.ontario.ca/page/rules-selling-tobacco-and-vapour-products.
———. Smoke-Free Ontario Act, 2017, S.O. 2017, c. 26, Sched. 3. https://www.ontario.ca/laws/statute/17s26#BK3.
Parliamentary Budget Officer. “Household Indebtedness and Financial Vulnerability: Recent Developments and Outlook.” Office of the Parliamentary Budget Officer, 2017. https://www.pbo-dpb.gc.ca/web/default/files/Documents/Reports/2017/HH%20Vulnerability/HH_Vulnerability_EN.pdf.
Pearce, J., K. Mason, R. Hiscock, and P. Day. “A National Study of Neighbourhood Access to Gambling Opportunities and Individual Behaviour.” Journal of Epidemiology & Community Health 62, no. 10 (2008): 862–68. https://jech.bmj.com/content/62/10/862.
Peariso, R. “Youth Fair Gains.” Momentum (blog), November 14, 2017. https://momentum.org/youth-fair-gains/.
Pega, F., S.Y. Liu, S. Walter, R. Pabayo, R. Saith, and S.K. Lhachimi. “Unconditional Cash Transfers for Reducing Poverty and Vulnerabilities: Effect on Use of Health Services and Health Outcomes in Low- and Middle-Income Countries.” Cochrane Database of Systematic Reviews 11, no. CD011135 (2017). https://doi.org/10.1002/14651858.CD011135.pub2.
Pew Charitable Trusts. “Can Contests Help Fill Americans’ Savings Gap? Access to and Adoption of Prize-Linked Programs in the United States.” November 9, 2018. https://www.pewtrusts.org/en/research-and-analysis/issue-briefs/2018/11/can-contests-help-fill-americans-savings-gap.
Pfiffelmann, M. “What Is the Optimal Design for Lottery-Linked Savings?” Applied Economics 45, no. 35 (2013): 4861–71. https://doi.org/10.1080/00036846.2013.804168.
Pontifical Council for Justice and Peace. Compendium of the Social Doctrine of the Church. Ottawa: Canadian Conference of Catholic Bishops, 2005.
Proactive Information Services. “Matched Savings Programs Evaluation Report 2014: Asset Building Programs.” Prepared for SEED Winnipeg, September 2014. http://prospercanada.org/prospercanada/media/enews/issue-18/SEED-ABP-Matched-Program-Evaluation-Report-September-2014.pdf.
PYMNTS. “Walmart to Customers: Get Stimulus Check Deposited in MoneyCard Account.” April 15, 2020. https://www.pymnts.com/walmart/2020/walmart-customers-get-stimulus-check-deposited-moneycard-account/.
Pyper, W. “Payday Loans.” Perspectives on Labour and Income 8, no. 4 (April 2007). https://www150.statcan.gc.ca/n1/pub/75-001-x/10407/4096812-eng.htm.
QUBER. “Terms and Conditions.” Last updated November 19, 2019. https://www.quber.ca/terms.
Rablen, M.D. “The Saving Gateway: Implications for Optimal Saving.” Fiscal Studies 31, no. 2 (2010): 203–25. https://doi.org/10.1111/j.1475-5890.2010.00112.x.
Raschke, C. “The Impact of the German Child Benefit on Child Well-Being.” SOEPpaper No. 520, December 1, 2012. https://ssrn.com/abstract=2197764.
———. “The Impact of the German Child Benefit on Household Expenditures and Consumption.” German Economic Review 7, no. 4 (November 2016): 438–477. https://doi.org/10.1111/geer.12079.
Robson, J. “Assets in the New Government of Canada Poverty Dashboard: Measurement Issues and Policy Implications.” Canadian Economics Association, May 31, 2019. https://www.dropbox.com/s/4ty0pqay5vkuq7j/Presentation_Robson_CEA2019.pdf?dl=0.
Robson, J., and D. Rothwell. “A Tale of Two Trends.” Policy Options, May 4, 2015. https://policyoptions.irpp.org/magazines/is-it-the-best-of-times-or-the-worst/rothwell-robson/.
Rolland, K.L. “D2D Tests Innovations on Prize-Linked Savings, Mobile Phone Applications, and Prepaid Cards for Financially Vulnerable Consumers.” Federal Reserve Bank of Philadelphia. Cascades 87 (Spring 2015): 3–5. https://www.philadelphiafed.org/-/media/frbp/assets/community-development/articles/cascade/87/cascade_no-87.pdf.
Rothwell, D., and J. Robson. “The Prevalence and Composition of Asset Poverty in Canada: 1999, 2005, and 2012.” International Journal of Social Welfare 27, no. 1 (January 2018): 17–27. https://doi.org/10.1111/ijsw.12275.
Rothwell, D., and N. Sultana. “Cash-Flow and Savings Practices of Low-Income Households: Evidence from a Follow-Up Study of IDA Participants.” Journal of Social Science Research 39, no. 2 (2013): 281–92. https://doi.org/10.1080/01488376.2012.754828.
Rush, B., R. Shaw Moxam, and K. Urbanoski. “Characteristics of People Seeking Help from Specialized Programs for the Treatment of Problem Gambling in Ontario.” Journal of Gambling Issues 6 (2002). http://jgi.camh.net/index.php/jgi/article/view/3598/3558.
Rush, B., S. Veldhuizen, and E. Adlaf. “Mapping the Prevalence of Problem Gambling and Its Association with Treatment Accessibility and Proximity to Gambling Venues.” Journal of Gambling Issues 20 (2007): 193–214. http://jgi.camh.net/index.php/jgi/article/view/3771/3746.
Save To Win. “Frequently Asked Questions.” https://www.savetowin.org/frequently-asked-questions.
Scott, G.F. “34% of Canadians Plan to Retire by Winning the Lottery.” January 30, 2014. https://www.canadianbusiness.com/blogs-and-comment/retirement-lottery/.
SEED Winnipeg. “IDA Booklet.” Accessed February 25, 2021. https://seedwinnipeg.ca/files/IDA_booklet_.pdf.
———. “Individual Development Account.” Accessed August 6, 2020. http://seedwinnipeg.ca/programs/detail/individual-development-account.
———. “Inner City Homebuyer Program.” Accessed April 1, 2021. https://seedwinnipeg.ca/programs/detail/inner-city-homebuyer-ida-program.
———. “Saving Circle.” Accessed August 6, 2020. http://seedwinnipeg.ca/programs/detail/saving-circle.
———. “Saving Circle Booklet.” Accessed February 25, 2021. https://seedwinnipeg.ca/files/SC_Booklet_.pdf.
Shaefer, H.L., X. Song, and T.R. Williams Shanks. “Do Single Mothers in the United States Use the Earned Income Tax Credit to Reduce Unsecured Debt?” Review of Economics of the Household 11 (2013): 659–80. https://doi.org/10.1007/s11150-012-9144-y.
Sherraden, M. Assets and the Poor: A New American Welfare Policy. Armonk, NY: M.E. Sharpe, 1991.
———. “Innovations in Asset Building.” Asia Pacific Journal of Social Work and Development 24, no. 3 (2014): 196–204. https://doi.org/10.1080/02185385.2014.947672.
Sherraden, M.S., and A.M. McBride. Striving to Save: Creating Policies for Financial Security of Low-Income Families. Ann Arbor: University of Michigan Press, 2010.
Shillington, R. “Are Low-Income Savers Still in the Lurch? TFSAs at 10 Years.” IRPP Insight 27. Institute for Research on Public Policy, 2019. https://irpp.org/research-studies/are-low-income-savers-still-in-the-lurch-tfsas-at-10-years/.
Skalar, A., and J. Derevensky. “Way to Play: Analyzing Gambling Ads for Their Appeal to Underage Youth.” Canadian Journal of Communication 35, no. 4 (2010): 533–54. https://doi.org/10.22230/cjc.2010v35n4a2331.
Smeeding, T.M., K.R. Phillips, and M. O’Connor. “The EITC: Expectation, Knowledge, Use, and Economic and Social Mobility.” National Tax Journal 53, no. 4 (December 2000): 1187–1209. https://www.jstor.org/stable/41789514?seq=1#metadata_info_tab_contents.
Social and Enterprise Development Innovations (SEDI). “Financial Capability and Poverty: Discussion Paper.” Policy Research Initiative Project: New Approaches for Addressing Poverty and Exclusion, July 2004. http://en.copian.ca/library/research/sedi/financial_capability/financial_capability.pdf.
———. “Financial Empowerment: Proven Strategies for Reducing Poverty in Ontario.” Submission to the Ontario Ministry of Child and Youth Services, October 4, 2013. https://prospercanada.org/getattachment/eaa0b47a-07dc-45bd-b273-b8563d00494e/Financial-Empowerment-Proven-Strategies-for-Reduci.aspx.
Statistics Canada. “Household Economic Well-Being During the COVID-19 Pandemic, Experimental Estimates, First Quarter to Third Quarter of 2020.” March 1, 2021. https://www150.statcan.gc.ca/n1/daily-quotidien/210301/dq210301b-eng.htm.
———. “One-Quarter of Canadian Businesses Had at Least Some E-Commerce Sales in 2019.” November 23, 2020. https://www150.statcan.gc.ca/n1/daily-quotidien/201123/dq201123a-eng.htm.
———. “Table 11-10-0135-01: Low Income Statistics by Age, Sex and Economic Family Type.” Accessed March 19, 2021. https://www150.statcan.gc.ca/t1/tbl1/en/tv.action?pid=1110013501.
———. “Table 11-10-0193-01: Upper Income Limit, Income Share and Average of Adjusted Market, Total and After-Tax Income by Income Decile.” Accessed August 26, 2020. https://www150.statcan.gc.ca/t1/tbl1/en/tv.action?pid=1110019301.
———. “Table 11-10-0223-01: Household Spending by Household Income Quintile, Canada, Regions and Provinces.” Accessed August 26, 2020. https://www150.statcan.gc.ca/t1/tbl1/en/tv.action?pid=1110022301.
Struthers, A., C. Metge, C. Charette, J.E. Enns, N.C. Nickel, D. Chateau, M. Chartier, E. Burland, A. Katz, and M. Brownell. “Understanding the Particularities of an Unconditional Prenatal Cash Benefit for Low-Income Women: A Case Study Approach.” Journal of Health Care Organization, Provision, and Financing 56 (2019): 1–12. https://dx.doi.org/10.1177%2F0046958019870967.
Suurvali, H., D. Hodgins, and J. Cunningham. “Motivators for Resolving or Seeking Help for Gambling Problems: A Review of the Empirical Literature.” Journal of Gambling Studies 26 (2010): 1–33. https://link.springer.com/article/10.1007/s10899-009-9151-y.
Suurvali, H., D. Hodgins, T. Toneatto, and J. Cunningham. “Treatment Seeking Among Ontario Problem Gamblers: Results of a Population Survey.” Psychiatric Services 59, no. 11 (November 2008): 1343–46. https://pubmed.ncbi.nlm.nih.gov/18971414/.
TD Bank Group Newsroom. “Ontario Boomers Not Ready for Retirement.” January 5, 2011. http://td.mediaroom.com/index.php?s=19518&item=36150.
Tong, H.H.Y., and D. Chim. “The Relationship Between Casino Proximity and Problem Gambling.” Asian Journal of Gambling Issues and Public Health 3, no. 2 (2013): 1–17. http://www.ajgiph.com/content/3/1/2.
Toronto Public Health. “Position Statement: Gambling and Health.” November 2012. https://www.toronto.ca/legdocs/mmis/2012/hl/bgrd/backgroundfile-51872.pdf.
Tourism Burlington. “OLG Slots.” Accessed April 14, 2021. https://tourismburlington.com/partner/olg-slots/.
Tucker, J.N., C.C. Key, and M. Grinstein-Weiss. “The Benefits of Saving at Tax Time: Evidence from the $aveNYC Evaluation.” Journal of Socio-Economics 48 (February 2014): 50–61. https://doi.org/10.1016/j.socec.2013.08.011.
Tufano, P. “Saving Whilst Gambling: An Empirical Analysis of UK Premium Bonds.” American Economic Review: Papers & Proceedings 98, no. 2 (2008): 321–26. https://doi.org/10.1257/aer.98.2.321.
Tufano, P., J. De Neve, and N. Maynard. “U.S. Consumer Demand for Prize-Linked Savings: New Evidence on a New Product.” Economics Letters 111 (2011): 116–18. https://doi.org/10.1016/j.econlet.2011.01.019.
Vancity. “Savings and Investments.” Accessed August 6, 2020. https://www.vancity.com/AboutVancity/VisionAndValues/ValuesBasedBanking/FinancialLiteracyAndBasicBanking/SavingsAndInvestments/.
Vasiliadis, S.D., A.C. Jackson, D. Christensen, and K. Francis. “Physical Accessibility of Gaming Opportunity and Its Relationship to Problem Gambling: A Systematic Review.” Journal of Gambling Issues 28 (2013): 1–46. https://doi.org/10.4309/jgi.2013.28.2.
Voyer, J. “Impacts of a Matched Saving Program to Induce Low-Income Adults to Pursue Further Education: Final Results from the learn$ave Experiment.” Social Research and Demonstration Corporation. Presentation to the Canadian Evaluation Society Conference, May 2010. https://evaluationcanada.ca/distribution/20100504_voyer_jean_pierre.pdf.
Walker, R. “How to Trick People into Saving Money.” The Atlantic, May 2017. https://www.theatlantic.com/magazine/archive/2017/05/how-to-trick-people-into-saving-money/521421/.
Walmart. “Two Years Later, Walmart’s Prize Savings Helps Customers Save $2 Billion.” April 4, 2019. https://corporate.walmart.com/newsroom/2019/04/04/two-years-later-walmarts-prize-savings-helps-customers-save-2-billion.
———. “Walmart and Green Dot Unveil First National Prize-Linked Savings Program.” December 15, 2016. https://corporate.walmart.com/newsroom/2016/12/15/walmart-and-green-dot-unveil-first-national-prize-linked-savings-program.
———. “Walmart MoneyCard Prize Savings Sweepstakes: Official Rules.” Accessed December 8, 2020. https://www.walmartmoneycard.com/legal-info/prize-savings.
Watford, A.E. “Save Now, Win Later: Removing Statutory Barriers to Prize-Linked Savings Initiatives.” Vanderbilt Law Review 67, no. 3 (2014): 907–54. https://scholarship.law.vanderbilt.edu/vlr/vol67/iss3/6.
Welte, J., W. Wieczorek, G. Barnes, M. Tidwell, and J. Hoffman. “The Relationship of Ecological and Geographic Factors to Gambling Behaviour and Pathology.” Journal of Gambling Studies 20, no. 4 (Winter 2004): 405–23. https://pubmed.ncbi.nlm.nih.gov/15577275/.
Welte, J.W., G.M. Barnes, M.O. Tidwell, J.F. Hoffman, and W.F. Wieczoreck. “The Relationship Between Distance from Gambling Venues and Gambling Participation and Problem Gambling Among U.S. Adults.” Journal of Gambling Studies 32 (2016): 1055–63. https://doi.org/10.1007/s10899-015-9583-5.
Williams, R.J., and R.A. Volberg. “Gambling and Problem Gambling in Ontario.” Report prepared for the Ontario Problem Gambling Research Centre and the Ontario Ministry of Health and Long-Term Care, June 2013. http://hdl.handle.net/10133/3378.
Williams, R.J., and R.T. Wood. “What Proportion of Gambling Revenue Is Derived from Problem Gamblers?” Presentation to the Alberta Gambling Research Institute Conference. Banff, Alberta, 2016. https://prism.ucalgary.ca/bitstream/handle/1880/51141/Williams_AGRI2016_What_Proportion_of_Gambling_Revenue_is_Derived_from_PG.pdf?sequence=18.
Williams, R.J., B.L. West, and R.I. Simpson. “Prevention of Problem Gambling: Review of the Evidence and Identified Best Practices.” Report prepared for the Ontario Problem Gambling Research Centre and the Ontario Ministry of Health and Long-Term Care, October 2012. https://opus.uleth.ca/handle/10133/3121.
Williams, R.J., C.A. Leonard, Y.D. Belanger, D.R. Christensen, N. el-Guebaly, D.C. Hodgins, D.S. McGrath, F. Nicoll, and R.M.G. Stevens. “Gambling and Problem Gambling in Canada in 2018: Prevalence and Changes Since 2002.” Canadian Journal of Psychiatry (2020): 1–10. https://doi.org/10.1177/0706743720980080.
Williams, R.J., J. Rehm, and R.M.G. Stevens. “The Social and Economic Impacts of Gambling.” Final Report prepared for the Canadian Consortium for Gambling Research, March 2011. https://opus.uleth.ca/handle/10133/1286.
Williams, R.J., Y.D. Belanger, and J.N. Arthur. “Gambling in Alberta: History, Current Status, and Socioeconomic Impacts.” Final report to the Alberta Gaming Research Institute, April 2, 2011. https://prism.ucalgary.ca/handle/1880/48495.
World Bank. “The Global Findex Database 2017.” 2018. https://globalfindex.worldbank.org/.