
Table of Contents
Table of Contents
Executive Summary
This study presents the hypothetical economic costs of funding Ontario’s independent schools, if the province were to fully fund the sector or apply any of the existing partial-funding models in Canada.
But before conducting the cost analysis, we first establish context and ask, Why should Ontario fund students at independent schools? Simply, as education is a socially formational good, society has a general interest in the education of the next generation of citizens. It is on this basis that taxes are raised to fund any child’s education. But as a morally formational good, parents have a prior and universal right to choose—and deeply personal interest in—their child’s education, and thus these public funds should follow families to their preferred school. Accordingly, funding is the norm around the world, as well as in Canada. Globally, 73 percent of countries at least partially fund independent schools—only one OECD country does not. In Canada outside Ontario, 75 percent of independent schools and 84 percent of independent-school students are partially publicly funded. Put differently, Ontario’s lack of funding is anomalous in both a global and Canadian context. We discuss the four main objections to funding and conclude that Ontario’s lack of financial support for independent-school students is an unjust and inequitable policy—uncharacteristic of a democratically elected government, especially in an advanced economy—that further disadvantages the already disadvantaged.
To rectify this eccentric and unjust policy, there are seven funding schemes, all taken from actual practice in Canada, to estimate the cost of funding students in Ontario’s independent schools. The first applies full government funding to Ontario’s independent sector. Alternatively, Ontario can partially fund independent schools using a similar approach as any of the other provinces that partially fund this sector—from west to east: British Columbia, Alberta, Saskatchewan (two models), Manitoba, and Quebec. (In each of the seven funding schemes, the model recognizes that not all independent schools would qualify for or accept government funding, and this fact is accounted for in the analyses.)
Each cost estimate factors into the respective model three plausible enrolment scenarios—our best estimates of the lower bound (scenario 1), most plausible case (scenario 2), and upper bound (scenario 3) of first-year enrolment levels that will result from implementing any of the seven options. Scenario 1 is based on no change in enrolments. Scenario 2 assumes a 7.8 percent first-year increase in enrolment, based on the experience of a short-lived Ontario policy introduced twenty years ago. And scenario 3 assumes an 18.3 percent first-year increase in enrolment, based on the most recent Canadian experience of a similar policy change—Saskatchewan’s expansion of funding for independent schools through the creation of the new Qualified independent school category.
Applying these three scenarios to each of the seven provincial funding schemes results in twenty-one cost estimations, ranging between $535.2 million and $1.539 billion in net annual cost to Ontario taxpayers. For context, within the scope of Ontario’s $186 billion annual budget, this is around 1/3 to 4/5 of 1 percent (0.3% to 0.8%) of the budget. In other words, any of these funding options is a relatively minimal cost to substantially benefit the families who need it most.
This paper presents seven analyses of the hypothetical cost of funding independent schools in Ontario. But first, justification for funding independent schools is essential, given the persistent—and, as we argue, eccentric—opposition to such a policy in Ontario. We need to put Ontario’s lack of funding in context.

Ontario Education in a Global Context
Ontario is a global outlier (with the Atlantic provinces of Canada) in its lack of taxpayer funding for non-government schools. In advanced economies, and particularly in Western democracies, publicly financing (at least partially) the operation of non-government schools—usually referred to, in Canada, as independent schools or private schools—is the norm. In a global analysis of education systems in 136 countries, representing 94 percent of the world’s population, 100 countries (73%) at least partially fund non-government schools. 1 1 Organization International pour la Liberté Educative (OIDEL), “Freedom of Education Index: Worldwide Report 2016 on Freedom of Education,” Novae Terrae Foundation, 2016, 315–16, 323, https://www.oidel.org/wordpress/wp-content/uploads/2016/02/FEI_complet2.pdf. Within OECD member countries, an average 58 percent of the total funding of privately managed schools comes through the government. 2 2 L. Boeskens, “Regulating Publicly Funded Private Schools: A Literature Review on Equity and Effectiveness,” OECD Education Working Papers 147: 10, http://dx.doi.org/10.1787/5jln6jcg80r4-en. Greece is the only OECD member that does not fund non-government schools. 3 3 OIDEL, “Freedom of Education Index,” 144, 315–16. In Sweden, Finland, and the Netherlands, government sources fund over 95 percent of privately managed schools’ total costs. In the Slovak Republic and Hong Kong, the funding is marginally lower, at 92 percent and 91 percent, respectively. And privately managed schools in Slovenia, Germany, Belgium, Luxembourg, Ireland, and Hungary receive between 80 percent and 90 percent of their funding from government sources. 4 4 Boeskens, “Regulating Publicly Funded Private Schools,” 10. Similarly, governments in Denmark, 5 5 Denmark’s long tradition of funding independent schools dates as far back as 1855 (M.K. Justesen, “Learning from Europe: The Dutch and Danish School Systems,” Adam Smith Institute, 2002). the United Kingdom, Korea, and Malta financially aid non-government schools’ investment costs (e.g., buildings and equipment), in addition to subsidizing teachers’ salaries and the school operating costs (e.g., heating, electricity, cleaning). 6 6 OIDEL, “Freedom of Education Index,” 27, 315.
To the above, there is nuance beyond the scope of this study, as no two school systems are precisely alike. But suffice to say, in their international comparative study of education systems around the world, scholars Charles Glenn and Jan de Groof found that there are “at least 65 ways to organize an education system.” 7 7 C.L. Glenn and J. de Groof, Balancing Freedom, Autonomy, and Accountability in Education (Nijmegen: Wolf Legal Publishers, 2012), 2:7. And in the United States alone, EdChoice notes, “there are currently 69 private school choice programs and policies operating in 33 states, Washington, D.C., and Puerto Rico, with more than 1,355,152 families participating across the country.” 8 8 EdChoice, “The 123s of School Choice: What the Research Says About Private School Choice Programs in America,” April 15, 2021, https://www.edchoice.org/research/the-123s-of-school-choice-2/. Similarly, Canada’s five provincial education systems that partially fund independent schools do so in different ways.
The key takeaway is that the established norm in other countries, especially industrially developed democracies, is to publicly fund the education of all students, including those in independent schools. The Ontario government’s lack of financial support for independent schools and the students who attend them is uncharacteristic of a democratically elected government, especially in an advanced economy.
Rationale for Funding Independent Schools
Why is public funding for independent schools the global standard? To start, we need to answer why taxpayers, anywhere, fund the education of their neighbours’ children. But also, we must examine why such funding ought to follow students to their preferred school, even if operated independently of the government.
Scholar Ashley Berner answers the first point:
Why should taxpayers support the education of other people’s children? In democracies, the answer comes down to this: other people’s children’s lives (including workforce participation and social well-being) and political involvement (understanding democratic institutions, analyzing legislation, and voting) shape ours. Since the late eighteenth and early nineteenth centuries, governments have rested their case for public education here. It is not surprising that the imperative to expand the general public’s knowledge and know-how coincided with the expansion of the right to vote. 9 9 A.R. Berner, “Good Schools, Good Citizens: Do Independent Schools Contribute to Civic Formation?,” Cardus, June 2021, https://www.cardus.ca/research/education/reports/good-schools-good-citizens/.
In other words, whether or not someone has a high-quality education is not merely of interest to a particular individual or family but to all of society. In economic terms, education is a merit good: It has spillover effects that benefit more than just the recipient. But the reasoning goes even further than that. Education is not only of interest to society; it is a function of society. Thus, publicly funded education is a social good instituted for the common good, even if administered privately. As Abraham Kuyper says,
Education touches on one of the most complicated and intricate questions, one that involves every issue, including the deepest issues that invite humanity’s search for knowledge—issues of anthropology and psychology, religion and sociology, pedagogy and morality, in short, issues that encroach upon every branch of social life. 10 10 A. Kuyper, On Education, ed. Wendy Naylor and Harry Van Dyke (Bellingham, WA: Lexham, 2019), xxii.

Simply, education is elemental to all social and cultural life. Education is formational. This has two implications.
First, as a socially formational good, the education of each citizen matters. From a policy perspective, this need not imply that the government must or even should provide for the education of all its citizens through state-owned and operated mechanisms. Social goods ought to emerge from civil society, independent of politics. But it does at the very least imply that a democratic civic society’s elected government ought to ensure that the basic costs of education are covered for each of its young citizens.
The second implication is that schools are moral ecosystems. This may partly explain why religious-school students matched to schools of their own faith outperform their unmatched peers, 11 11 C.R. Pakaluk, “What Good Is a Good Fit? Religious Matching and Educational Outcomes,” Cosmos + Taxis 9, no. 1–2 (2021): 3–30. and why Islamic schools are more effective than state-run schools at integrating Muslim students into Western societies. 12 12 M.D. Shakeel and P. Wolf, “Does Private Islamic Schooling Promote Terrorism? An Analysis of the Educational Background of Successful American Homegrown Terrorists,” EDRE Working Paper No. 2017-20 (2017): https://papers.ssrn.com/sol3/papers.cfm?abstract_id=3068968. Never neutral, schools instill particular views and values of what is “good” and meaningful, not only in what is taught but also in what is “caught”—whether they intend to or not. Parents intuitively know this, as evidenced in a recent pan-Canadian study of who chooses independent schools and why in BC, Ontario, and Alberta. 13 13 D. Hunt and D. Van Pelt, “Who Chooses Independent Schools in British Columbia and Why?” Cardus, August 2019, https://www.cardus.ca/research/education/reports/who-chooses-independent-schools-in-british-columbia-and-why/; D. Van Pelt, D. Hunt, and J. Wolfert, “Who Chooses Ontario Independent Schools and Why?” Cardus, September 2019, https://www.cardus.ca/research/education/reports/who-chooses-ontario-independent-schools-and-why/; D. Hunt and R. Leistra, “Who Chooses Alberta Independent Schools and Why?,” Cardus, September 2020, https://www.cardus.ca/research/education/reports/who-chooses-alberta-independent-schools-and-why/. Overall, the top motivation for parents choosing their independent schools is a supportive and nurturing environment, followed by school safety. As scholars James Davison Hunter and Ryan Olson write,
The environments that children grow up in and, thus, the variety of moral influences that shape them, are astonishingly diverse and . . . these environments have enormous bearing on how children develop morally. They constitute a complex moral ecology within which children are located and formed. 14 14 J.D. Hunter and R.S. Olson, “The Moral Ecology of Formation: Conclusions and Parting Questions,” in The Content of Their Character: Inquiries into the Varieties of Moral Formation, ed. J.D. Hunter and R.S. Olson (New York: Finstock & Tew, 2018), 245.
It is thus imperative—as stated in the UN Universal Declaration of Human Rights—for “parents [to] have a prior right to choose the kind of education that shall be given to their children.” 15 15 “The Universal Declaration of Human Rights,” United Nations General Assembly, 1948.p Perhaps Glenn and de Groof express it best:
Parents have a fundamental right to guide the development of their own children and therefore to choose a school in which they have full confidence. To deny that choice, or to make it impossibly difficult for parents of modest means, is unjust and unworthy of a free society. 16 16 C. Glenn and J. de Groof, Balancing Freedom, Autonomy and Accountability in Education (Nijmegen: Wolf Legal Publishers, 2012), vol. 3, back cover.
We see this foundational priority in the tenth recommendation of the Truth and Reconciliation Commission’s “call [for] the federal government to draft new Aboriginal education legislation . . . [that enables] parents to fully participate in the education of their children,”
17
17
Truth and Reconciliation Commission of Canada (TRC), “Calls to Action,” Government of Canada, 2015,
2, https://www2.gov.bc.ca/assets/gov/british-columbians-our-governments/indigenous-people/aboriginal-peoplesdocuments/calls_to_action_english2.pdf.
as well as the following recent statement on the modernization of education in the European Union:
The right to education includes the freedom to set up educational establishments, on a basis of due respect for democratic principles and for the right of parents to ensure that their children are educated and taught according to their religious, philosophical and pedagogical convictions. 18 18 European Parliament, “Resolution of 12 June 2018 on Modernisation of Education in the EU,” June 12, 2018, section J, https://www.europarl.europa.eu/doceo/document/TA-8-2018-0247_EN.html.
The Supreme Court of Canada has acknowledged in numerous cases, but most notably in Chamberlain (2002), that parents are naturally the best informed and best understand their child’s needs and well-being. Thus, parents ought to be—and by nature are—a child’s primary educators. Any state policy or programs play a supporting role. This is well established in Canadian law, as well as constitutionally protected in the Charter.
19
19
J.A. Lagos, “Parental Education Rights in the United States and Canada: Homeschooling and Its Legal Protection”
(PhD diss., Pontificia Universitas Sanctae Crucis, Facultas Iuris Canonici, Rome, 2011).
This right exists in all countries—except Cuba, Gambia, and Libya 20 20 OIDEL, “Freedom of Education Index,” 323. —but with a critical caveat: so long as parents can afford tuition. What about low-income, lone-parent households? What about other disadvantaged populations who cannot afford even modest tuition, such as is common in Ontario? Glenn writes elsewhere,
The right of families to choose schools for their children is first and foremost a question of freedom of conscience. It is a fundamental injustice to make the exercise of that right contingent upon the financial resources that each family has at its disposal. 21 21 C.L. Glenn, “What the United States Can Learn from Other Countries,” in What America Can Learn from School
Choice in Other Countries, ed. D.F. Salisbury and J. Tooley (Washington, DC: Cato Institute, 2005), 81.
Thomas D’Arcy McGee, father of section 93 of the Constitution Act, made similar arguments leading up to Confederation in the 1860s. In short, if schooling is compulsory and taxpayer funded, it is only right and just that faith communities receive support for their own schools alongside the common school system. 22 22 B. Fawcett, “Unchartered Territory: A Historical and Critical Analysis of Alberta’s Prohibition on Religious Charter Schools,” Cardus, April 2021, https://www.cardus.ca/research/education/reports/unchartered-territory/.
Equity is the issue. Ultimately, publicly funding all children’s education, and allowing those funds to follow the student to the school that best meets their needs, is a matter of equity. In Ontario, presently, only families who can afford tuition (or who can otherwise find support for the cost of their tuition) have access to independent schools. Not to mention, they have to pay for school twice: through their taxes and tuition. Although some independent schools rely on generous donors to provide bursaries to families in need or funds toward school operations such that tuition need only cover some part of the school’s revenue, the reality is that for many middle-class families and for most disadvantaged families in Ontario, independent schools are not an option. Directly and equitably providing funding for students in independent schools would remedy this injustice.
Ontario Education in a Pan-Canadian Context
But what is the norm in Canada? This section presents an overview of how funding varies across provinces, in terms of funding rates, share of provincial GDP, and share of provincial budgets. We establish context with enrolment share by province and conclude this section with a discussion on why rates vary.
Funding for Independent Schools in Canada
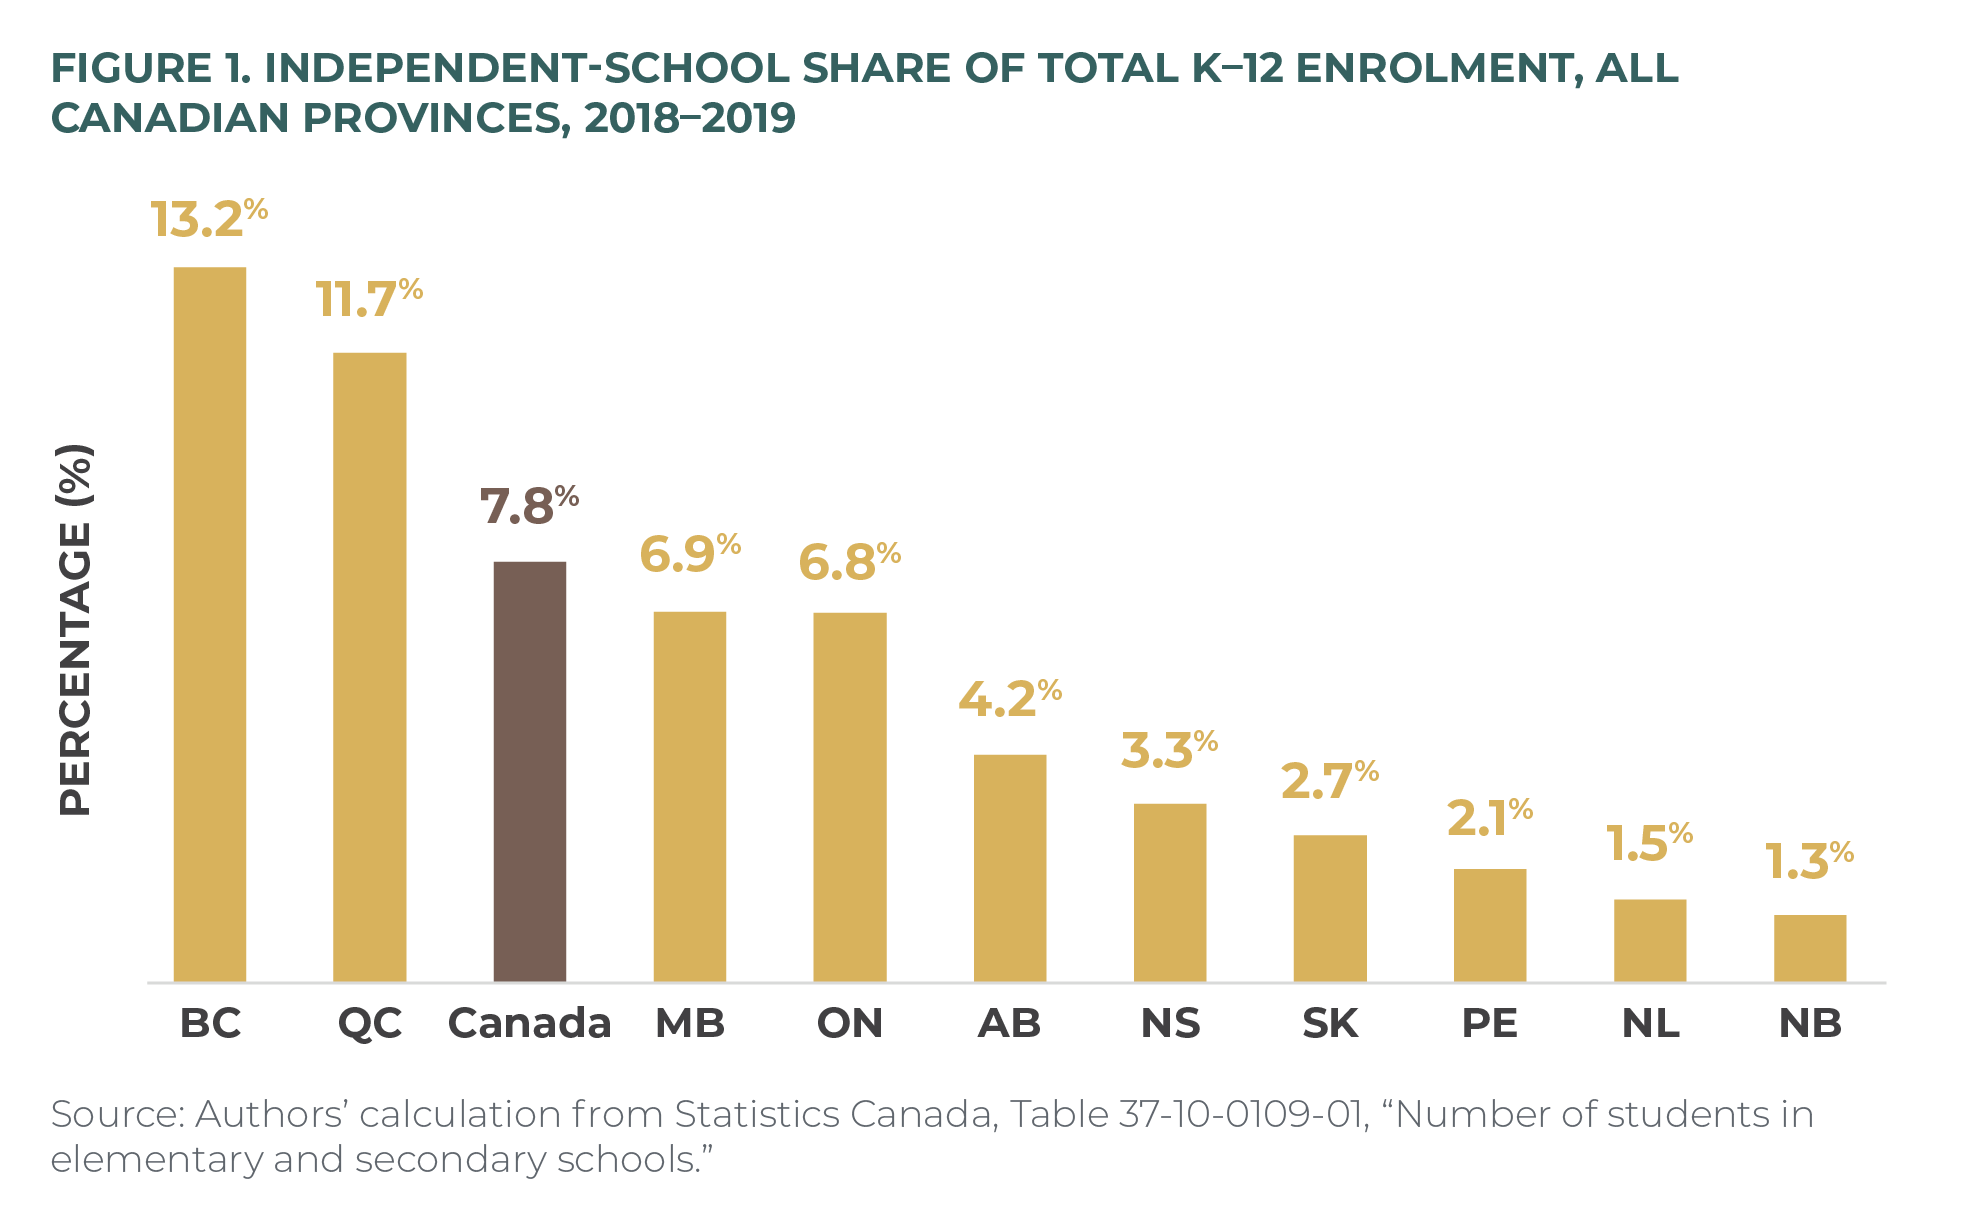
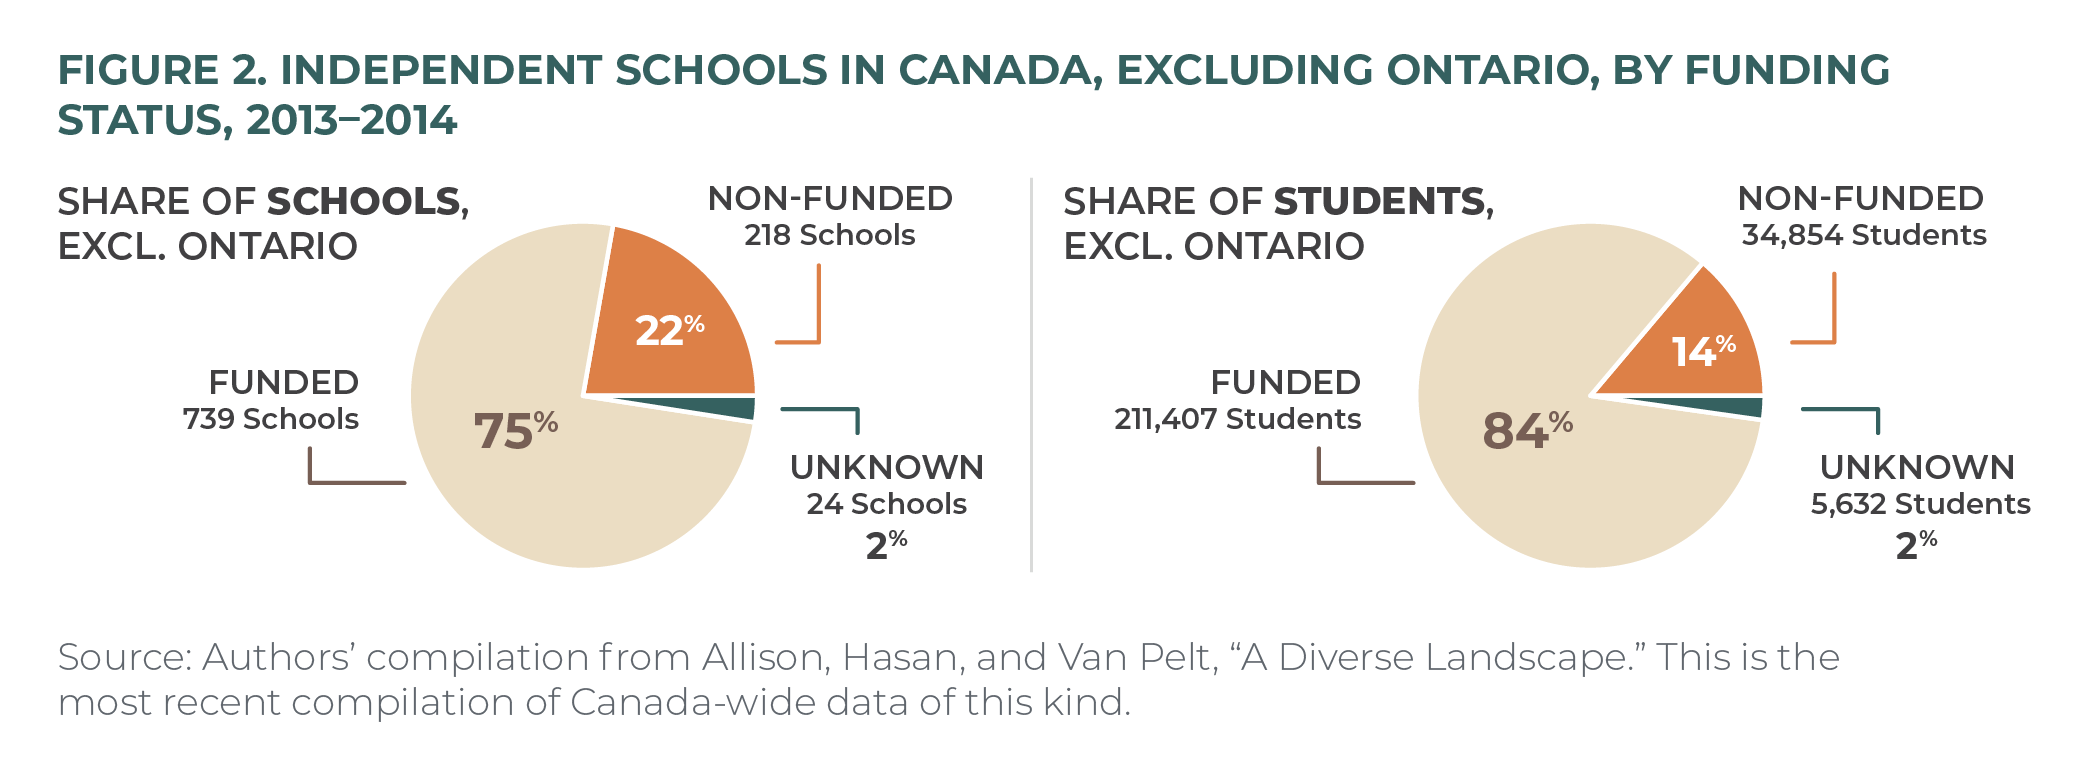
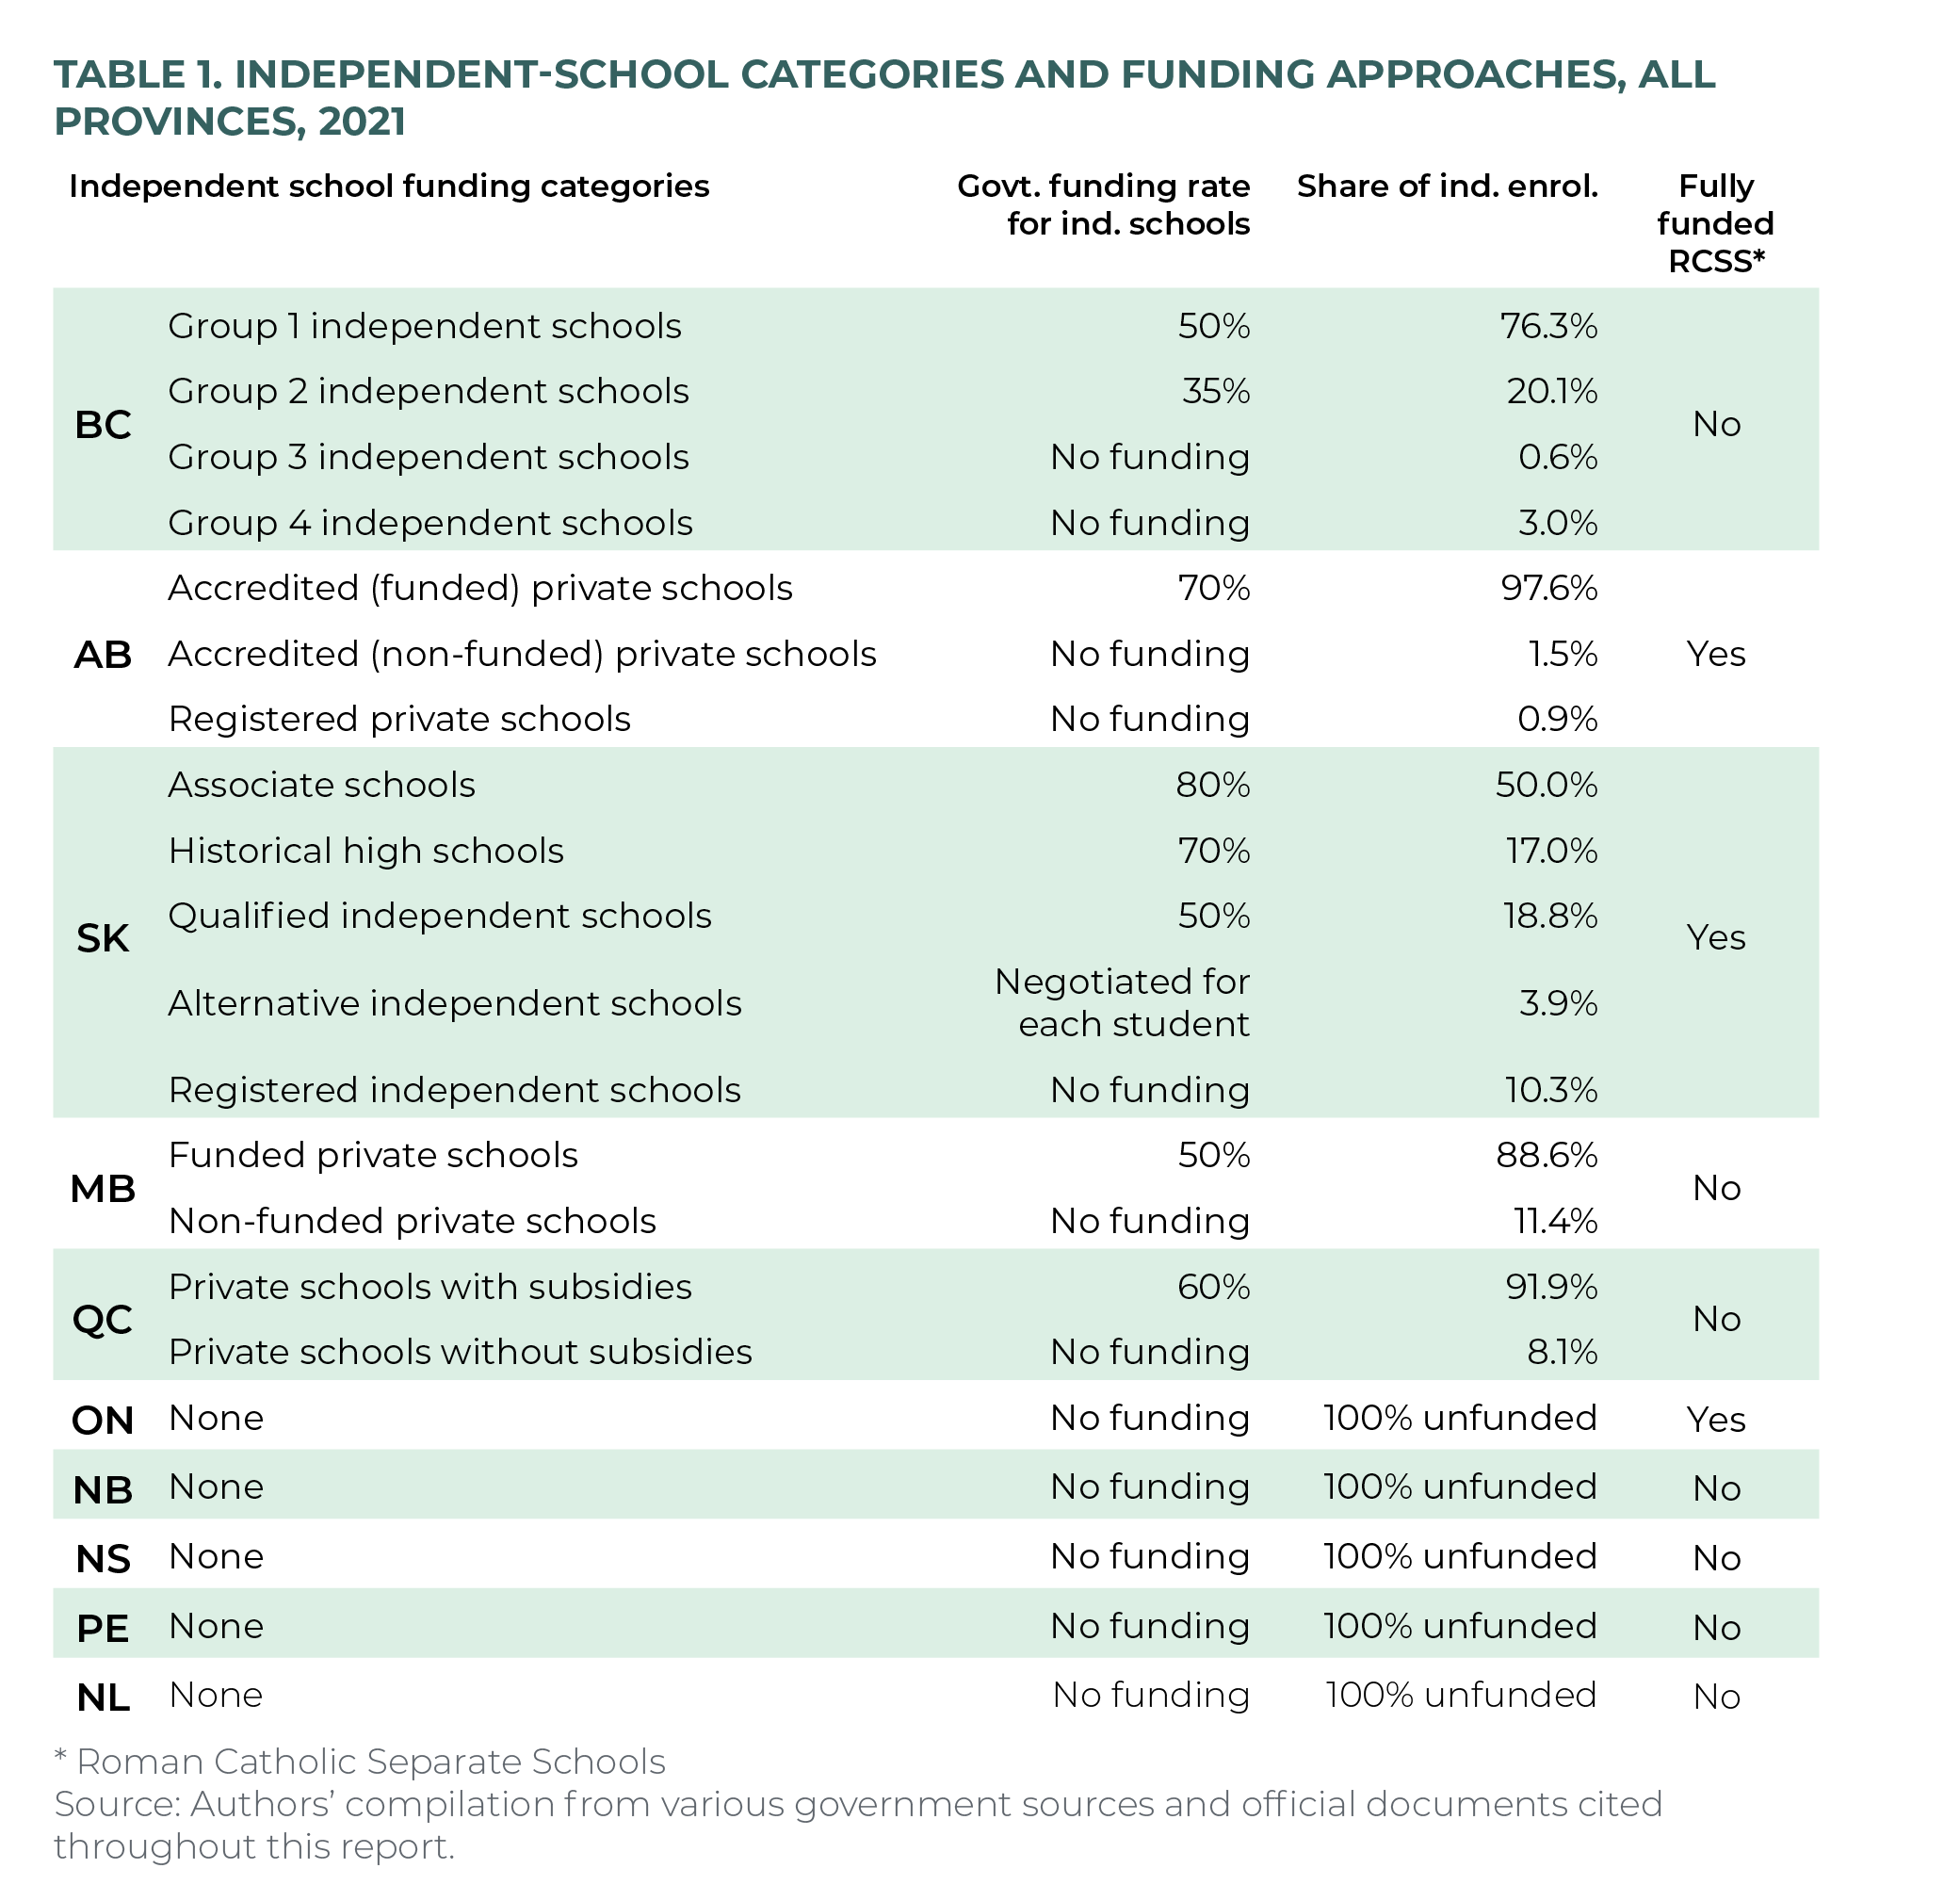
Three out of every four independent schools (enrolling 84 percent of independent-school students) in Canada outside Ontario receive taxpayer-funded operating grants at some percentage of the per-student amount awarded to public schools, as shown in figure 2. The exact amount varies from 35 percent for British Columbia’s Group 2 independent schools to 80 percent for Saskatchewan’s Associate schools. 24 24 Excluding students with special needs. They are fully funded at independent schools at a much higher rate in some provinces. But, despite the variation, all provinces outside Ontario and Atlantic Canada offer some taxpayer-funding for independent schools. Table 1 summarizes the various approaches of each province, specifying the different types of independent schools and funding across Canada. For a full tabulation of funded and non-funded independent schools by province, see appendix 1. 25 25 All funding rates and enrolment shares are presented and cited in this report. Appendix 1 is based on the most recent compilation of Canada-wide data of this kind: D. Allison, S. Hasan, and D. Van Pelt, “A Diverse Landscape: Independent Schools in Canada,” Fraser Institute, June 2016, https://www.fraserinstitute.org/sites/default/files/a-diverse-landscape-independent-schools-in-canada.pdf. For even greater detail, see D. Van Pelt, S. Hasan, and D. Allison, “The Funding and Regulation of Independent Schools in Canada,” October 2017, https://www.fraserinstitute.org/sites/default/files/funding-and-regulation-of-independent-schools-in-canada.pdf.
Comparative Cost of Funding
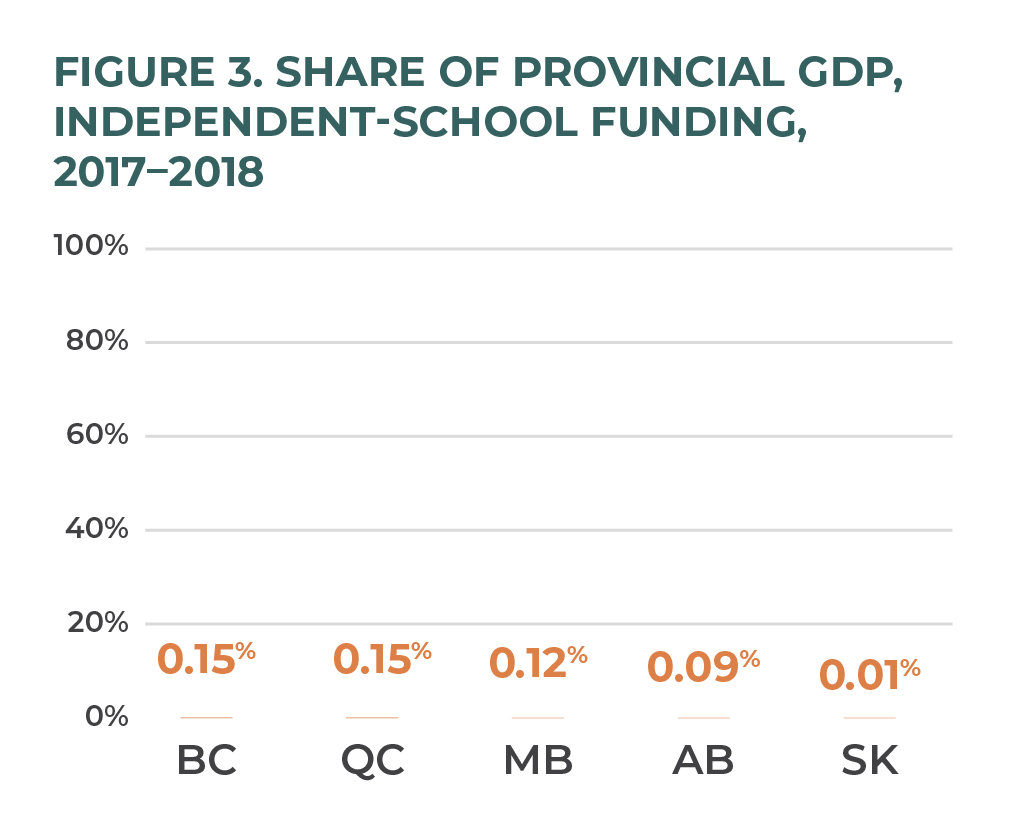
Figure 3 presents the comparative economic cost to fund independent schools in each province as an estimated share of each province’s respective GDP. 26 26 Statistics Canada, Table 36-10-0487-01, “Gross domestic product (GDP) at basic prices, by sector and industry, provincial and territorial (x 1,000,000),” 2021, https://www150.statcan.gc.ca/t1/tbl1/en/tv.action?pid=3610048701. Government of Alberta, “Education: Annual Report 2018–2019,” June 2019, https://open.alberta.ca/dataset/8b226e68-1227-4aec-87a5-b573f3bfb062/resource/fec2c6c0-2fa7-4030-adcc-8f3dbaa1bcf4/download/education-annual-report-2018-2019-web.pdf. British Columbia Ministry of Education, “2018/2019 - 2020/21 Service Plan,” February 2018, https://www.bcbudget.gov.bc.ca/2018/sp/pdf/ministry/educ.pdf. Manitoba Education, “Annual Report 2018–2019,” https://www.edu.gov.mb.ca/annualreports/edu_18-19/report.pdf. Government of Saskatchewan, “2018–19 Ministry of Education Budget Backgrounder,” Student First media release, April 2018, https://www.saskatchewan.ca/-/media/news-release-backgrounders/2018/apr/2018-19-education-backgrounder.pdf. Gouvernement du Québec, “Education: A Plan for Success,” The Québec Economic Plan: Budget 2018–2019, March 2018, http://www.budget.finances.gouv.qc.ca/budget/2018-2019/en/documents/Education_1819.pdf; Québec Ministère de l’Éducation et de l’Enseignement supérieur, “Guide Général du Financement, Publication 2019–2020: Éducation Préscolaire et Enseignement Primaire et Secondaire,” 2019, http://www.education.gouv.qc.ca/fileadmin/site_web/documents/PSG/ress_financieres/rb/Guide_fin_2019-2020.PDF. As shown, in every province that funds independent schools, funding amounts to less than 1/6 of 1 percent of GDP (≤0.15%).
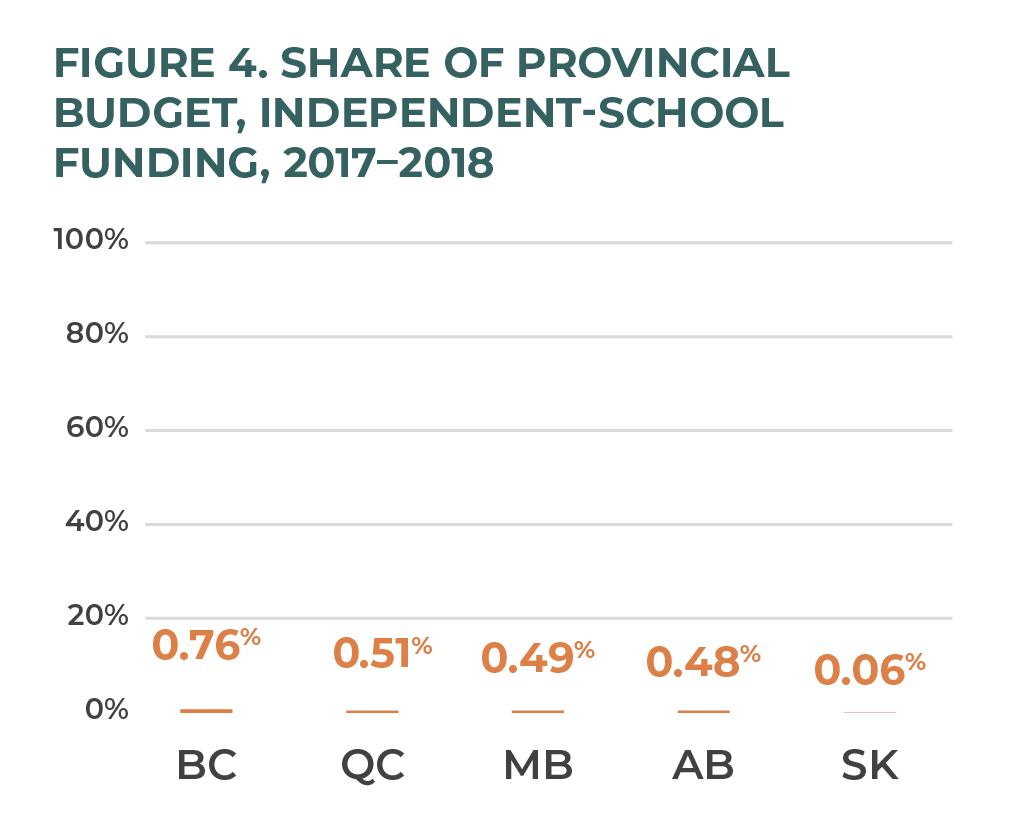
Similarly, figure 4 shows the comparative fiscal cost of independent-school funding for each province, in terms of provincial budgets. 27 27 Statistics Canada, “Table 10-10-0024-01: Canadian Classification of Functions of Government, by General Government Component (x 1,000,000),” 2021, https://www150.statcan.gc.ca/t1/tbl1/en/tv.action?pid=1010002401. Government of Alberta, “Education: Annual Report 2018–2019.” British Columbia Ministry of Education, “2018/2019–2020/21 Service Plan.” Manitoba Education, “Annual Report 2018–2019.” Government of Saskatchewan, “2018–19 Ministry of Education Budget Backgrounder.” Gouvernement du Québec, “Education: A Plan for Success”; Québec Ministère de l’Éducation et de l’Enseignement supérieur, “Guide Général du Financement.” In every province with funding, the taxpayer cost to fund independent schools is less than 1 percent of the provincial budget—usually half a percent. Combined—as a share of GDP and as a share of government budgets—it is clear that funding independent schools is not burdensome. Truly, it is hard to overstate how infinitesimal the cost is—and, therefore, how unburdensome the cost will be to Ontarians.
Why Funding Rates Vary by Jurisdiction
It is one thing to note the differences in funding by province, but why do the rates vary? Conceptually, there are two theoretical frameworks that are valuable in understanding the differences in independent-school funding across jurisdictions. The first is Glenn and de Groof’s freedom-autonomy-accountability framework. In their 1,600-page, four-volume work they present how governments in the Western world permit, support, and regulate school distinctiveness and choice. 28 28 C.L. Glenn, J. de Groof, and C.S. Candal, Balancing Freedom, Autonomy, and Accountability in Education, 4 vols. (Nijmegen: Wolf Legal Publishers, 2012). Education systems are a balancing act. Different jurisdictions have varying degrees of tolerance for parental freedom and school autonomy, and funding is almost always conditional on some form of external accountability. Are governments willing to impose limits on educational freedom? Are schools and parents willing to have their freedoms limited, in exchange for funding? These are the questions that point to varying levels of public funding for independent schools in Canada and around the world.
Similarly, Berner’s uniformist-individualist-pluralist framework provides insights from another perspective. 29 29 Berner, “Good Schools, Good Citizens.” Her research explores educational pluralism through the lens of civic education. Who, in a democracy, is permitted and expected to inculcate democracy and civic formation in the next generation of citizens? This question is inexorably connected to funding. As previously discussed, the rationale for publicly funding any students is to maximize the positive (and minimize the negative) externalities that result from having (or lacking) an education—especially as it relates to citizenship.
When looking at Berner’s three positions, a small number of jurisdictions—like Mexico and Bulgaria—take a uniformist position, in which only the state can deliver democratic education. 30 30 Berner, “Good Schools, Good Citizens,” 11–13. Accordingly, although private schools may be allowed to operate, they are seen as entirely different entities and are thus highly unlikely to be eligible for funding. This perspective helps explain why the Ontario government does not recognize independent schools as schools or their teachers as teachers or their students as students. 31 31 The province does not recognize them as such, despite the fact that (1) nearly all Ontario independent schools are non-profits (and often charities), (2) Ontario independent-school teachers are either members of the Ontario College of Teachers (OCT) and/or a non-OCT teacher with specialized knowledge and skills, and (3) Ontario independent-school students match any reasonable definition of “student.” Rather, independent schools are treated as businesses, with teachers and students assumed to be the equivalent of general employees and customers. For teachers, this has serious consequences, as Ontario does not recognize them as an identified professional group and, therefore, will not grant them the many Labour Act exemptions that teachers working in Ontario’s public systems receive. And for schools and students, the consequence is an absolute lack of funding. The uniformist position is the reigning doctrine in Ontario, unlike all of Canada west of the Gulf of St. Lawrence.
No individualist system currently exists. The laissez-faire notion behind this historical approach is that education is strictly the domain of individual families, and as such, the individualist position has been used to reject raising taxes to fund public schools in the past. 32 32 Berner, “Good Schools, Good Citizens,” 13. Taken to its logical conclusion, a purist of this position would reject any state funding for education—albeit some individualists argue for full funding.
The third and overwhelmingly common position is pluralism. The pluralist position views individual families, civil society, and the state as valuable partners in sharing responsibility and oversight for education, based on the presupposition that democracy assumes a diversity of perspectives, so educating for a strong democracy requires no less. Accordingly, within each pluralist jurisdiction, the diverse delivery of education presumes a diverse approach to funding 33 33 Berner, “Good Schools, Good Citizens,” 14–16. —how much more so, then, when we look outside and compare jurisdictions?
In short, funding is related to educational freedom. Where jurisdictions rightly understand education and educational freedom to be merit goods in the public interest, funding is generous. Accordingly, publicly funding independent schools is the norm in free societies—including most of Canada.
Common Objections to Funding
Given all the aforementioned, failure to fund all students regardless of school attended is indefensible, and yet this has long been the reality for Ontarians. In light of Berner’s framework, why has Ontario’s approach toward independent schools and education funding assumed a uniformist perspective so uncharacteristic and unbefitting of a free society? A thorough review is beyond the scope of this paper, but suffice to say, four long-time objections to funding continue to be frequently raised in Ontario media and the public narrative: fiscal burden, political risk, the myth of elitism, and deterioration of the public system leaving some (or many) students behind.

Objection 1. Fiscal Burden
A commonly raised objection to funding any school outside the locally assigned district system is the fear of further burdening taxpayers with yet another cost to an already expensive public service. An example of this fiscal argument is the often-regurgitated assertion in Ontario media that merging Ontario’s public systems—and thus eliminating Roman Catholic separate schools—will “save taxpayers an estimated $1.6 billion a year.” 34 34 Such assertions are too frequent to list, so the most recent three—to our knowledge—will suffice: Peterborough Examiner, July 14, 2021; Hamilton Spectator, June 28, 2021; Toronto Star, March 17, 2021.For a rebuttal to the Toronto Star’s piece, see D. Hunt, “Religious Freedom Equals Educational Freedom,” Convivium, March 31, 2021, https://www.convivium.ca/articles/religious-freedom-equals-educational-freedom/. Not only is this decade-old figure the upper bound of a simplistic estimate based on extraordinarily bold and untested assumptions, 35 35 The original discussion paper that makes this claim is W.J. Phillips, “Ontario Public and Catholic School Merger Study,” Federation of Urban Neighbourhoods, March 2012, https://urbanneighbourhoods.ca/wp-content/uploads/2020/10/ontario-public-and-catholic-school-merger-study.pdf. but a review of school-district consolidations reveals such claims to be more akin to fiction. 36 36 P.W. Bennett, The State of the System: A Reality Check on Canada’s Schools (Montreal: McGill-Queen’s University Press, 2020), 66–80; C. Howley, J. Johnson, and J. Petrie, “Consolidation of Schools and Districts: What the Research Says and What It Means,” National Education Policy Center, February 2011, https://nepc.colorado.edu/sites/default/files/PB-Consol-Howley-Johnson-Petrie.pdf. Amalgamations on a district scale shore up monopolies and remove rivalrous incentives, resulting in waste, inefficiencies, and diseconomies of scale. 37 37 J. Merrifield, “Assessing Competition,” in School System Reform: Why and How is a Price-less Tale (Murrells Inlet, SC: Covenant Books, 2019), 237. As economists have long understood: “Policies that promote residential mobility and increase the knowledge of the consumer-voter will improve the allocation of government expenditures.” 38 38 C.M. Tiebout, “A Pure Theory of Local Expenditures,” Journal of Political Economy 64, no. 5 (1956): 423. This is known as Tiebout competition, and applies to the positive spillover effects that independent schools have on public schools. Of the seventy empirical studies to date that examine the fiscal effects—both cost and potential savings—of independent-school funding programs on taxpayers and public schools in the US, only five find that publicly funding independent schools generates net costs for taxpayers. Fully sixty-five studies, or 93 percent of all methodologically defensible empirical studies, find that independent-school funding generates taxpayer savings. 39 39 EdChoice, “123s of School Choice.”
However, such arguments—regardless of their merit or demerit—are not unique to Ontario, so although common in the province’s public narrative, they surely do not explain Ontario’s eccentric lack of funding.
Objection 2. Political Risk
Perhaps a more plausible answer as to why Ontario lacks the will to fund independent schools is the perceived political risk and subsequent electoral consequences that would follow such a policy. In other words, it may be seen as political “suicide” to fund independent schools in the province. When Ontario premier Bill Davis introduced Bill 30 to fully fund all grades of Roman Catholic separate schools in 1985, it was highly contentious, and led to the downfall of the Progressive Conservatives (PCs) forty-two consecutive years in power. Davis likely perceived such intense opposition, as he had sought an opportunity to introduce such funding for fourteen years as premier, but only when he was no longer personally seeking re-election did he summon the will to “do the right thing.” 40 40 R. Dixon, “William Davis and the Road to Completion in Ontario’s Catholic High Schools, 1971–1985,” Canadian Catholic Historical Association (CCHA), Historical Studies 69 (2003): 7–33. Similarly, in April 2001, the Mike Harris government introduced the Equity in Education Tax Credit (EETC) to allow parents a limited, phased-in tax credit for tuition fees paid to independent schools. The measure was meant to be phased in over five years, up to 50 percent of tuition to a maximum of $3,500. However, the EETC was short-lived. Following the 2003 provincial election—with the incumbent PCs losing to the Liberals—it was retroactively repealed by the new Dalton McGuinty government, denying parents the opportunity to claim the tax credit for the single year it had been in effect. 41 41 D. Allison, “Bringing School Choice to Ontario,” Fraser Institute, September 2020, https://www.fraserinstitute.org/sites/default/files/bringing-school-choice-to-ontario.pdf. In the subsequent provincial election, the PCs, led by John Tory, ran on the issue and lost. Although the blame was more likely a lack of candidate and party discipline, 42 42 J. Laschinger, “When Lack of Faith Lost John Tory an Election,” Toronto Star, July 30, 2016, https://www.thestar.com/news/insight/2016/07/30/when-lack-of-faith-lost-john-tory-an-election.html. the “ghosts of 2007” still haunt today’s Ontario PC party. 43 43 D. Hunt, “Independent Schools Left Out of Ontario’s COVID Support,” Ottawa Citizen, April 1, 2021, https://ottawacitizen.com/opinion/hunt-independent-schools-left-out-of-ontarios-covid-support.
However, provincial elections in Canada are not won or lost over a single issue—a confluence of factors influence election results. More importantly, prolonging an unjust policy over speculations around general elections from thirty-six and fourteen years ago is unacceptable. A lot has happened in the last fourteen years alone, not the least of which is a pandemic that exposed the cracks in the existing educational system 44 44 D. Hunt, “Flexible Education in an Age of Disruption: Embracing Innovation and Diversity in Ontario K–12 Education,” Cardus, May 2020, https://www.cardus.ca/research/education/reports/flexible-education-in-an-age-of-disruption/. —pointing to the need for more nimble, flexible, and responsive schools, as was seen in Ontario independent schools’ rapid pivot during lockdowns compared to their public-school counterparts. 45 45 P. Marcus, D. Van Pelt, and T. Boven, “Pandemic Pivot: Christian Independent Schooling During the Initial 2020 Lockdown,” Cardus, June 2021, https://www.cardus.ca/research/education/reports/pandemic-pivot/; P. Marcus et al., “Pandemic Response: How Christian Independent Schools Responded to a Year of COVID-19,” Cardus, August 2021, https://www.cardus.ca/research/education/reports/pandemic-response/.
Objection 3. The Myth of Elitism
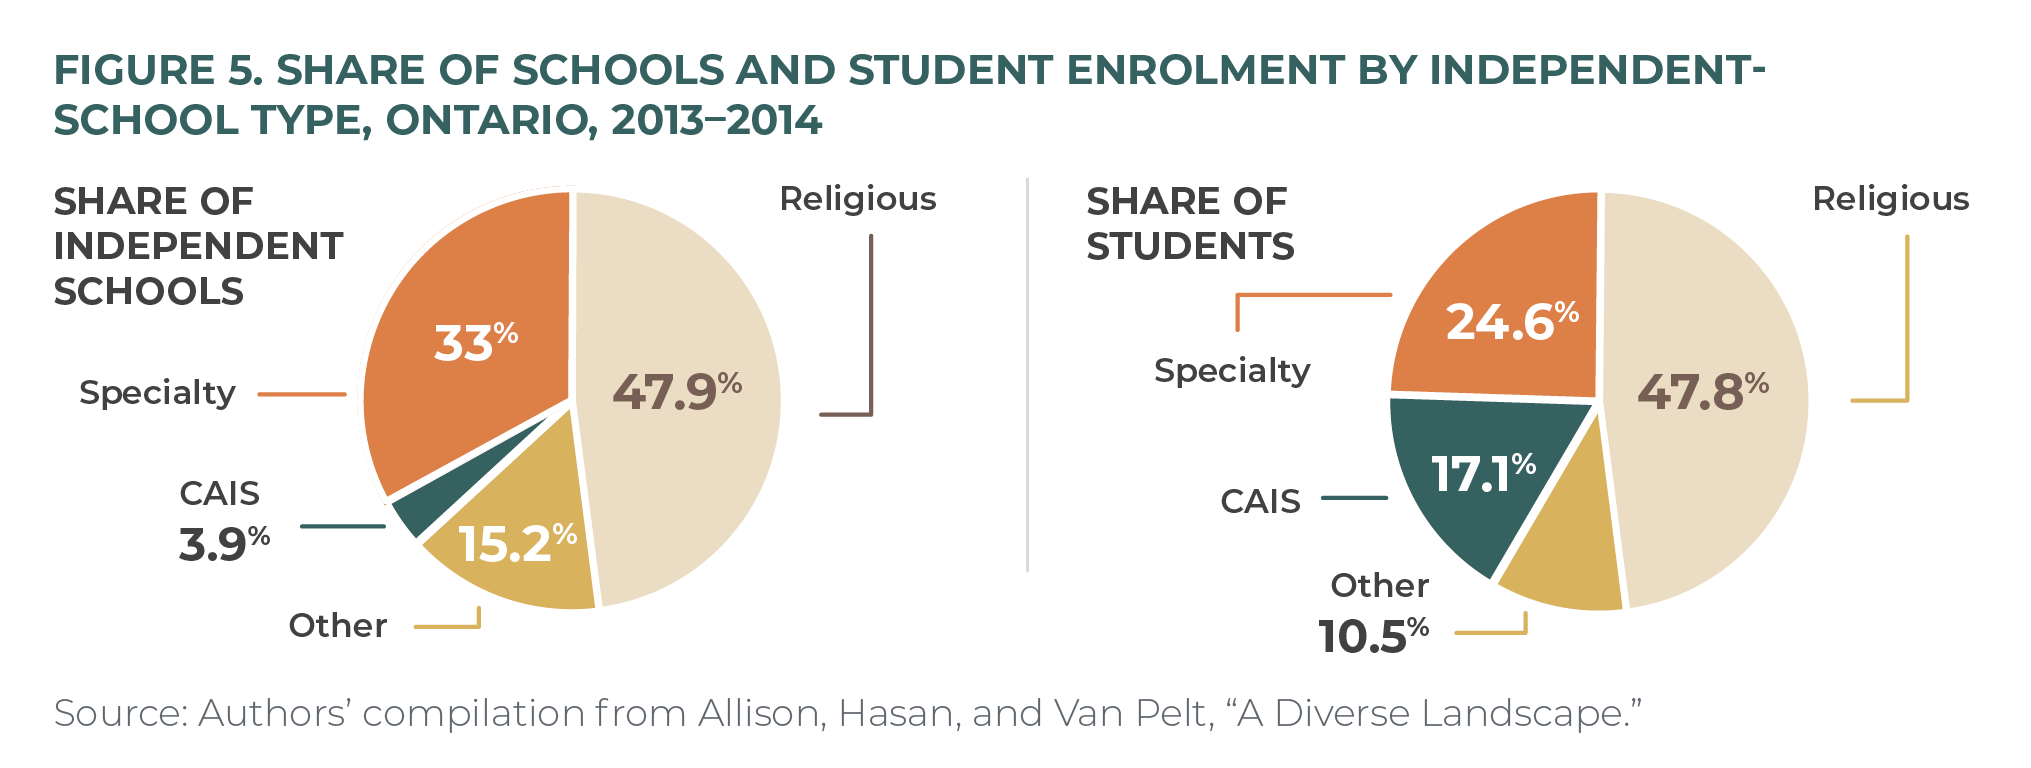
Perhaps the most salient fallacy is the perception that Ontario’s independent schools are elite establishments for the wealthy and privileged class. A very small share of Ontario’s “private” schools match elitist stereotypes, but painting all independent schools with such a brush—as so often happens—is to depict an illusion. The types of independent schools, and the families enrolling students in them, are extraordinarily diverse.
Figure 5 presents findings from the latest study to fully stratify Ontario independent schools. In 2013–2014, 3.9 percent of Ontario independent schools (enrolling 17 percent of independent-school students) were Canadian Accredited Independent Schools (CAIS), 46 46 Allison, Hasan, and Van Pelt, “A Diverse Landscape.” a proxy for schools matching elitist stereotypes. In other words, 96 percent of Ontario independent schools and 83 percent of independent-school enrolment were not elite. There has been considerable growth in the number of independent schools in Ontario since then, rising from 954 in 2013–2014 to around 1,500 in the summer of 2021. 47 47 There are 1,525 independent schools officially registered with the province, at the time of writing. However, after excluding overseas, First Nations, summer-only, and prison-based schools, Ontario presently has 1,446 independent schools (authors’ calculations based on Ontario Ministry of Education data). Today, less than 2 percent of Ontario’s independent schools are CAIS. An updated stratification study from Cardus is forthcoming, expanding the definition of top-tier schools well beyond CAIS, so as not to understate “elite” schools or misrepresent the sector. Using as generous a definition as is reasonable—some may argue, too generous—around 6 percent of Ontario independent schools are top-tier, or “elite,” in 2021.
What about enrolment characteristics? Independent-school families are overwhelmingly middle class, whether defined economically, sociologically, or psychographically. Economically, in the two provinces for which we have data, when excluding elite-school families, independent-school families’ average after-tax income is between 1.8 percent lower 48 48 A. MacLeod, S. Parvani, and J. Emes, “Comparing the Family Income of Students in Alberta’s Independent and Public Schools,” Fraser Institute, October 2017, https://www.fraserinstitute.org/sites/default/files/comparing-the-family-income-of-students-in-albertas-independent-and-public-schools.pdf. and 1.9 percent higher 49 49 J. Clemens, S. Parvani, and J. Emes, “Comparing the Family Income of Students in British Columbia’s Independent and Public Schools,” Fraser Institute, March 2017, https://www.fraserinstitute.org/sites/default/files/comparing-family-income-of-students-in-BCs-independent-and-public-schools.pdf. than the average income for families in public schools. Sociologically, class is more understood in terms of occupational status, and in this sense as well, the “middle-class” label is appropriate. For example, in Ontario, independent-school parents are twice more likely than the average Ontarian to be a nurse or school teacher. 50 50 Van Pelt, Hunt, and Wolfert, “Who Chooses Ontario Independent Schools and Why?” Moreover, when considering their family background and upbringing, 75 percent of Ontario independent-school parents attended public schools themselves, and 60 percent did so exclusively. 51 51 Van Pelt, Hunt, and Wolfert, “Who Chooses Ontario Independent Schools and Why?” Last, in terms of their behaviour, attitudes, lifestyle, and activities, independent-school parents are even more active than other school parents when it comes to volunteering and participating in the activities and vibrancy of their local communities and civil society 52 52 B. Green, D. Sikkema, and D. Sikkink, “Cardus Education Survey 2018: Ontario Bulletin,” Cardus, October 2018, https://www.cardus.ca/research/education/reports/cardus-education-survey-2018-ontario-bulletin/. Van Pelt, Hunt, and Wolfert, “Who Chooses Ontario Independent Schools and Why?” —embodying the values emblematic of the Canadian middle class.
Objection 4. Deterioration of the Public System
Likely underlying the aversion to funding is a deeper fallacy—namely, the common claim that funding independent schools will deteriorate the public system. Such concerns are important to thoughtfully consider, as they are motivated by a keen interest in the welfare of students, parents, teachers, and society as a whole. The essence of the argument goes something like this: Independent schools will siphon funds and diversity out of the public system, emptying local-district schools of their “good” students and leaving behind the most challenging students, thereby balkanizing the population, weakening an institution that is essential to democracy, and thus threatening the stability and future of our democracy. Therefore—it is asserted—public funds should only follow public students to public schools that exist for the public good.
We address the unfounded fears of a mass exodus elsewhere in this report, and scholar Ashley Berner recently surveyed the literature and found that independent schools do not harm but strengthen civic formation and, consequently, democracy and social cohesion as well. 53 53 Berner, “Good Schools, Good Citizens.” In other words, independent schools not only contribute but overcontribute to the common good. This is confirmed by a decade’s worth of data from the Cardus Education Survey (CES)—the largest reliable dataset of non-government-school student outcomes in Canada, the United States, and Australia. 54 54 For the latest research related to the CES visit carduseducationsurvey.com. The most recent CES at the time of publication is A. Cheng and D. Iselin, “Cardus Education Survey Australia: Australian Schools and the Common Good,” August 2020, https://carduseducationsurvey.com.au/wp-content/uploads/2020/08/Cardus-Education-Survey-Australia_Full-Report-Final.pdf. The original CES is R. Pennings et al., “Cardus Education Survey: Do the Motivations for Private Religious Catholic and Protestant Schooling in North America Align with Graduate Outcomes?,” Cardus, 2011, https://www.cardus.ca/research/education/reports/cardus-education-survey-phase-i-report-2011/. But what about the fear that competition will threaten the public system?
Do independent schools deteriorate or improve neighbouring public schools? This is best addressed in two parts: independent-school funding’s competitive effects on (1) socioeconomic differences between school sectors, and (2) public-school academic performance.
Using PISA 2009 data—a representative, random sample of 470,000 students in sixty-five countries, representing about 26 million fifteen-year-olds 55 55 Organisation for Economic Co-operation and Development [OECD], PISA 2009 Technical Report (Paris: OECD Publishing, 2012), 25, http://dx.doi.org/10.1787/9789264167872-en. —OECD researchers find that in the jurisdictions where independently managed schools receive greater proportions of public funding, the socioeconomic disparities between government and non-government schools disappears. In other words, where there is a greater quantity and variety of fully-taxpayer-funded, non-government-managed K–12 education options, there are narrower differences between advantaged and disadvantaged populations. 56 56 OECD, School Choice and School Vouchers: An OECD Perspective (Paris: OECD Publishing, 2017), https://www.oecd.org/education/School-choice-and-school-vouchers-an-OECD-perspective.pdf. Although the OECD researchers only reported on correlation, it intuitively follows that funding socioeconomically disadvantaged families to attend independent schools that otherwise are only accessible to families of means is likely to directly result in greater opportunity for more students. More specifically,
In those countries where private schools receive higher proportions of public funding, there is less stratification between public and private schools. Across OECD countries, 45% of the variation in stratification can be accounted for by the level of public funding to privately managed schools. . . . Even after accounting for the prevalence of private schools and other country-level characteristics, such as variations in the socio-economic backgrounds of students, the average socio-economic background of countries and the level of school competition, the magnitude of stratification between publicly and privately managed schools is still related to the level of public funding for privately managed schools. 57 57 OECD, Public and Private Schools: How Management and Funding Relate to their Socio-economic Profile (Paris: OECD Publishing, 2012), 28–29, http://dx.doi.org/10.1787/9789264175006-en.
Put simply, funding all students, even at independent schools, helps close the inequality gap as it relates to opportunity. But it also likely helps close the outcomes gap. In international comparisons—using either, or both, PISA and TIMMS data—we also see that students perform better in school systems with a robust sector of publicly funded, independently managed schools. 58 58 L. Woessmann, “The Importance of School Systems: Evidence from International Differences in Student Achievement,” Journal of Economic Perspectives 30 2016): 3, 3–31, http://dx.doi.org/10.1257/jep.30.3.3. Increases in the share of independent schooling modestly increases academic achievement. 59 59 C.A. DeAngelis, “The Public Benefit of Private Schooling: Test Scores Rise When There Is More of It,” Cato Institute, January 2018, 6, 10, https://www.cato.org/policy-analysis/public-benefit-private-schooling-test-scores-rise-when-there-more-it.
Closer to home, much American research has been conducted in recent years. In 2016, scholars Patrick Wolf and Anna Egalite conducted a systematic review of the literature. 60 60 P.J. Wolf and A.J. Egalite, “Pursuing Innovation: How Can Educational Choice Transform K–12 Education in the U.S.?,” Friedman Foundation for Educational Choice, April 2016, http://www.edchoice.org/wp-content/uploads/2016/05/2016-4-Pursuing-Innovation-WEB-1.pdf. Of the forty-two methodologically defensible studies that examine the effect of various independent-school funding schemes on district-school student achievement in the US, thirty find statistically significant gains from increased competitive pressure. 61 61 Wolf and Egalite, “Pursuing Innovation,” 18–23. Not one study reports adverse academic effects on public-school students from independent-school choice programs’ competitive pressures. 62 62 Wolf and Egalite, “Pursuing Innovation,” 22. Wolf and Egalite conclude, “Some competitive pressure on public schools is not only clearly good for students . . . but lots of competitive pressure on schools appears to be even better for them.” 63 63 Wolf and Egalite, “Pursuing Innovation,” 23. Three other systematic reviews have been conducted within the last decade on competitive effects in the US, and all find that the presence or threat of taxpayer-funded independent schooling at least modestly improves public schools. 64 64 D. Epple, R.E. Romano, and M. Urquiola, “School Vouchers: A Survey of the Economics Literature,” Journal of Economic Literature 55, no. 2 (2017): 441–492, https://dx.doi.org/10.1257/jel.20150679. A.J. Egalite and P.J. Wolf, “A Review of the Empirical Research on Private School Choice,” Peabody Journal of Education 91, no. 4 (2016): 441–54, https://dx.doi.org/10.1080/0161956X.2016.1207436. A.J. Egalite, “Measuring Competitive Effects from School Voucher Programs: A Systematic Review,” Journal of School Choice 7, no. 4 (2013): 443–64, https://dx.doi.org/10.1080/15582159.2013.837759. Most recently, EdChoice narrowed the review to only empirical studies: twenty-five of the twenty-seven conducted since 1995 in the US find positive effects from taxpayer-funded independent-school choice programs on public-school test scores, with one finding nil effects and one finding negative effects. 65 65 EdChoice, “The 123s of School Choice.”

Although this is what we would expect from economic theory—competition boosts productivity, therefore increased competition over students is likely to result in higher student achievement and lower costs 66 66 C.M. Hoxby, introduction to The Economics of School Choice, ed. C.M. Hoxby (Chicago: University of Chicago Press, 2003), 1–22, https://www.nber.org/system/files/chapters/c10083/c10083.pdf. C.M. Hoxby, “School Choice and School Productivity: Could School Choice Be a Tide that Lifts All Boats?,” in Economics of School Choice, 287–341, https://www.nber.org/system/files/chapters/c10091/c10091.pdf. —what is rarely stated is how detached “competition” in contemporary school systems is from the genuine competition that exists in genuine market sectors. 67 67 Merrifield, “Assessing Competition,”, 229–44. Almost all school systems are designed to put as little competitive pressure on the status quo—that is, locally assigned public schools—as possible, 68 68 Merrifield, “Assessing Competition,” 229, 232. and in this spirit, most “school choice” policies are designed to limit the market conditions necessary for innovation. 69 69 To quote economist John Merrifield (“Assessing Competition,” 232–33) at length: “The market conditions most widely cited for being the basis of positive, relentless change [are] (1) profit-loss potential; (2) low formal and informal entry barriers (level playing field between existing and potential choices); and (3) unregulated price change for independent schooling options driven by changes in supply and demand. Lacking any of those three converts a recipe for positive relentless change into a likely recipe for stagnation or disaster. No existing school system contains all three, and in many school systems, even in many that have recently enacted school choice expansions, none of the three are present, and there may be other key restrictions such as detailed curricula and/or personnel mandates that apply to all schools” (emphasis in original); Wolf and Egalite, “Pursuing Innovation,” 23. This is why the positive competitive effects are so modest: Because the competition is, economically speaking, distorted and indirect. There is no evidence for or against the effects of a truly open education system, as nothing even close to a free market exists in contemporary K–12 school systems. It has not been tried in modern times. 70 70 Merrifield, “Assessing Competition,” 243–44. This is a critically important point for when Ontario implements a funding scheme for independent schools. Modest effects, in this policy discussion, are not cause for pause. On the contrary: Given such severe state-imposed constraints on competition in all jurisdictions, the fact that the evidence so overwhelmingly favours increased competition despite state-imposed market distortions should prompt unequivocal calls to embrace market forces in swinging wide the policy gates for publicly funding students within open, robust, and diverse independent-school systems.
Accordingly, generous funding alone is not a cure-all. As scholar Ludwig Woessmann cautions,
Spending more money within an institutional system that sets poor incentives will not improve student performance. An institutional system in which all the people involved have an incentive to improve student performance is the only alternative that promises positive effects. 71 71 L. Woessmann, “Why Students in Some Countries Do Better: International Evidence on the Importance of Education Policy,” Education Matters 1, no. 2 (2001): 67–74, https://www.educationnext.org/whystudentsinsomecountriesdobetter/.
A Balancing Act
The challenge with any effective and equitable education system is balancing educational freedom—parents’ authority to choose a school, the availability of a variety of choices, and the ability to access it—with school autonomy and external accountability of common standards. Getting this combination of choice, autonomy, and accountability right is essential and “a tide that lifts all boats” to help disadvantaged students, 72 72 L. Woessmann, E. Luedemann, G. Schuetz, and M.R. West, School Accountability, Autonomy and Choice Around the World (Cheltenham, UK: Edward Elgar, 2009), xi. while improving both student performance 73 73 Woessmann, “Importance of School Systems.” and non-cognitive outcomes. 74 74 L. Wöbmann, E. Lüdemann, G. Schütz, and M.R. West, “School Accountability, Autonomy, Choice, and the Level of Student Achievement: International Evidence from PISA 2003,” OECD Education Working Papers 13 (2007): 53–57, doi:10.1787/246402531617. Woessmann and other leading education economists present the details of this elsewhere.
For the purposes of this study—and future legal, legislative, and policy decisions—it is relevant that Ontario excels at one of the three. Ontario schools in the independent-school sector are highly autonomous, and it is critical that this autonomy is not jeopardized but unwaveringly protected.
If funding for the education of students in independent schools is introduced at the expense of school autonomy, it will neither improve performance nor strengthen equity. For parents’ choice to be meaningful, they need to have meaningful—and meaningfully distinct and different—options. A truly diverse, innovative, and robust independent-school sector cannot and will not exist without considerable room for schools to fully practice and live into true diversity and real innovation. And innovation will be stifled if the true demand and supply of independent schools are distorted by excess regulations enshrined to appease those hostile to funding all students equitably.
In summary, funding for independent schools is the norm in the advanced world. The rationale for any funding is based on the social goods and positive spillover effects that flow from education. As there is no one way to school, and as independent schools overcontribute to the public good, it is only just and equitable that they receive public funding. And these positive outcomes are maximized when funding does not limit but enhances educational freedom and school autonomy, with carefully considered, externally accountable standards.
The General Economic Model and Costing Assumptions
Given the context of Ontario’s independent-school sector and the rationale for publicly financing it, the remainder of this report details seven viable models for equitably funding independent schools in Ontario.
The data used for the analysis were obtained from Statistics Canada and the respective Ministry of Education for each province. For effective comparison, data for the 2018–2019 school year is used in all cases. 75 75 This is for two reasons. First, the Statistics Canada data on school-enrolment data in Canada’s provinces are up to date for 2018/2019. Second, the most recently completed school years, 2019–2020 and 2020–2021, were disrupted by COVID-19 lockdowns and school closures. The shift to remote learning affected enrolments, and many students may still be unaccounted for. Hence, our estimates are based on the most recent data from a “typical” school year.
The following assumptions guide our overall costing analysis, in applying the various funding models:
- There would be no structural change to the current school system in Ontario—in other words, the Anglophone public system, Francophone public system, and their respective Roman Catholic separate schools remain in place.
- Ontario would fund a portion of education in qualifying independent schools as a percentage of the average per-student operating cost of public schools in the province. The remainder of operating and capital costs for these independent schools would be covered by tuition fees, fundraising by the school and its supporters, and additional revenue sources including donations.
- Ontario, like other provinces that provide funding for independent schools, would have funded and non-funded independent schools.
- Savings would result from students migrating from public to independent school, if independent-school enrolment is partially funded. 76 76 Even if independent schools were fully funded, there would almost certainly be real savings, due to reductions in operational overheads within public boards—producing small reductions in targeted grants. However, there is no accurate way to model this without much more finely grained data, or even then.
- There would be an able bureaucracy to administer the necessary regulatory transitions, implementation, monitoring, and compliance—the details of which, however, require attention beyond the scope of this study. Therefore, we have not accounted for ancillary funding for increased or decreased government administration or oversight. 77 77 Moreover, such details are particular to each locale and cannot be readily replicated in Ontario, if at all. Thus, implementation and compliance are outside the scope of our analysis.

Average Per-Student Cost to Fund Independent Schools in Ontario
To properly estimate per-student funding in public and independent schools in Ontario, some defensible allocation of costs must be made. Importantly, we need an amount to serve as the basis for per-student public funding to independent school students in Ontario. We examine three possible estimate options. First, we could take the annual per-pupil amount granted by the Ontario Legislature to fund all public schools. This would include the cost of all grants except capital, and be the most “democratic” option, as the funding allocation is derived directly from a legislative vote. The challenge is that there are fifteen different grants within Ontario’s Grants for Student Needs (GSN) funding framework, of which only one—the Pupil Foundation Grant—is allocated on a per-student basis, and it has five different allocations. 78 78 Ontario Ministry of Education, “Education Funding: Technical Paper 2019–20,” Spring 2019, http://www.edu.gov.on.ca/eng/funding/1920/TechnicalPaper2019-20.pdf. A simple average of the Pupil Foundation grants ($5,936.59 per student), therefore, certainly underestimates the actual per-student operating expenditures of Ontario public schools. Moreover, of the fifteen total grants, which of the thirteen “special grants” should (or could) be considered for independent schools? Thus, a weighted average that accounts for all the various grants also poses tremendous challenges in constructing a reliable costing model.
Alternatively, it is possible to arrive at an upper-bound estimate of $15,119.66 per student, by dividing the total spending on public schools by the total enrolment in public schools. 79 79 T. Hill, N. Li, and J. Emes, “Education Spending in Public Schools in Canada: 2021 Edition,” Fraser Institute, January 2021, https://www.fraserinstitute.org/sites/default/files/education-spending-in-public-schools-in-canada-2021.pdf. In 2017–2018, the spending per student in public schools in Ontario was $14,394. Adjusted for inflation, this is about $15,119.66 in 2021. There are advantages to this approach. It presents the actual total per-student cost to taxpayers. It embodies several of the financial inefficiencies of centralized, bureaucratically managed, industrial-scaled schools. And, as Hill, Li, and Emes observe, it reveals that education spending in Canada’s public schools has continued to outpace what is required to account for changes in enrolment and price (inflation). 80 80 Hill, Li, and Emes, “Education Spending in Public Schools in Canada.“ However, the public system has expenses, such as capital expenditures (e.g., buildings), that cannot—and should not—be applied to funding independent schools. Therefore, applying all public-school expenditures—the total public per-pupil cost to taxpayers—overstates the per-independent-student cost for our model.
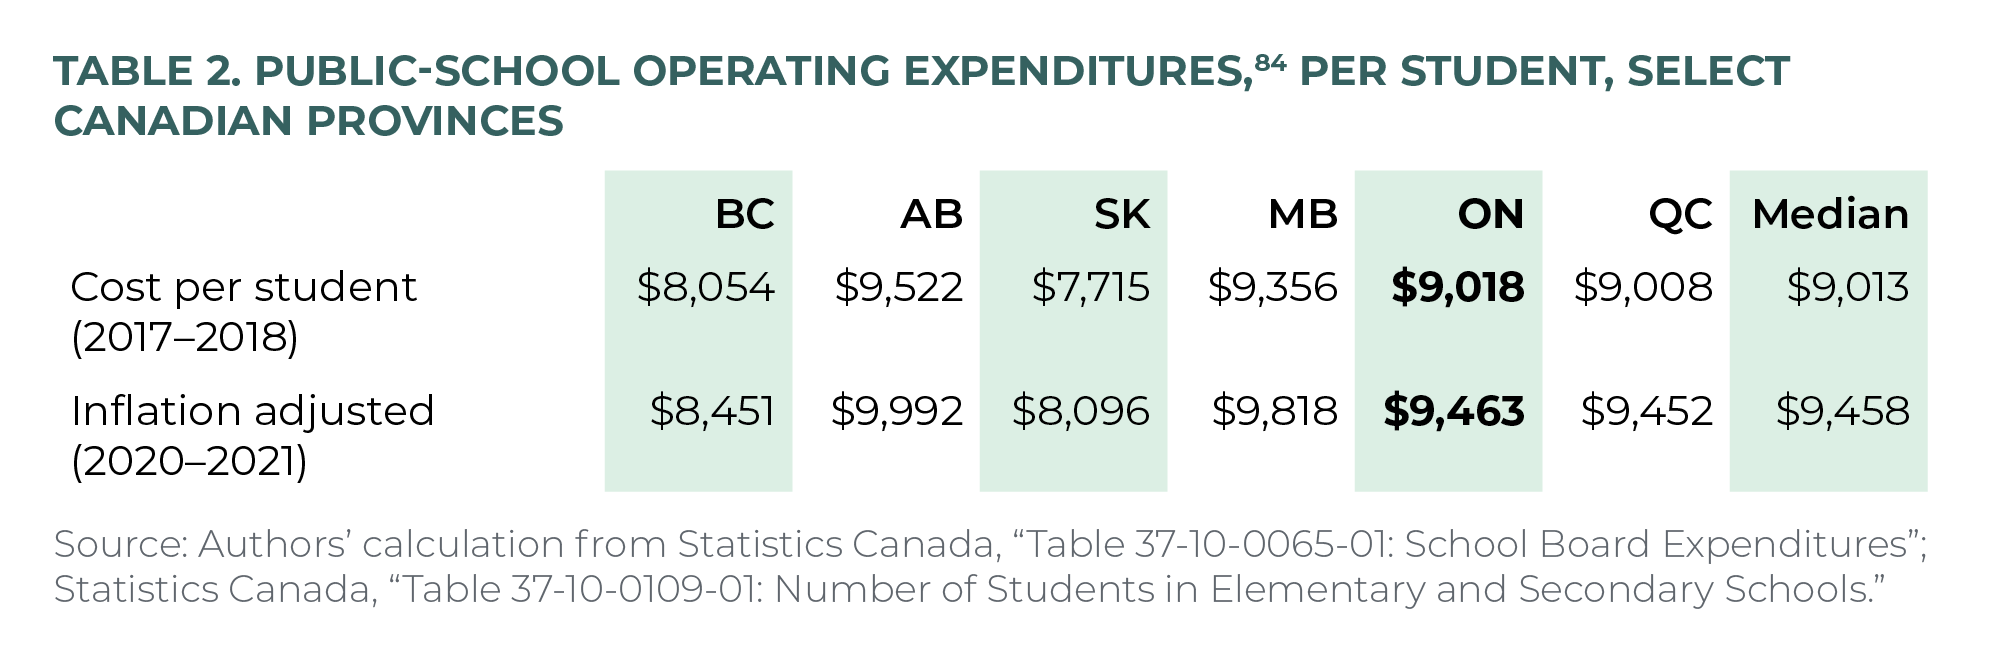
We adopt a third measure by calculating a per-student cost estimate that equally captures the applicable operating costs to fund independent schools and, as much as possible, does not overestimate the financial impact of the migration of students from public to independent schools and vice versa. To do this, we simply allocate three categories of operating costs—teachers’ salaries, instructional supplies, and student transportation—from Statistics Canada data on Annual School Board Expenditures in Canada’s provinces. 81 81 Statistics Canada, “Table 37-10-0065-01: School Board Expenditures (x 1,000),” 2021, https://www150.statcan.gc.ca/t1/tbl1/en/tv.action?pid=3710006501. Teachers’ salaries include fringe benefits. The Statistics Canada school-board-expenditures’ data file (above footnote) does not have a separate line for teacher-pension payments. This appropriation is like the funding system in other provinces where independent schools receive funding from the government. For example, in Manitoba, the government provides funding to funded independent schools for expenditures related to operations (e.g., salaries, learning resources), but not for capital expenditures (e.g., building new facilities, upkeep of existing facilities). The amount that each funded independent school receives is based on the number of eligible pupils enrolled at the school. In British Columbia, the per full-time equivalent (FTE) student-funding rates for independent schools are calculated based on public-school operating grants and enrolment of the school district in which the independent school is located. Accordingly, the per-student operating cost of public schools in Ontario is calculated as the operating expenditure on public schools in the province divided by the total enrolment in public schools in the province.
In the 2017–2018 school year, the total operating expenditure in public schools related to teachers’ salaries, instructional supplies, and student transportation in Ontario was $18.22 billion. Divided by 2,020,245 students enrolled that same year in Ontario’s public K–12 schools, this works out to about $9,018. 82 82 Statistics Canada, “Table 37-10-0065-01: School Board Expenditures.” Adjusting for inflation based on the Bank of Canada Inflation Calculator, 83 83 Bank of Canada, “Inflation Calculator,” https://www.bankofcanada.ca/rates/related/inflation-calculator/. this comes to about $9,463 in 2021—or, about the median per-student operating expenditure of the provinces shown in table 2. This inflation-adjusted amount is used to estimate the cost of funding Ontario’s independent schools, for the various funding schemes in our analyses.
Anticipated Proportion of Funded Independent-School Students
Next, we make some assumptions about the proportion of Ontario’s independent-school students that are funded. This is necessary because, as is the case in other provinces, we can reasonably expect that some (or many) independent schools will not be funded if they do not meet the funding-eligibility criteria—by choice or by design. 85 85 Such funding stipulations differ considerably by province, and the unique legislation governing each regulatory regime has emerged over time due to a confluence of interests and influences. It is difficult—near impossible—to project what proportion of independent schools in Ontario will accept or reject funding, as their appetite for funding will largely depend on their degree of discomfort with any accompanying regulatory burdens, along with a host of other particular factors (some, possibly many, unique to each school and unknown to researchers and policy-makers outside their school community). Another consideration is the self-sorting that will happen in response to a major legislative change like funding. In addition to migration from public to independent schools, there is almost certainly going to be movement of independent-school families from non-funded to funded independent schools. Although it is possible that such within-sector movement may be minimal, it also may be considerable. Given the unknowns, we believe the most appropriate assumption is to use a simple average of the proportion of funded independent-school students in the five funded provinces—Alberta (97.6%), British Columbia (96.4%), Quebec (91.9%), Saskatchewan (89.7%), and Manitoba (88.6%)—to estimate that 92.4 percent of Ontario’s independent school students would be funded.
As with any hypothetical exercise, there are challenges that accompany assumptions. How similar are Ontario’s independent schools and their students to their “equivalents” in other provinces? No recent exhaustive comparison has been conducted, and such an investigation is beyond the scope of this study. 86 86 The most recent—and possibly only—study on this is D. Allison et al., “A Diverse Landscape” which uses data from 2013–2014. Given there are over 50 percent more independent schools in Ontario today, in tandem with the fact that a large number of Ontario independent schools have closed since then, an update is due—and forthcoming from Cardus. However, given what we know of the Ontario independent-school sector, our simple average is possibly an overestimation. Regardless, we believe it is most defensible to assume 92.4 percent of Ontario’s independent-school students would be funded, given how tightly the other provinces’ proportion of funded students hold to that average. Our general model is thus based on the assumption that there is an established preference for independent schooling in Ontario and that the relative proportion of funded independent-school enrolment to non-funded independent-school enrolment in each province would be mirrored in Ontario. 87 87 This is slightly different from the approach by D. Van Pelt, M. Palacios, and T. Jackson, “Financial Savings: Restructuring Education in Ontario Using the British Columbia Model,” Fraser Institute, September 2014, https://www.fraserinstitute.org/sites/default/files/financial-savings-restructuring-education-in-ontario-using-the-british-columbia-model.pdf, when they apply the BC funding model to Ontario. Their model assumes that the relative proportion of independent-school attendees to total enrolment in BC would be mirrored in Ontario, and then adjustments are made for the higher proportion of Roman Catholic and non-Catholic Christians in Ontario. This assumption cannot readily be applied to all provinces that have a scheme to fund independent schools. For example, in the case of Saskatchewan and Alberta—which both have funding for independent schools but also have smaller proportions of independent-school enrolments than Ontario—it would indicate a reduction in independent-school enrolment if independent schools were funded in Ontario, which is unreasonable.
Fiscal Savings Follow Each Independent-School Student
It is important to note that any funding scheme that allocates less to independent schools than public schools will result in taxpayer savings. Fully funding independent-school operational expenses but not capital expenditures (e.g., buildings, equipment) results in capital savings, and all partial funding of operating costs will realize savings from the difference between the per-student amount to public schools and the allocation to funded independent schools. Therefore, the more students that transfer to partially funded independent schools, the more fiscal savings that will result. Moreover, as we are assuming a share (7.6%) of existing and future independent students will enrol at non-funded schools—as that preference exists in all provinces, among a minority of independent-school families—every student that migrates from the public to the non-funded system will result in full savings of the entire per-student amount ($9,463). And even without student migration—assuming enrolments are static in each sector—savings will still be realized in any of the partial funding schemes, in the sense that the province is constitutionally bound to fund the education of all school-age students, and thus every student in a school that receives less than the full public-school amount is a net savings to taxpayers—realizing overall savings for the province
Controlling for Roman Catholic–School Enrolment
Another important consideration, relevant to all models, is accounting for Roman Catholic–student enrolment. As Van Pelt, Palacios, and Jackson note, citing Lankford and Wyckoff,
Research has consistently demonstrated that religious preference is a key determinant in independent school selection. Catholicism, in particular, has been found to be a critical factor in the determination of whether a child attends a public or independent school, significantly increasing the probability that a child attends the latter in jurisdictions without publicly supported Roman Catholic schools. 88 88 H. Lankford and J. Wyckoff, “Primary and Secondary School Choice Among Public and Religious Alternatives,” Economics of Education Review 11, no. 4 (1992): 317–37, as cited in Van Pelt, Palacios, and Jackson, “Financial Savings,” 21. Also, see Van Pelt, Hunt, and Wolfert, “Who Chooses Ontario Independent Schools and Why?”
Since only two other provinces—Alberta and Saskatchewan—have Roman Catholic separate schools comparable to Ontario, large proportions of the independent-school students in the other funded provinces—BC, Manitoba, and Quebec—attend Roman Catholic independent schools. It is reasonable to assume that many of these students would likely attend separate schools if that option were available to them, and thus including Roman Catholic independents when applying funding schemes from BC, Manitoba, or Quebec to Ontario would overweight the preference for Roman Catholic schooling and distort the results. Estimates of the proportion of students in Roman Catholic–funded independent schools are therefore made for BC, Manitoba, and Quebec—and subsequently excluded from the analyses.
Controlling for Student-Support Services
Finally, our analysis does not fully consider the higher funding that goes to student-support services (formerly known as special education) at independent schools in the provinces where they exist. Such an estimate requires a separate and more detailed consideration—as conducted in 2019 by Van Pelt, Pennings, and Jackson 89 89 D. Van Pelt, R. Pennings, and T. Jackson, “Funding Fairness for Students in Ontario with Special Education Needs,” Cardus, March 2019, https://www.cardus.ca/research/education/reports/funding-fairness-for-students-in-ontario-with-special-education-needs/. —as every province has multiple and different funding categories for it. There is not a single funding amount for student-support services. In BC, for example, there are three different levels of funding, ranging from $10,300 to $43,000 per student. 90 90 Government of British Columbia, “2020/21 Interim Operating Grants,” May 2021, https://www2.gov.bc.ca/gov/content/education-training/k-12/administration/resource-management/k-12-funding-and-allocation/operating-grants/k12funding-20-21. In Quebec, the per-student amount is specific to each special-needs school. 91 91 Québec Ministère de l’Éducation et de l’Enseignement supérieur, “Guide Général du Financement.” In Saskatchewan, the amount is negotiated on a per-student basis. 92 92 Government of Saskatchewan, “Registered Independent Schools Regulations,” Pub. L. No. Chapter E-0.2 Reg 27 (2018), https://publications.saskatchewan.ca/api/v1/products/91108/formats/107986/download. D. Van Pelt, “Qualified Independent Schools in Saskatchewan: An Examination of a Recent Policy Change for a New Category of Funded Independent Schools,” Cardus, September 2018, https://www.cardus.ca/research/education/reports/qualified-independent-schools-in-saskatchewan/. Rather, to the extent that students with student-support services are enrolled in independent schools, our general model assumes that they receive the same funding as all students.

Three Enrolment Scenarios
An important question that arises for our analysis is, What would the impact of independent-school funding be on student enrolment? Predicting the future is a difficult, if not impossible, exercise. However, we can make plausible approximations for the immediate term.
We hypothesize three plausible alternative enrolment scenarios for our analyses, based on actual experiences in Canada, to estimate as accurately as possible what such funding would cost taxpayers in the first year of introduction. We do not make projections beyond year 1 of funding, as the future is unpredictable and such estimations—regardless of methodology—would be purely speculative. Rather, we present three enrolment scenarios—the lower-bound, most plausible, and upper-bound estimate—in the first year funding is hypothetically in place in Ontario, to as accurately as possible estimate what such funding would cost taxpayers in reality.
Scenario 1. No Increase in Independent-School Enrolments
Under the lower-bound scenario, we assume that with partial funding there is no difference in independent-school enrolments. Hence, Ontario has 6.8 percent of total province-wide enrolment, or 150,666 students (2018–2019 enrolment), in its independent schools.
Even though a lower-bound is an extreme-case scenario, one needs to be set. Given that without funding Ontario’s independent-school enrolments have been increasing at an annual average rate of 2.6 percent since 2006, 93 93 Authors’ calculations based on Statistics Canada, “Table 37-10-0109-01: Number of Students in Elementary and Secondary Schools,” and Ontario Ministry of Education, “Quick Facts: Ontario Schools, 2016–17,” 2019, http://www.edu.gov.on.ca/eng/general/elemsec/quickfacts/2016_2017.html. we believe holding enrolments constant—that is, no change—for the first year of funding is reasonable as the lowest threshold of enrolment approximations.
Scenario 2. 7.8 Percent Higher Independent-School Official Enrolment
The most defensible scenario is based on Ontario’s now-repealed EETC. Following its introduction, independent-school enrolment increased 7.8 percent overall in the 2002–2003 school year (it increased by 2.5 percent in 2001–2002). Following the repeal, enrolment decreased by about 2.6 percent in the 2003–2004 school year, and again by about 0.3 percent in 2004–2005. 94 94 Authors’ calculations based on Statistics Canada, “Table 37-10-0109-01: Number of Students in Elementary and Secondary Schools.” The 7.8 percent increase was largely a result of students migrating from public schools. While this percentile point quantifies a preference for independent schools in Ontario, we acknowledge that enrolment could be even higher in the case of direct funding to independent schools compared to a tax credit for parents, since the amount parents must pay out of pocket up front is lower—or zero. The resulting enrolment in independent schools is also likely to be higher than in 2001, given continuous increase in enrolment in independent schools in Ontario over the years, even in the absence of public funding. In all, scenario 2 assumes 162,418 students—or 7.4 percent of all Ontario students—enrolled in Ontario’s independent schools, which is 7.8 percent higher than the 2018–2019 baseline (150,666 students).
Scenario 3. 18.3 Percent Higher Independent-School Official Enrolment
For the upper-bound scenario, we look to the most recent Canadian experience introducing independent-school funding. Saskatchewan gives us the opportunity to observe the effect of a similar policy shift as the one being considered in this study, in tandem with the response of the independent-school sector.
In December 2011, in addition to its four pre-existing independent-school categories (three of the four receive some level of funding; see appendix 3 for details), Saskatchewan created a new Qualified independent-schools category. They receive 50 percent of the average public-school, per-student amount toward their operating expenses. 95 95 Government of Saskatchewan, “Qualified Independent Schools,” 2021, https://www.saskatchewan.ca/government/education-and-child-care-facility-administration/services-for-school-administrators/qualified-independent-schools. This new category spurred independent-school growth of about 18.3 percent in the 2012–2013 school year.
Scenario 3 uses this 18.3 percent higher enrolment to assume 178,238 students—or 8.1 percent of all Ontario students—enrolled in Ontario’s independent schools (using the 2018–2019 baseline of 150,666 students), 96 96 Authors’ calculations based on Statistics Canada, “Table 37-10-0109-01: Number of Students in Elementary and Secondary Schools.” as a result of 27,572 students transferring from public to independent schools in the first year of funding. This is a defensible upper bound, as 25,000 Roman Catholic students transferred from independent to separate schools—“probably the largest such movement in modern North American history” 97 97 D. Allison, “Expanding Choice in Ontario’s Public Schools,” Fraser Institute, November 2015, 14, https://www.fraserinstitute.org/sites/default/files/expanding-choice-in-ontarios-public-schools.pdf. —immediately following the extension of full funding to all Roman Catholic separate school students, as a result of many Roman Catholic non-funded independent schools changing their status to Roman Catholic publicly funded separate schools (see appendix 2 for further context and detail).
This is not predictive of what will happen in Ontario upon introducing such a policy, but merely the most defensible upper bound—in other words, 18.3 percent is the most extreme increase that is reasonable to imagine in the first year of funding. Like the lower bound, the upper bound is possible but highly unlikely. 98 98 Although Saskatchewan’s independent-school enrolment has experienced the fastest percentage growth in the country—34 percent over the seven years between 2011 and 2018—in real terms, this is an increase of just 1,318 students in total, or 188 students per year, in a province where total K–12 enrolment has increased by 19,701 students in the same period, from 172,551 students in 2011–2012 to 192,252 students in 2018–2019. Moreover, Saskatchewan is a much smaller province than Ontario with a far smaller proportion of students enrolled in independent schools (about 2.7 percent compared to 6.8 percent for Ontario in 2019). Accordingly, there is little ground for fearing a large transfer of students from public to independent schools, as discussed below.

Mass Exodus Unlikely and Other Enrolment Considerations
Will funding independent-school students lead to a mass exodus of students from public to independent schools? The above scenarios implicitly answer this in the immediate term, and our analyses do not estimate beyond the first year of funding, as such speculation is outside the scope of study. However, it is worth briefly addressing whether mass movement is plausible, given the frequency and vigour of the alarm sounded by those ideologically opposed to such funding.
It is worth reiterating here that most students in Canada—regardless of jurisdiction and policy environment—are enrolled in their locally assigned district school. The implication of this for our analyses is that even with funding for independent schools, the overwhelming majority of Ontario’s K–12 students will almost certainly remain in one of the province’s public-school systems.
This has been the experience elsewhere—as well as historically. In addition to the aforementioned short-run upper bound, when we look at the experience of the provinces that partially fund independent schools, we also see limited enrolment uptake in the long run. Alberta has had funding since the 1960s, BC since the 1970s, and yet independent-school enrolment remains a small share of total enrolment in both provinces. Appendix 2 discusses this in detail.
Appendix 2 also details the enrolment changes Ontario experienced following the 1990 court decision that extended full funding to Roman Catholic separate-school students in grades 11, 12, and 13. In short, their high school enrolment mirrored the share of Roman Catholics in that age cohort in Ontario. 99 99 Allison, “Expanding Choice in Ontario’s Public Schools,” 15. Growth or decline in Catholic-school enrolment was and is reflective of the growth or decline in the number of school-age Catholics in Ontario.
This is relevant for our analyses, as we believe it is reasonable to extend this assumption to other school types and their school communities. Regardless of religion, the number of Ontarians interested in enrolling at a particular religious school is predominantly limited to the number and share of Ontarians in that religious community. This is not to say that all students at a religious school are religious, 100 100 M.L. Pelz and K.R. den Dulk, “Looking Within or Reaching Out? The Effects of Religion on Private Enrollments in an Era of School Choice,” Politics and Religion 11, no. 1 (2018): 79–115, doi:10.1017/S1755048317000499. Also, see Hunt and Van Pelt, “Who Chooses Independent Schools in British Columbia and Why?”; Van Pelt, Hunt, and Wolfert, “Who Chooses Ontario Independent Schools and Why?”; and Hunt and Leistra, “Who Chooses Alberta Independent Schools and Why?” but the target audience and large majority of enrolment reflect the school’s religion. The same applies to specialty schools. There are only so many students, for example, that require student-support services and a school specialized in serving their particular education needs.
Thus, equitably funding students to attend the school of best fit, even if the school is independent, is highly unlikely to cause major disruptions to the existing school systems. In other words, an immediate mass transfer of students to fully funded independent schools is very improbable. But for those individual students with unmet needs in the current system—whether physical, spiritual, cultural, or academic—the opportunity to enroll at an independent school of fit can, truly, be the difference between a robust and impoverished education and an enjoyable or traumatic school experience.
Analysis and Costing Estimates
The general model is applied in this section to seven specific funding schemes, to estimate the cost of funding independent schools in Ontario. The first model estimates the cost of Ontario independent schools receiving full operational funding, on par with public schools. The remaining six models examine the existing Canadian approaches that currently provide partial independent-school funding.
While regulatory requirements for receiving funding, such as school operational compliance and other stipulations, are presented before each estimation, it is unrealistic for Ontario to adopt other provinces’ local particularities, and as such, the implementation of the models is outside the scope of this analysis. Moreover, each funding approach emerged over time, through a combination of interests and opportunities, and was thus designed to suit unique circumstances—which cannot be replicated in Ontario.
Full Funding: Model 1
This section estimates the costs of full operational funding for Ontario independent schools, equivalent to public schools.
Understanding Ontario’s Education System
Figure 6 visualizes the share of enrolment for each of Ontario’s six types of schools: secular Anglophone, secular Francophone, Roman Catholic Anglophone, Roman Catholic Francophone, Protestant Anglophone, and independent. Ontario is the only province outside Atlantic Canada that does not offer funding for independent schools. This section outlines cost estimates for a fully funded, six-lane education system, building off the work of scholar Derek J. Allison.
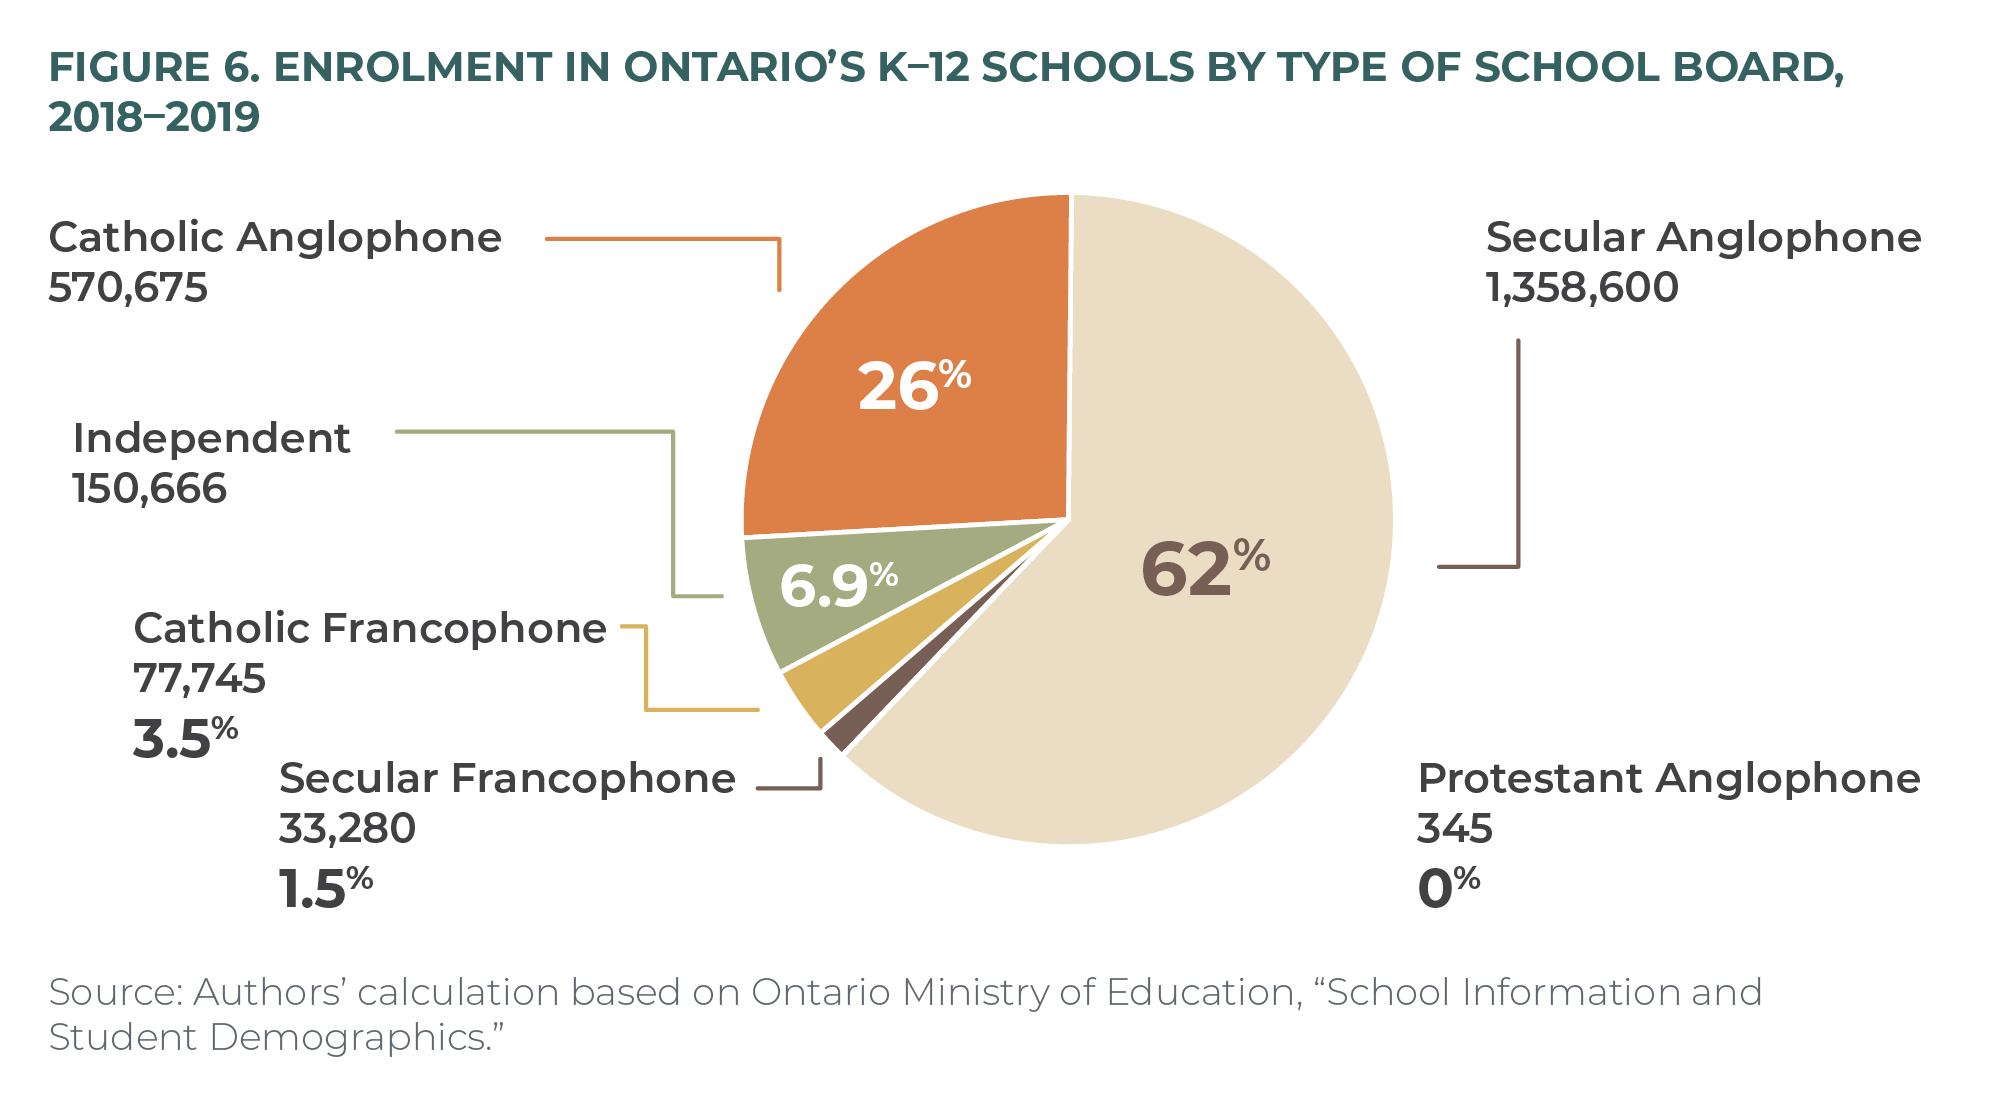
Funding for the sixth lane is expected to cover per-student operating expenditures of independent schools. As previously outlined, three categories of public-school-board operating expenditures—teachers’ salaries, instructional supplies, and student transportation—are allocated to estimate the $9,463 per-student costs based on our calculations from Statistics Canada data on Annual School Board Expenditures in Ontario. (It is again important to note that this estimate does not include operating expenditures for school facilities services or school-board capital expenditures. Within the context of our models, including these other expenditure categories will overestimate the direct costs of funding Ontario’s independent schools.)
Our estimation based on the three categories of operating expenditures is also like the funding scenario in other provinces that fund independent education, whereby funding focuses on operating expenditures and does not include capital expenditures.
Furthermore, we assume that the province has a simple two-tier funding structure so that Ontario would have both funded independent schools and non-funded independent schools.
Applying Full Funding to Independent Schools
Table 3 presents the assumptions for applying the three scenarios set out in our general model, assuming Ontario’s independent schools received full operational funding. Note that the following tables estimating the costs of full funding are all based on the authors’ calculations, applying the previously discussed assumptions, using Ontario Ministry of Education 101 101 Ontario Ministry of Education, “School Information and Student Demographics,” Data Catalogue, 2021, https://data.ontario.ca/en/dataset/school-information-and-student-demographics. and Statistics Canada 102 102 Statistics Canada, “Table 37-10-0109-01: Number of students in Elementary and Secondary Schools.” Statistics Canada, “Table 37-10-0065-01: School Board Expenditures.” data.
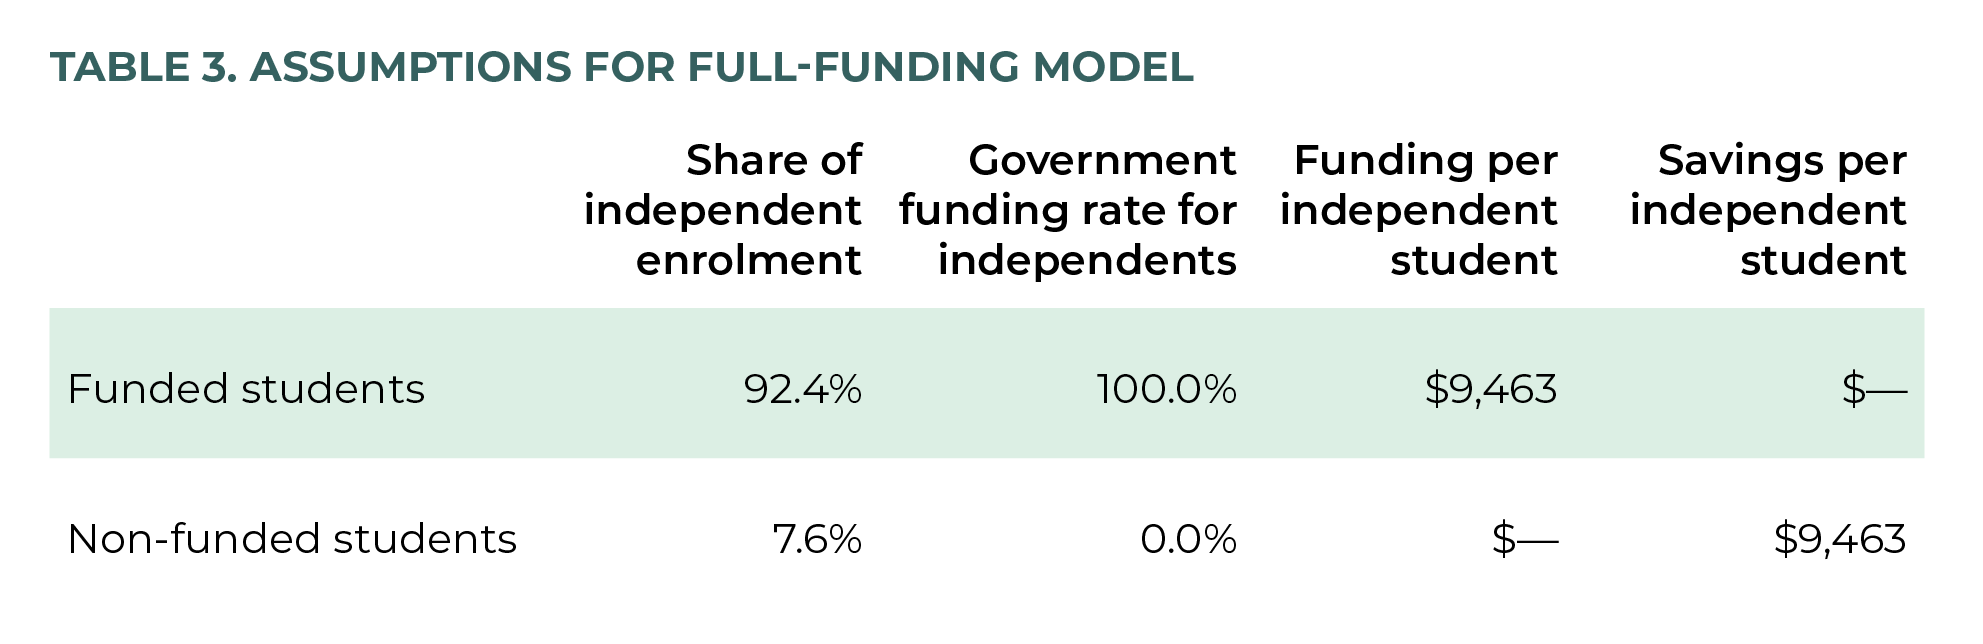
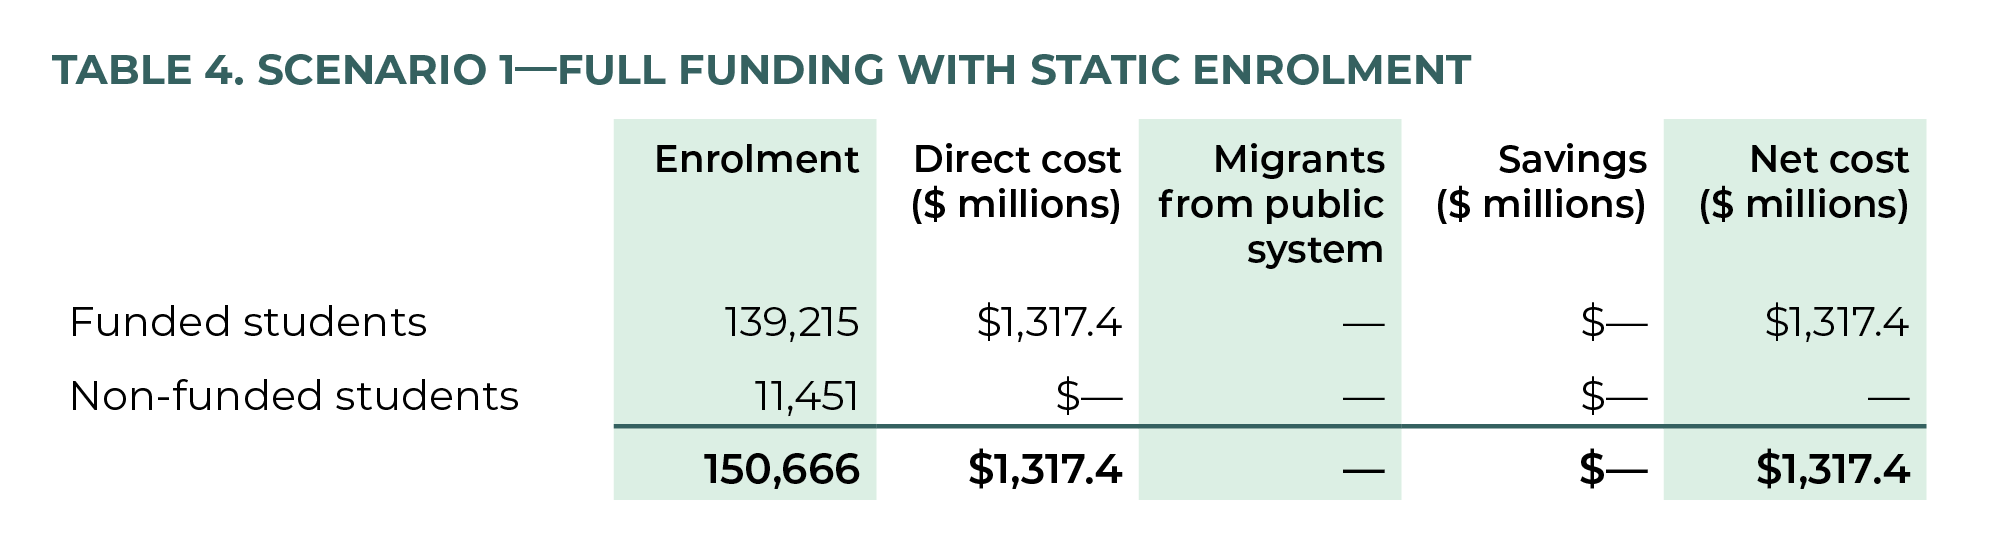
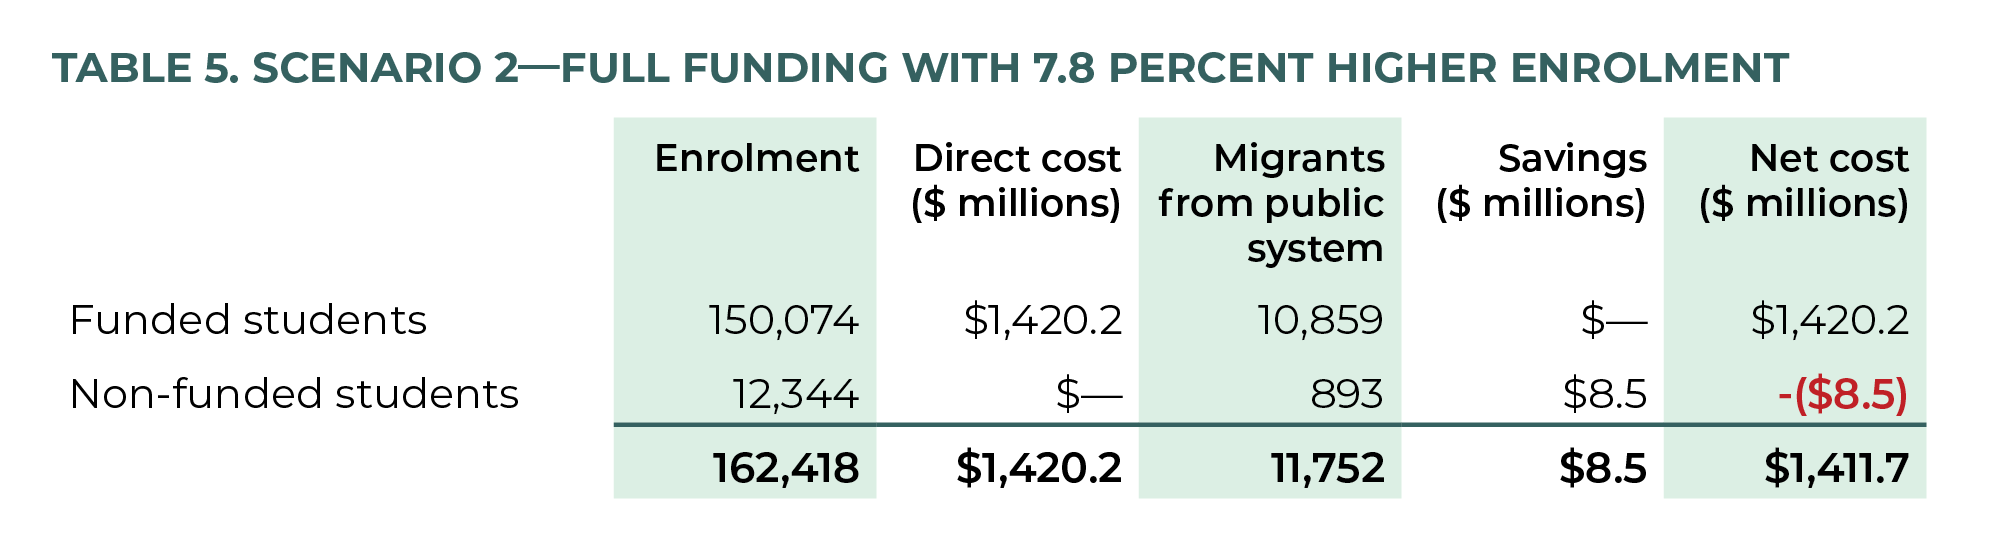
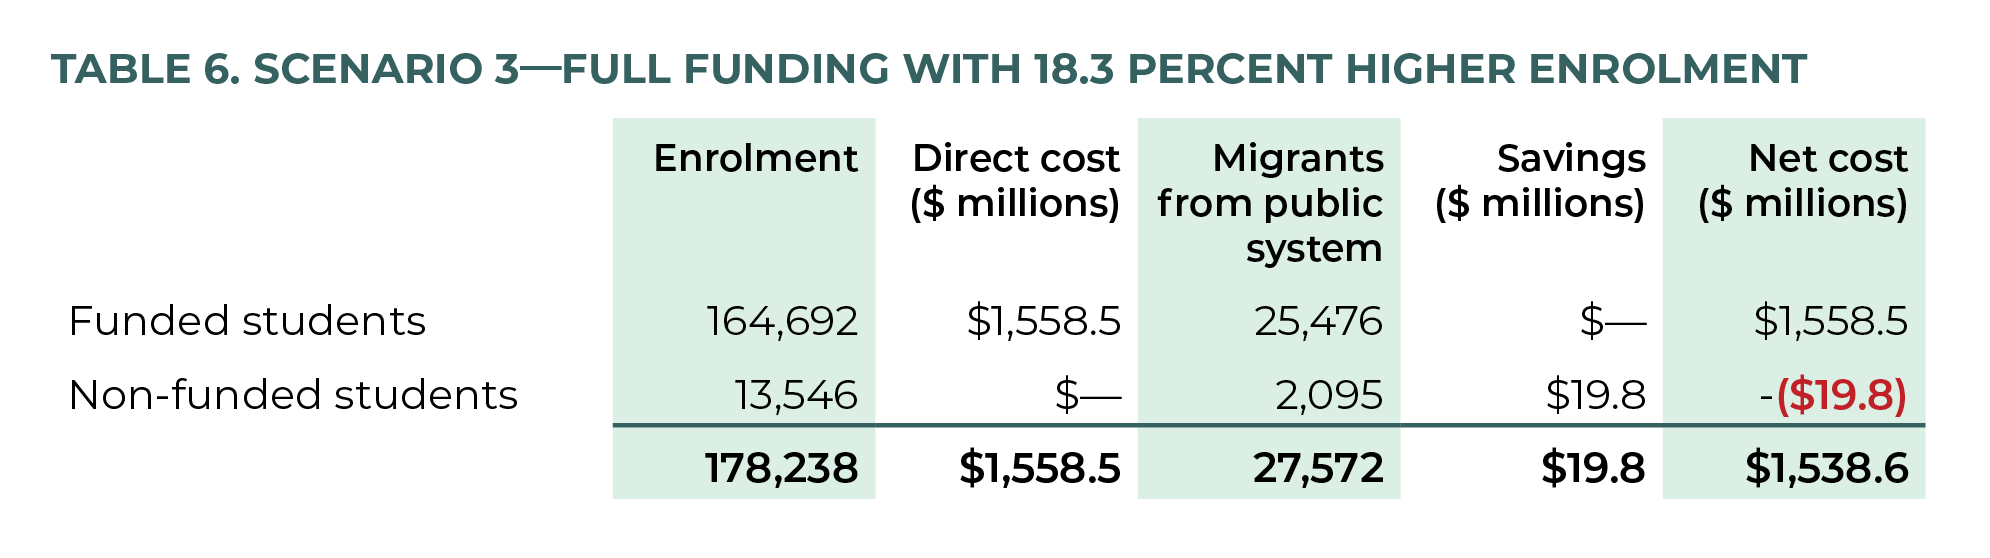
Scenario 1, using Ontario’s 2018–2019 independent-school enrolment numbers, estimates the direct cost of funding 139,215 independent-school students to be $1.32 billion at a per-student operating cost of $9,463 in Ontario. This scenario does not involve any migration of students from public to independent schools, as presented in table 4.
Scenario 2 assumes a 7.8 percent higher Ontario independent-school enrolment, at 162,418 students, based on 11,752 students migrating from public to independent schools. Assuming 92.4 percent of independent-school students are funded, 103 103 As previously discussed, 92.4 percent is the Canadian average for provinces with funding. the direct cost of fully funding independent schools (at $9,463 per student) is $1.42 billion, less the small savings realized from 893 students migrating from the public system to non-funded independent schools, as shown in table 5. The resulting net cost is $1.41 billion. 104 104 Not accounting for ancillary funding for increased (or decreased) government administration or oversight, as established earlier in the General Model.
Under scenario 3, Ontario’s independent-school enrolment is 18.3 percent higher, at 178,238 students, from 27,572 student transfers from public to independent schools. Applying the same assumptions of 92.4 percent of independent-school students funded at a per-student operating cost of $9,463, we arrive at a direct cost of $1.56 billion to fund independent schools. However, with the small transfer of students from public to independent schools, the net cost under scenario 3 is $1.54 billion, as table 6 presents.
Alberta: Model 2
Alberta has a diverse taxpayer-funded education system, perhaps the most pluralistic in Canada, and this extends to the level of support and funding available to its independent schools. In addition to its Roman Catholic separate school system, it funds religious “alternative” public schools (including Christian and Islamic schools in several public districts), the only charter schools in Canada, and homeschoolers (a sector that has nearly doubled in size in the province since the COVID-19 pandemic. 105 105 The number of homeschool students in Alberta increased from 13,558 in 2019–2020 to 24,417 in 2020–2021. See table 2 in Government of Alberta, “Student Population Statistics,” 2021, https://www.alberta.ca/student-population-statistics.aspx. )Alberta has three types of independent schools, one of which receives partial public funding.
Understanding Alberta’s Independent-School System
Table 7 recapitulates Alberta’s independent-school regulatory categories, funding, and respective share of enrolment. Alberta’s three categories of independent schools are Registered private schools, Accredited Non-funded private schools, and Accredited Funded private schools. 106 106 Alberta’s legislation and regulations still refer to independent schools as private schools. Only the latter receive partial taxpayer funding, which they receive via grants under the Education Grants Regulation. Registered private schools in Alberta are the least regulated of the three types and must meet a basic set of requirements as set out in the Education Act and the Private Schools Regulation. 107 107 Sections (2), (3), (4), (5), and (21). They are not required to employ provincially certified teachers or to teach the provincial curriculum. However, they cannot grant credit for senior high school courses. 108 108 Government of Alberta, “Establishing a Private School: Application Process and Requirements,” 2018, 4, https://open.alberta.ca/dataset/d6185185-28e0-4b73-8d5f-293777df363f/resource/2d41f3d8-739c-408a-adbf-0c6307ec8ccb/download/edc-establishing-private-school-application-process-and-requirements-2018.pdf. Accredited Non-funded private schools are required to meet the same basic requirement as Registered private schools, as per the Education Act and the Private Schools Regulation. 109 109 Sections (6), (8), (9), and (10). In addition to the basic registration requirements of Registered private schools, Accredited Non-funded private schools must employ provincially certified teachers. But unlike Registered private schools, Accredited Non-funded private schools can grant senior high credits. Last, Accredited Funded private schools are also guided by the Education Act and the Private Schools Regulation. 110 110 Sections (7), (12), (13), (14), (15), (16), (17), (18), (19), and (20). To be eligible for provincial funding, Accredited Funded schools are required to employ provincially certified teachers, teach the government-mandated curriculum, and have a certificated principal. 111 111 Government of Alberta, Education Act, Pub. L. No. Alberta Regulation 93/2019 (2019), https://www.qp.alberta.ca/documents/Regs/2019_093.pdf.
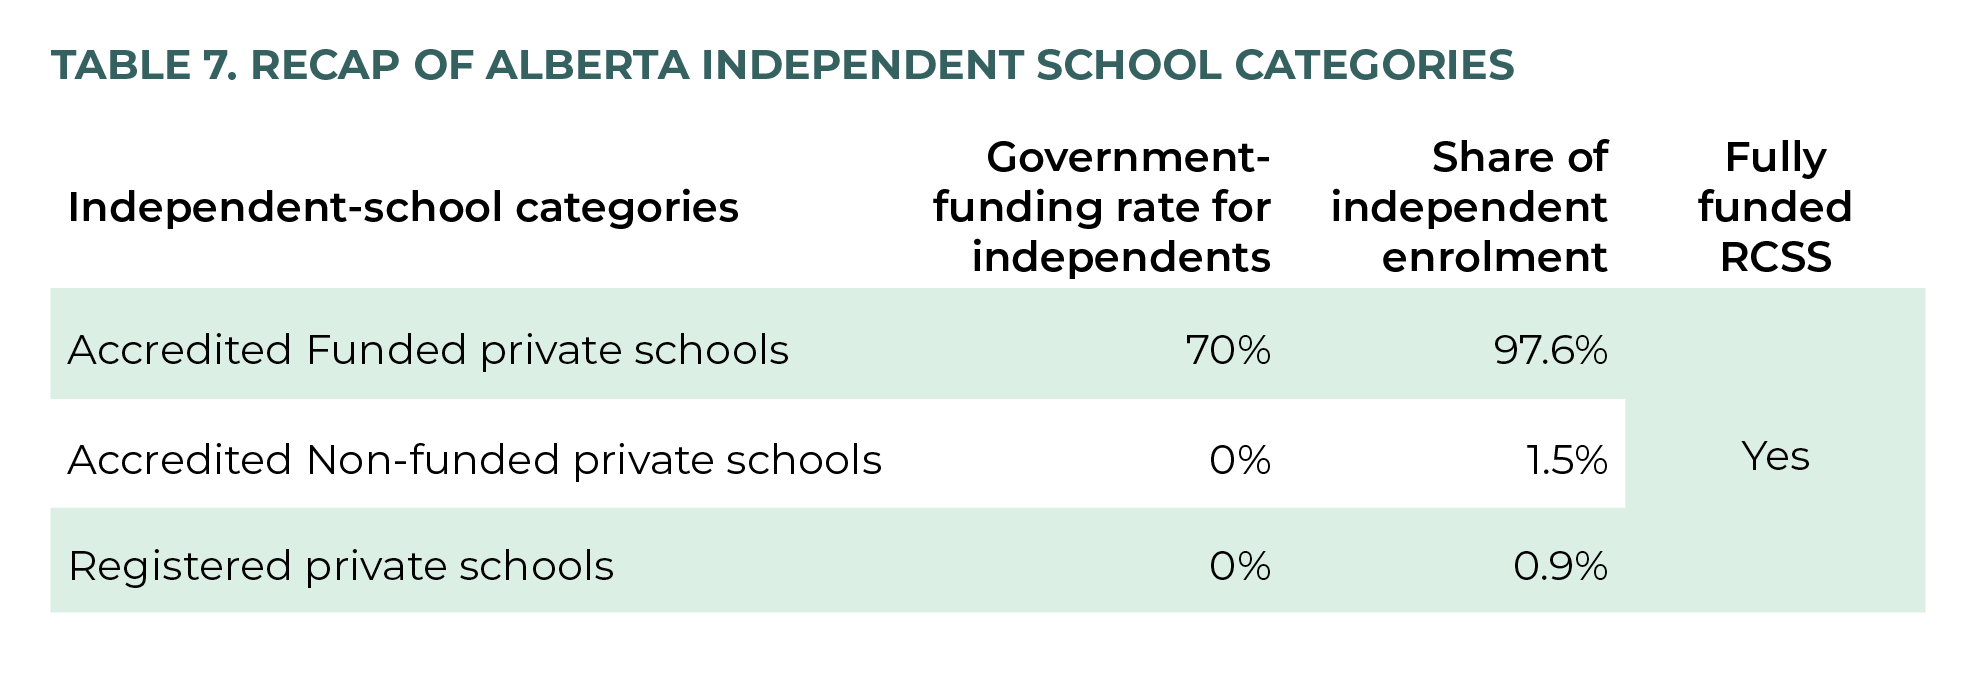
From the 2020–2021 school year, the Alberta system transitioned from using the annual student count as the basis for its education system grants to the Weighted Moving Average (WMA) approach. This funding approach does not allocate funding for specific students. Rather, the WMA approach allocates funding for the entire school. Accredited Funded private schools receive a base instruction grant through this approach. The three-year WMA enrolment is calculated using a different weighted factor for each school year. The budgeted school year (year 3) is allocated a weighted factor of 50 percent, the previous year (year 2) is allocated a factor of 30 percent, and the preceding year (year 1) has a factor of 20 percent. 112 112 Alberta Ministry of Education, “Funding Manual for School Authorities 2020/2021 School Year,” 2021, https://open.alberta.ca/publications/1485-5542.
As of the 2020–2021 school year, the base instruction rate for Accredited Funded private schools is 70 percent 113 113 As stated earlier, there used to be two levels of funding for Accredited Funded private schools, but now there is only one. of the base instruction rates for public-school jurisdictions for the same applicable grade level (the rate for ECS is the same). Schools do not receive grants toward capital expenses. The base instruction rates for Accredited Funded private schools are $4,244.80 for grades 1 to 9 and $4,669.28 for Grades 10 to 12. 114 114 Alberta Ministry of Education, “Funding Manual for School Authorities.”
The allocation formula for the school authorities is as follows:
Base Instruction Rate for applicable grade level ∗ WMA Enrolment
Applying Alberta’s Funding Model to Ontario
In 2018–2019, there were 30,671 students enrolled in Alberta’s independent schools. As shown in figure 7, almost all of them—97.6 percent—were in Accredited Funded private schools (including some homeschooled students), 1.5 percent were in Accredited Non-funded schools, and the remaining 0.9 percent were in Registered private schools.
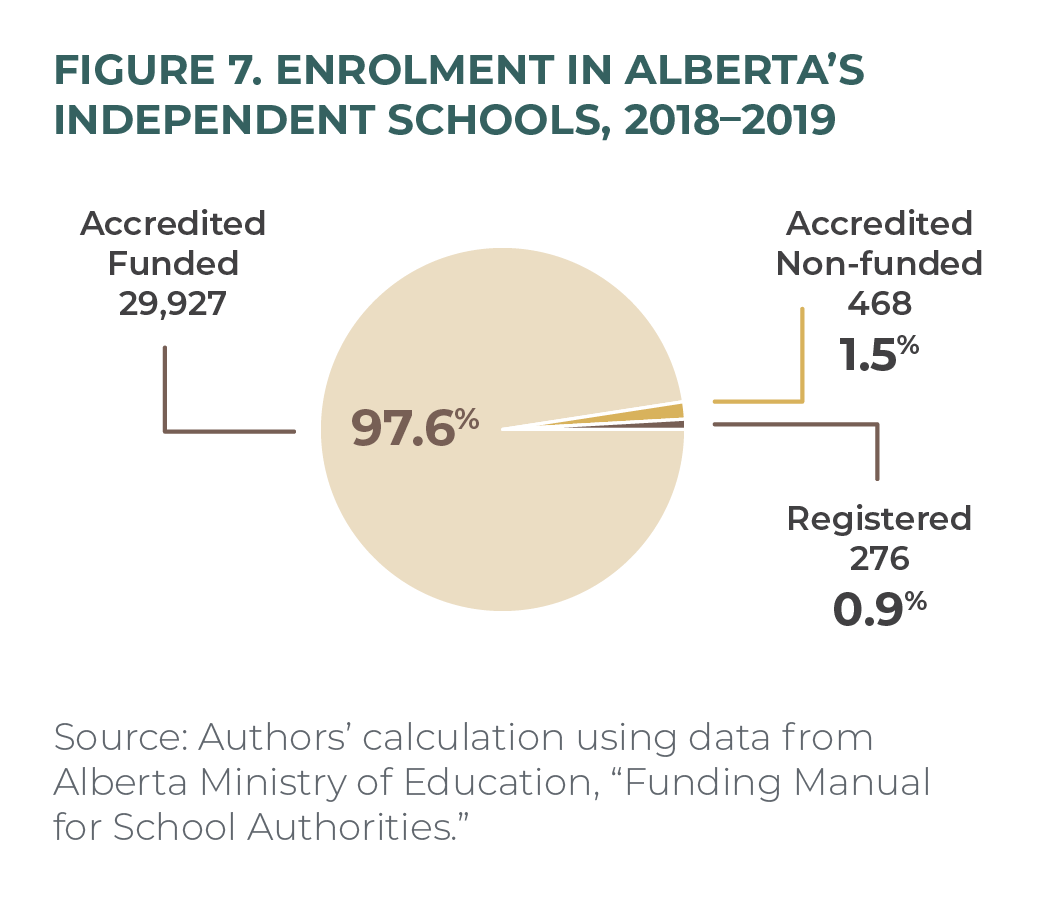
As outlined in the general model, we use the inflation-adjusted per-student operating expenditure in public education of $9,463 (in Ontario) to apply the relative enrolment in Alberta to Ontario such that 97.6 percent of the province’s independent-school students enrol in Accredited Funded private schools. These schools are then funded at 70 percent of the public-school authorities’ per-student amount, at $6,624, as presented in table 8. Given how few Albertans are enrolled in the province’s two non-funded independent-school categories, we have combined the two categories into one for applying the Alberta model to Ontario. Also, note that all Alberta tables, hereon, are the authors’ calculations using Alberta Ministry of Education 115 115 Alberta Ministry of Education, “Funding Manual for School Authorities.” and Statistics Canada 116 116 Statistics Canada, “Table 37-10-0109-01: Number of Students in Elementary and Secondary Schools.” Statistics Canada, “Table 37-10-0065-01: School Board Expenditures.” data, based on the previously discussed assumptions.
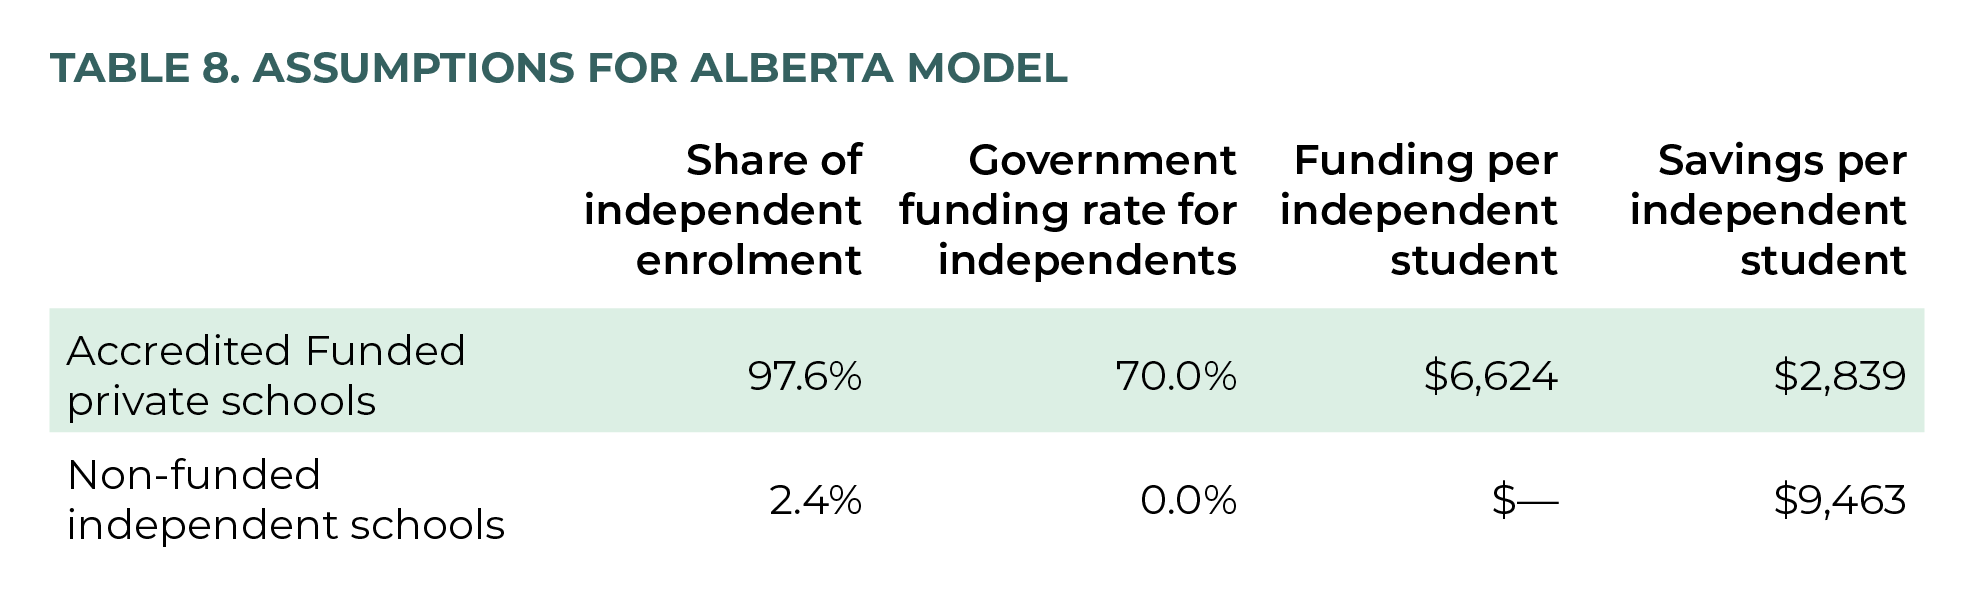
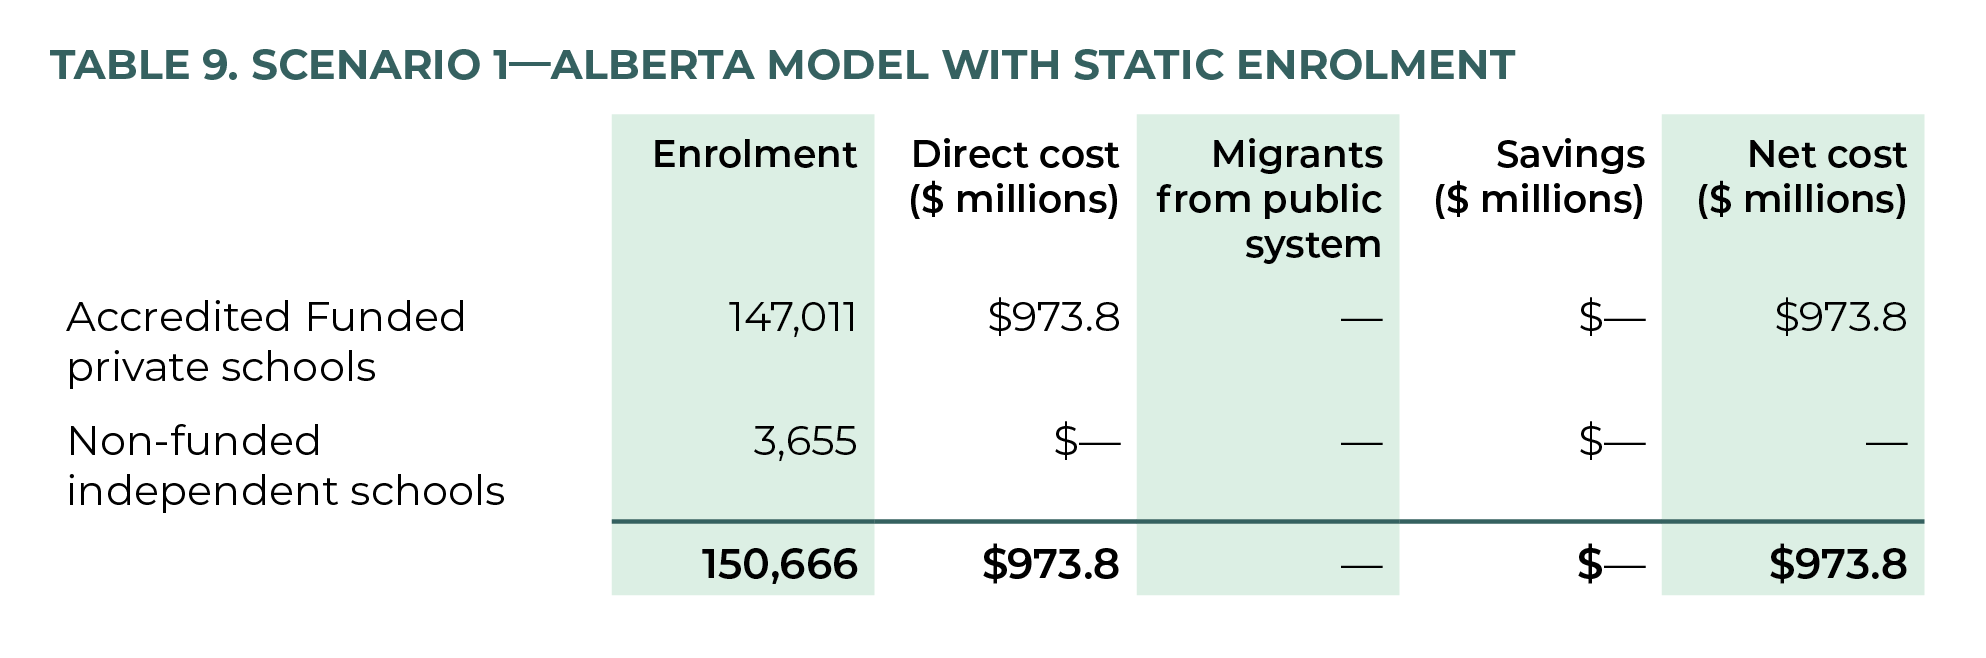
Under scenario 2, working from the same general-model assumptions, we apply the relative independent-school enrolment in Alberta to Ontario, such that there are 158,478 students in the equivalent of Accredited Funded private schools, and a combined 3,940 students in non-funded independent schools. In this case, it would cost about $1.05 billion to directly fund the students in the equivalent of Accredited Funded private schools. As students in these schools cost taxpayers only 70 percent ($6,624) of the per-student cost in public schools ($9,463), and enrolment from public-system migration is higher in this scenario, net savings of $35.3 million result—or, $2,839 per migrated funded student and $9,463 per additional migrated non-funded student. The direct cost of funding, less public- to independent-school migration savings, results in a net cost of $1.01 billion, as displayed in table 10.
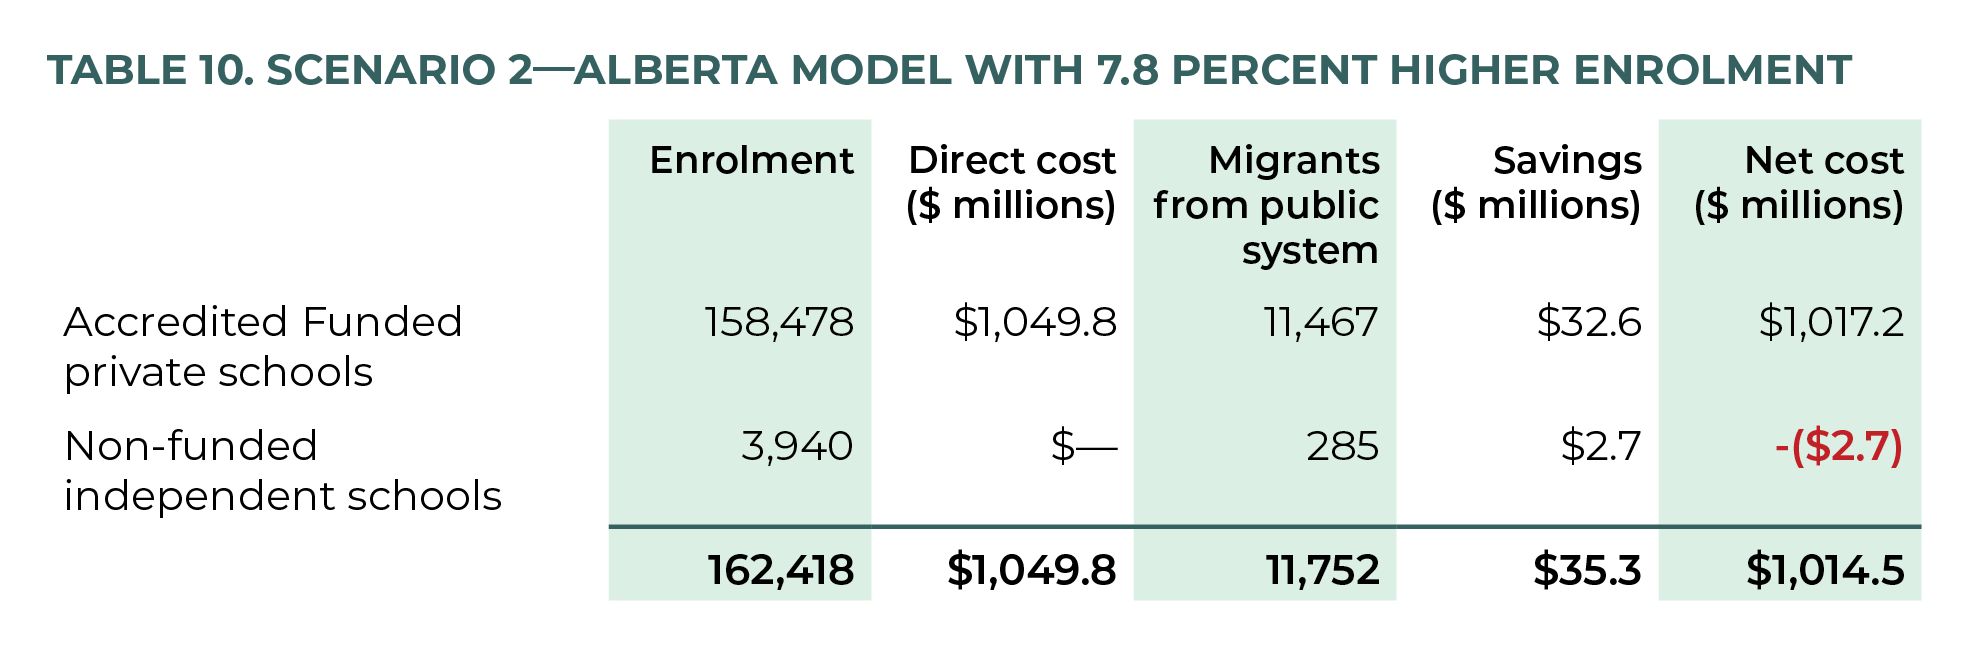
Scenario 3 costs $1.15 billion to directly fund the 173,914 students in the equivalent of Accredited Funded private schools, less $82.7 million saved from students switching from public to independent school, results in a net cost of $1.07 billion, per table 11.
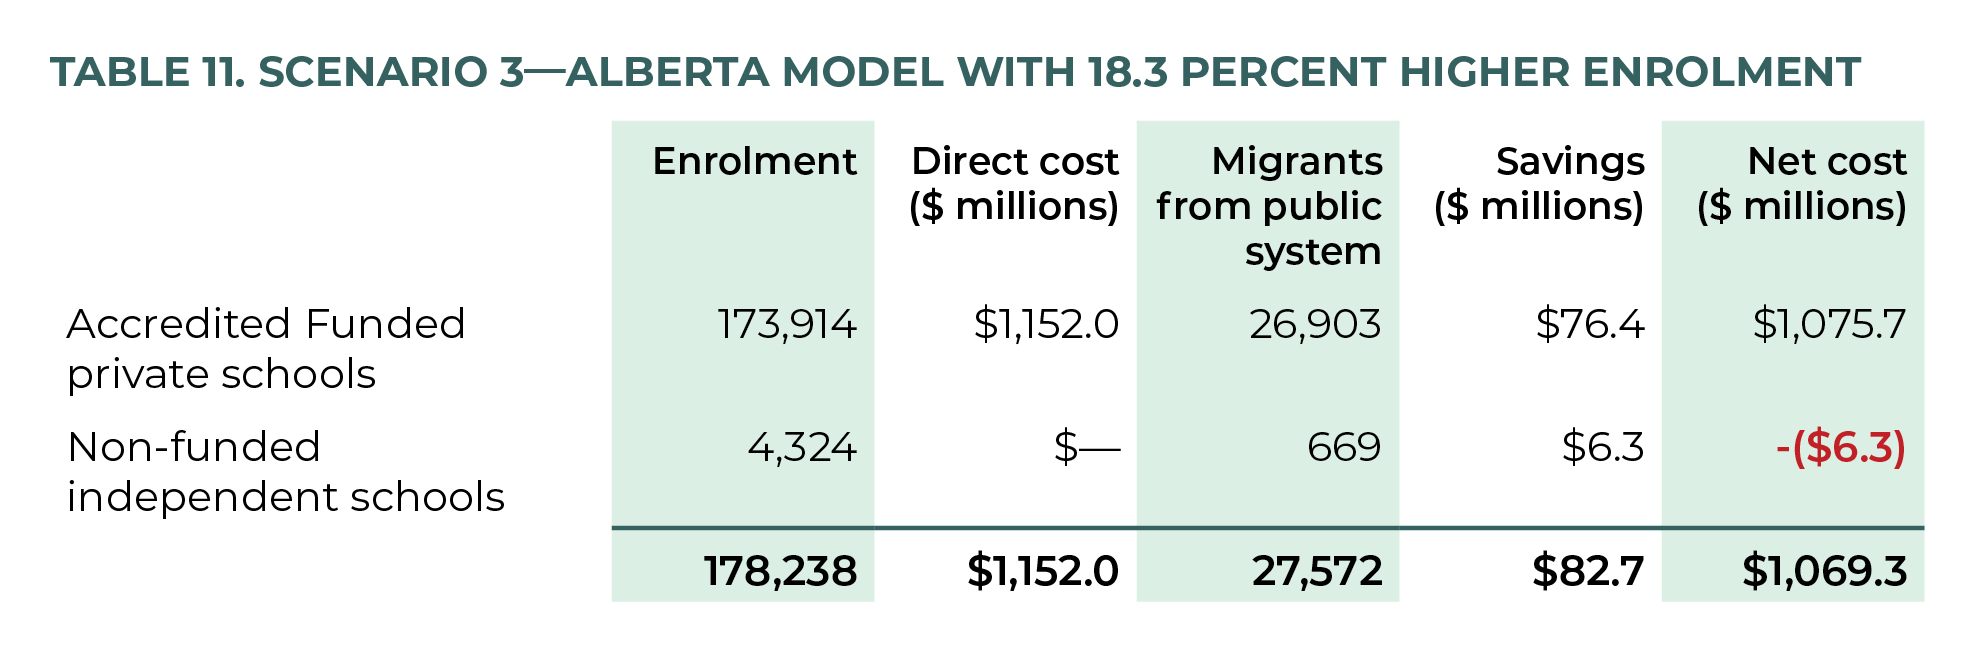
Saskatchewan: Two Models
All provinces’ education systems reflect the evolution of particular interests and opportunities that have emerged at particular points in history, but Saskatchewan’s regulatory landscape is uniquely piecemeal—making it the least replicable in Ontario (with the one possible exception of Quebec). Accordingly, we think it is most appropriate to present two Saskatchewan models. For the sake of consistency with the other provincial models, the first scheme replicates Saskatchewan’s approach in Ontario. The second model, however, takes a realistic approach, by simplifying Saskatchewan’s complex system into two condensed categories that Ontario could readily introduce.
Understanding Saskatchewan’s Independent-School System
Table 12 recapitulates Saskatchewan’s independent-school regulatory categories, funding, and respective share of enrolment. In addition to being one of the three provinces with fully funded, constitutionally protected Roman Catholic separate schools, Saskatchewan has a diverse independent-school landscape, with five regulatory categories of independent schools—four of which receive various levels of partial funding.
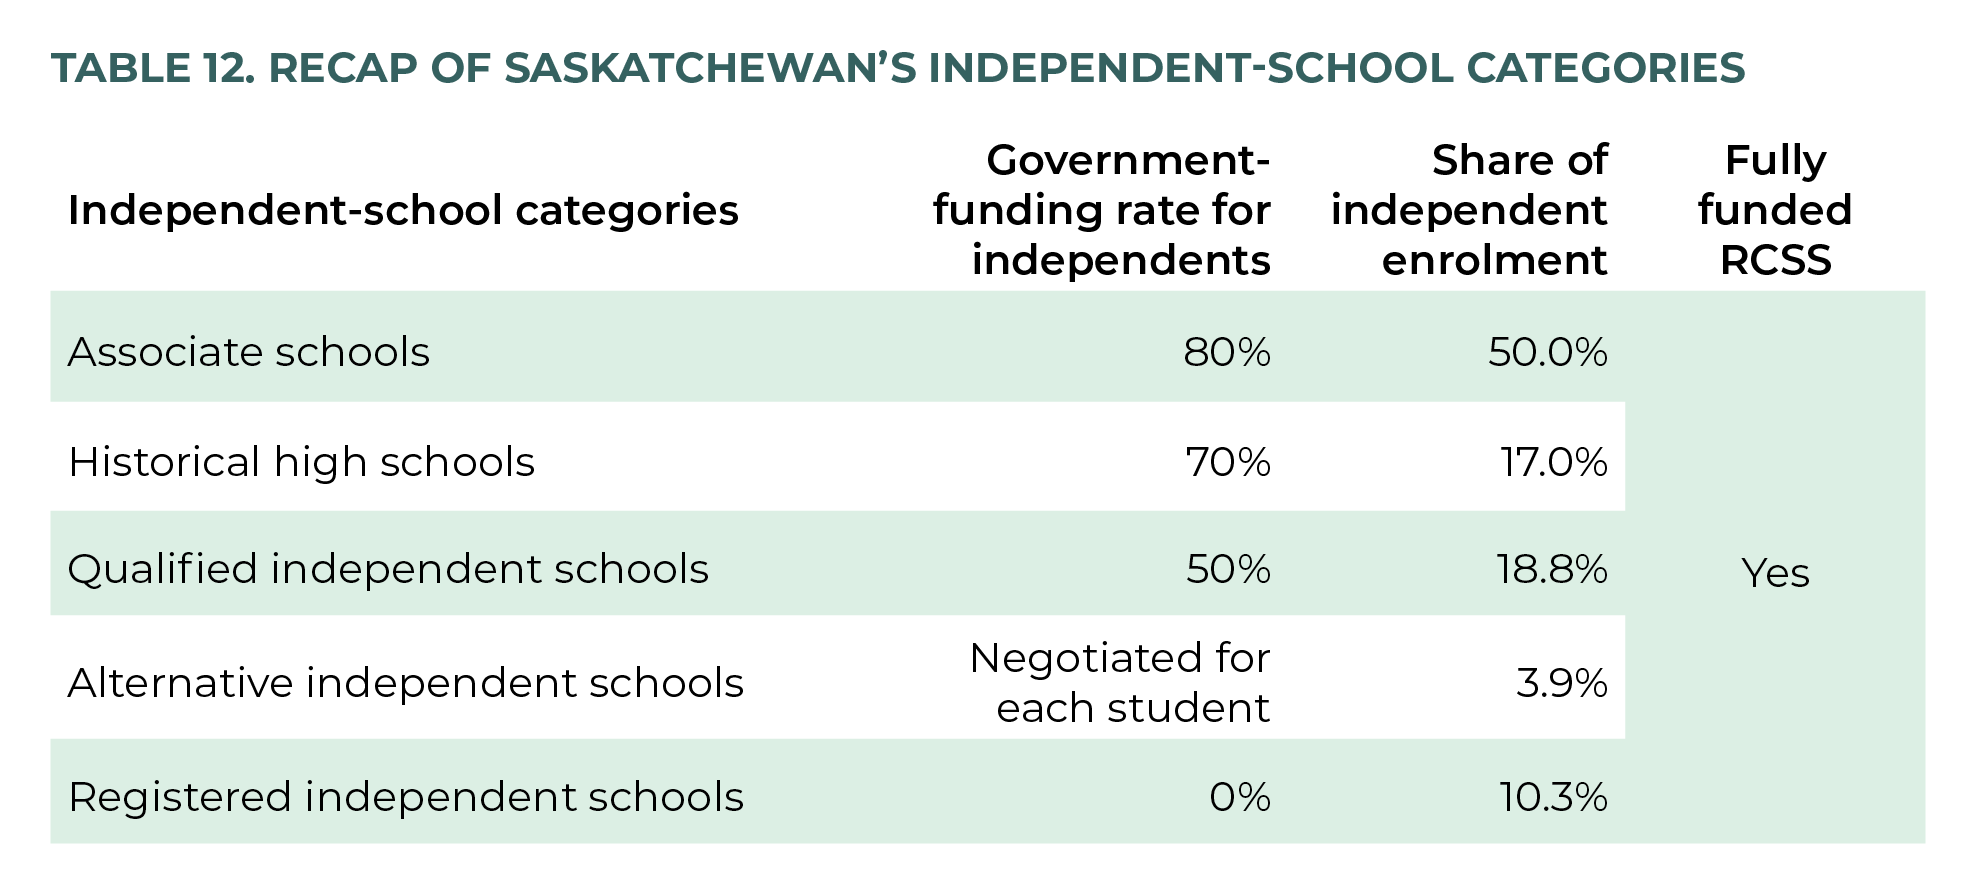
Of Saskatchewan’s five independent-school categories, three are relevant to detail—one of which is pertinent for our cost estimates (see appendix 3 for details on all categories). First, though all independent schools in Saskatchewan must be registered with the government, the category of Registered independent schools exists for those school societies that do not want funding—preferring maximum independence and minimal oversight. Second, given the Associate independent school category is similar to the model recommended by Ontario’s Shapiro Commission, 117 117 The Commission, led by Bernard J. Shapiro, recommended in 1985 that Ontario’s independent schools should receive funding by associating with public school boards. B.J. Shapiro, “The Report of The Commission on Private Schools in Ontario,” Government of Ontario, October 1985, https://archive.org/details/reportofprivschools00comm. resurrected by John Tory in his failed 2007 provincial-election bid and simultaneously widely rejected in Ontario’s independent-school sector at the time, 118 118 Allison, “Bringing School Choice to Ontario,” 20–26. it is improbable that a similar funding policy would be politically feasible today. It is Saskatchewan’s most recently introduced funding category, Qualified independent schools, that is the most—and likely only—Saskatchewan funding scheme that can reasonably be applied to approximate the cost of a similar funding scheme in Ontario.
Qualified independent schools must meet the same basic requirements as Registered independent schools (presented in appendix 3). In addition, they must have operated for two consecutive years before applying for funding, be owned and operated by a non-profit corporation, follow provincial curriculum policy, provide only approved programs, employ only provincially certified teachers, participate fully in the ministry’s accountability framework, submit annual financial statements, agree to be supervised and inspected by ministry officials, and comply with ministry policy and directives. These schools receive partial government funding of 50 percent of the provincial per-student average amount. 119 119 Van Pelt, “Qualified Independent Schools in Saskatchewan.”
Applying Saskatchewan’s Funding Model to Ontario
Figure 8 shows the share of enrolment for the 5,337 120 120 This number is different from the Statistics Canada data (fig. 1) on enrolment in Saskatchewan’s independent schools for the same period. As this data was obtained more recently from the Saskatchewan Ministry of Education, it is likely an updated value. students enrolled in Saskatchewan’s independent schools, in 2018–2019, based on data obtained from the Saskatchewan Ministry of Education. 121 121 Saskatchewan Ministry of Education, “2021–22 Funding Manual: Prekindergarten to Grade 12 Funding Distribution Model,” April 2021, https://publications.saskatchewan.ca/#/products/100142. Of these, 2,670 students (50.0%) were in Associate schools, 1,001 students (18.8%) in Qualified independent schools, 907 students (17.0%) in Historical high schools, 550 students (10.3%) in Registered independent schools, and 209 students (3.9%) in Alternative independent schools.
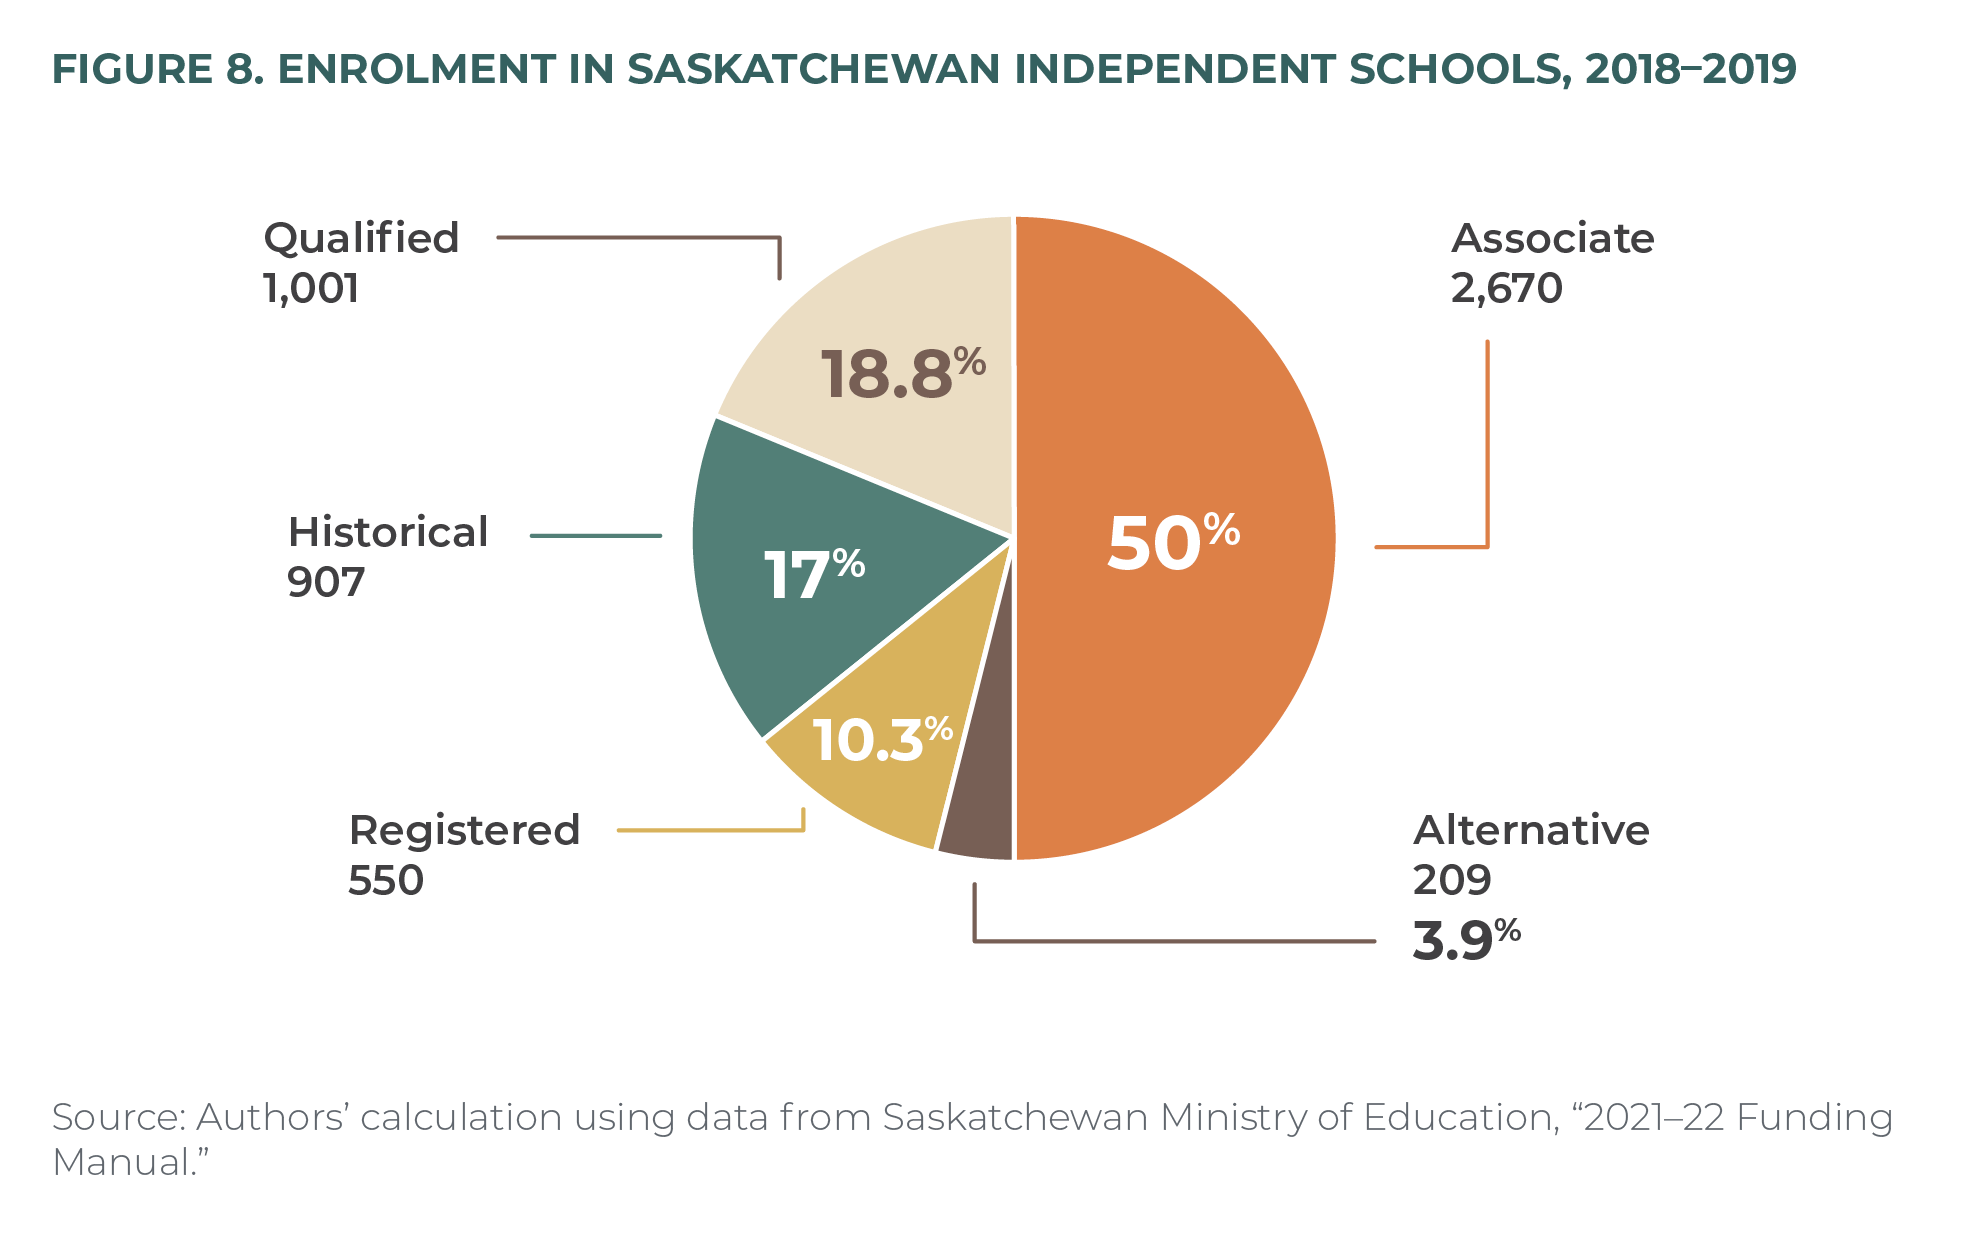
In replicating Saskatchewan’s funding model to Ontario, it is worth noting a few peculiarities of Saskatchewan’s independent-school sector. First, Historical high schools are a closed category. Within Ontario’s current school system, there are several schools that could be designated Historical high schools similar to those in Saskatchewan. However, we refrain from making such classification and simply apply the relative enrolment in Saskatchewan’s schools to Ontario. Second, Saskatchewan’s Alternative schools do not receive a percentage of the funding to public schools. Rather, the funding is determined on a per-student basis, as these schools often cater to students with special needs, and the amount is usually more than the equivalent public-school per-student amount. 122 122 As stated earlier, these schools are funded between $23,728 and $56,190 per student depending on the negotiated requirement to serve the individual student’s special education needs. In our appropriation for Alternative independent schools, we simply assume the students are funded at the same amount as public-school students (i.e., 100%).
Model 3: Saskatchewan Replica
Table 13 encapsulates the aforementioned assumptions, and table 14 presents the scenario 1 cost of direct funding for Ontario’s independent-school students ($929.8 million), proportionately applying the five Saskatchewan categories. All Saskatchewan tables are the authors’ calculations using Saskatchewan Ministry of Education 123 123 Saskatchewan Ministry of Education, “2021–22 Funding Manual.“ and Statistics Canada 124 124 Statistics Canada, “Table 37-10-0109-01: Number of Students in Elementary and Secondary Schools.” Statistics Canada, “Table 37-10-0065-01: School Board Expenditures.” data, based on the previously discussed assumptions.
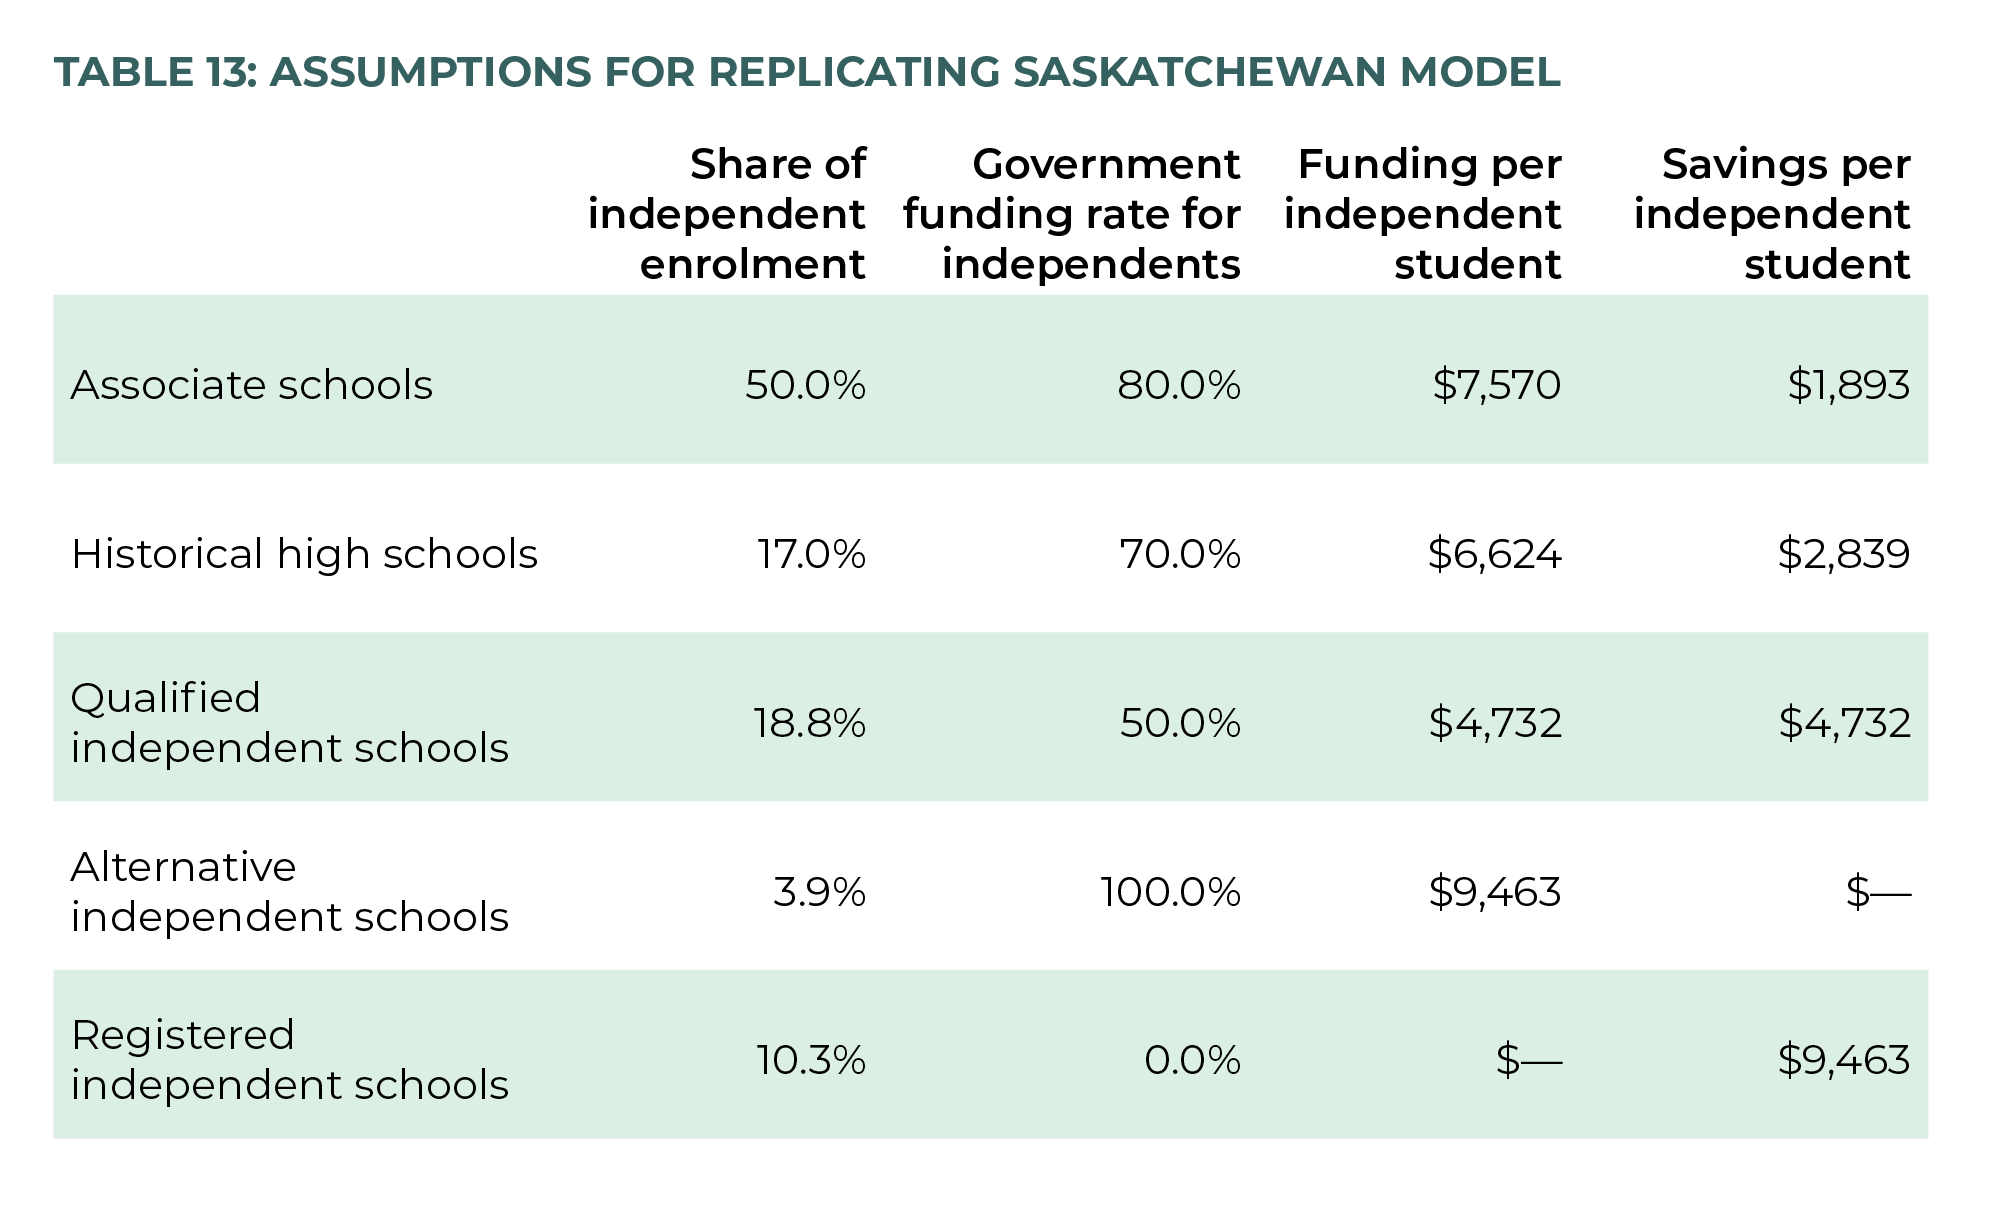
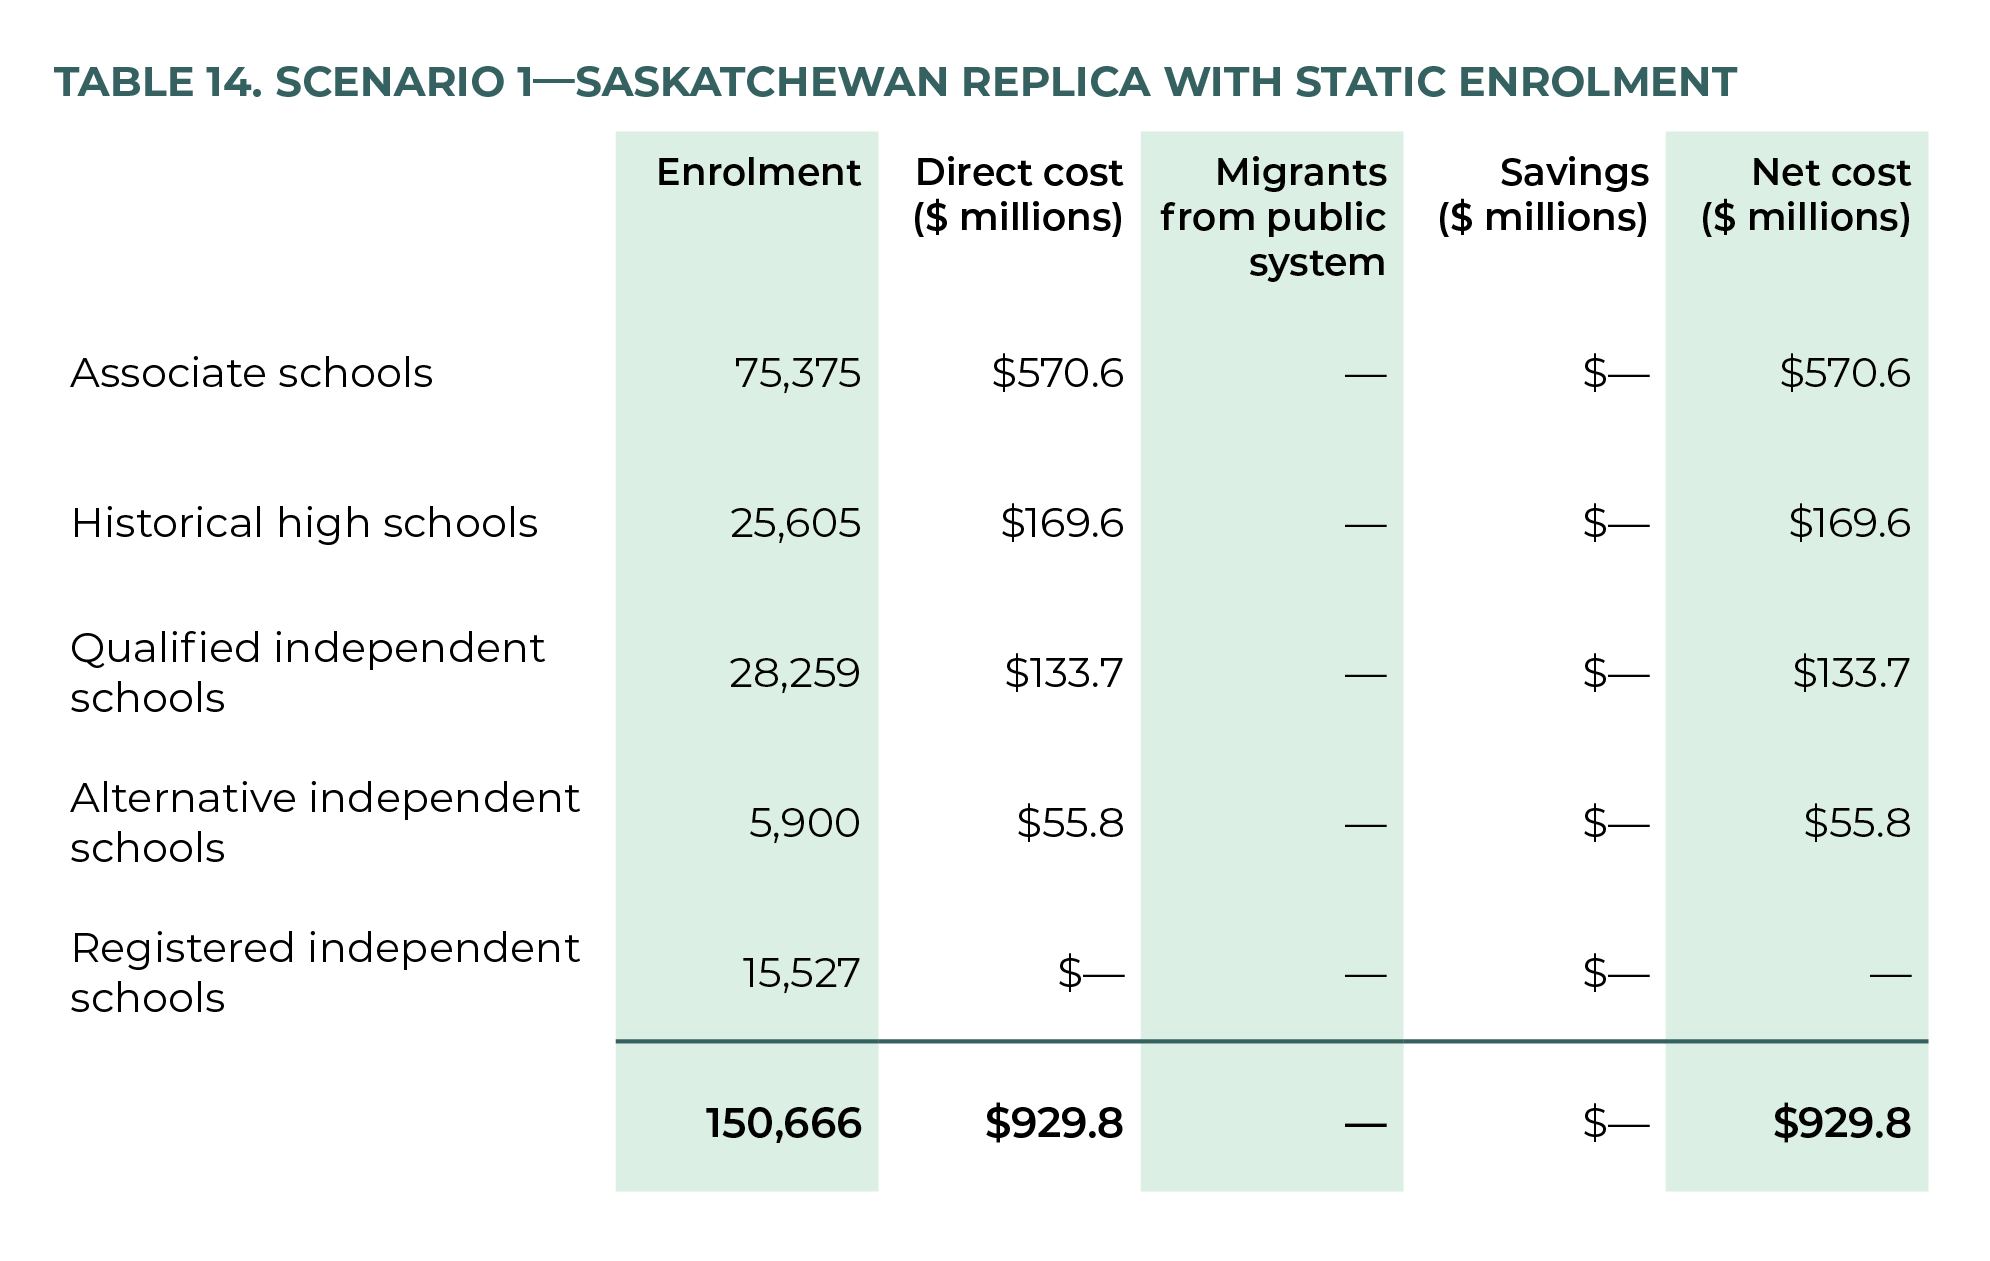
Table 15 presents scenario 2, with a direct cost of $1 billion less $38.7 million in savings from student migration for a net cost of $963.6 million.
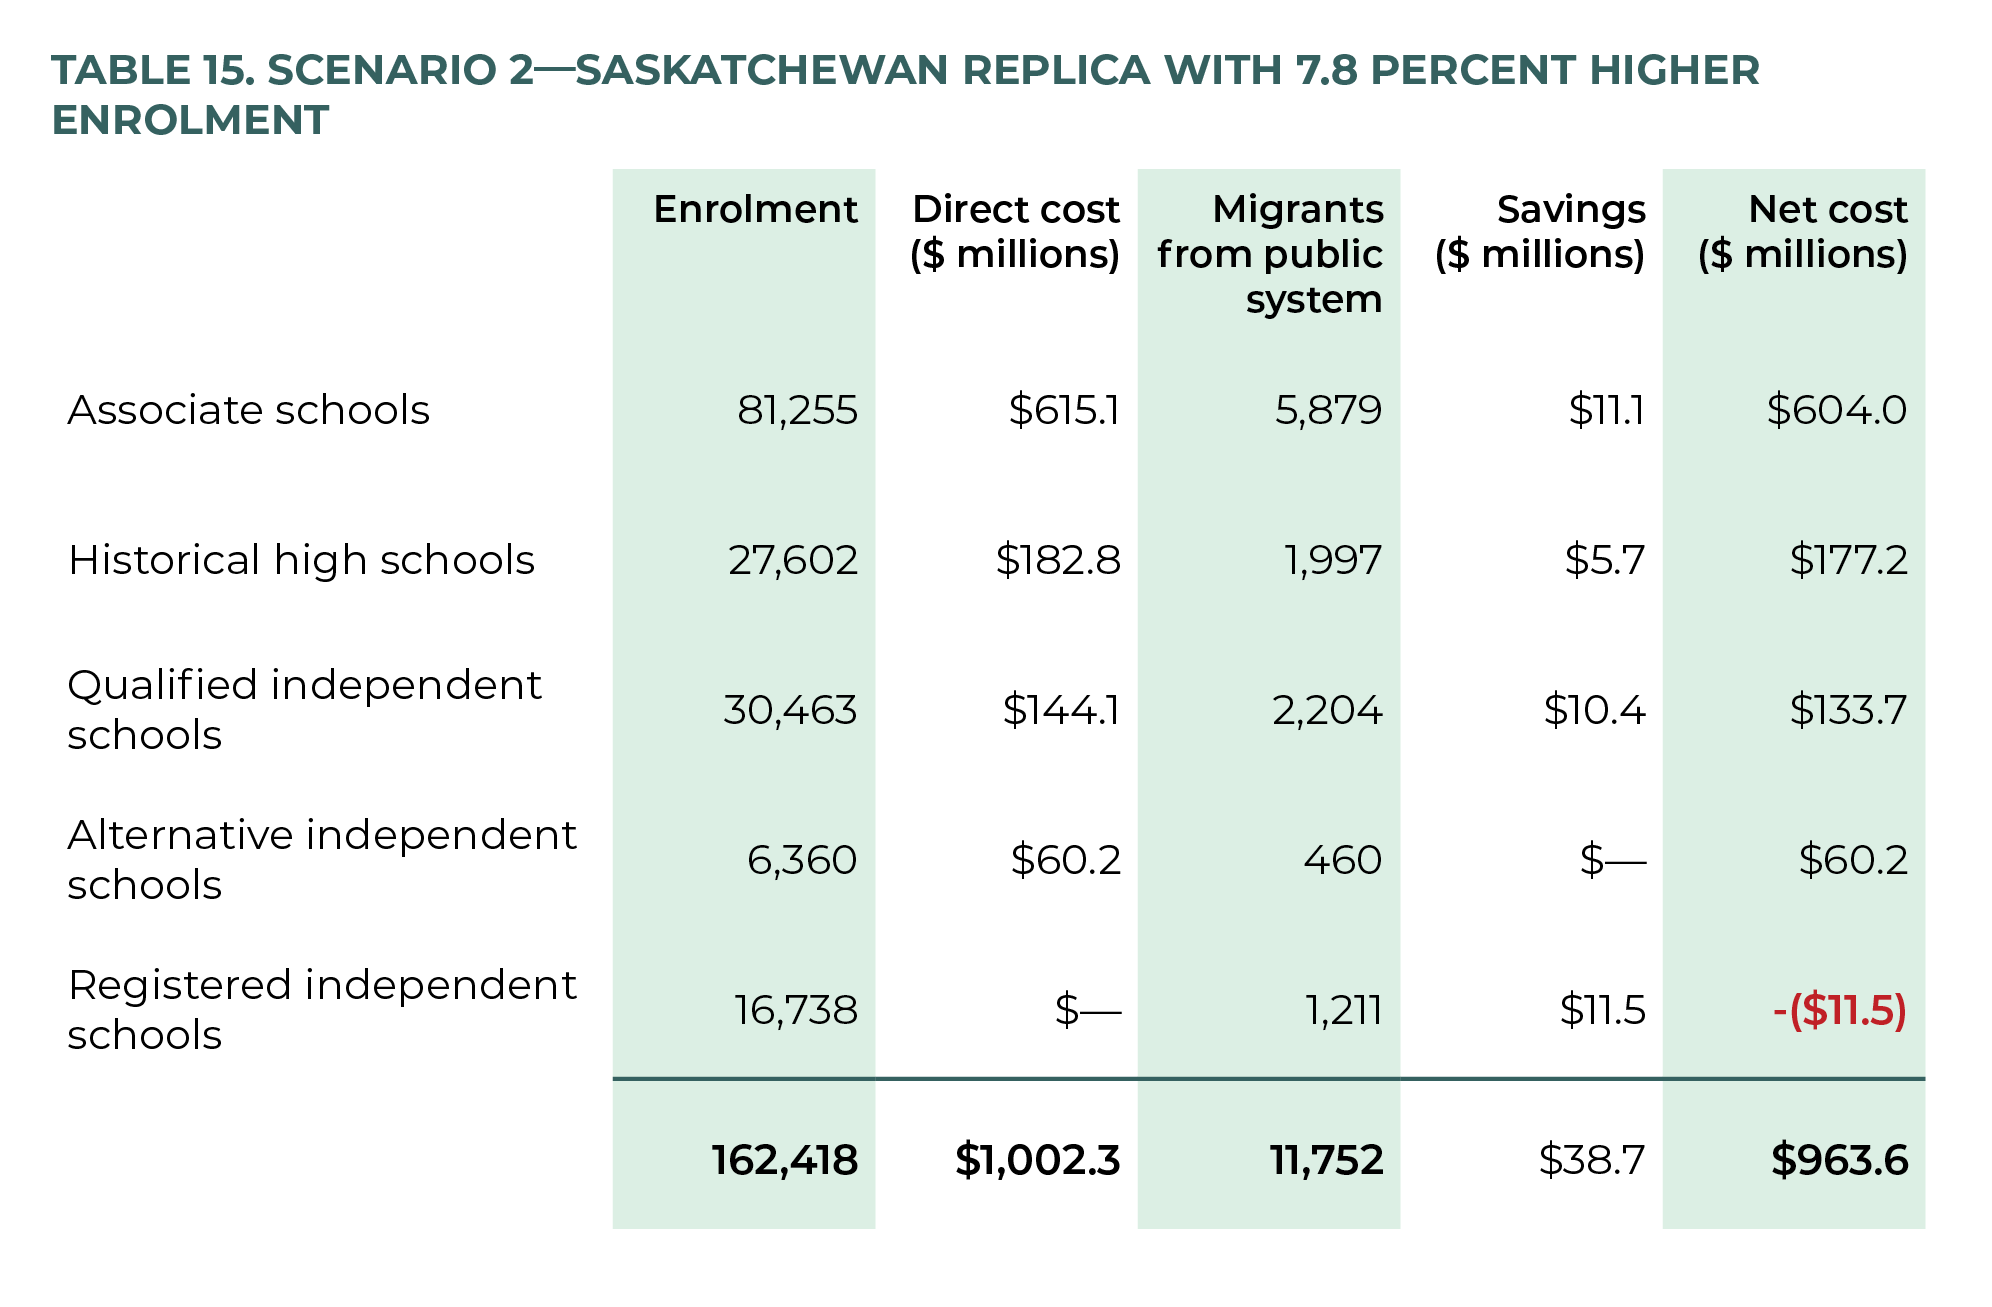
Table 16 presents scenario 3, with direct costs of $1.1 billion less $90.8 million from student transfers, resulting in a net cost of $1.01 billion.
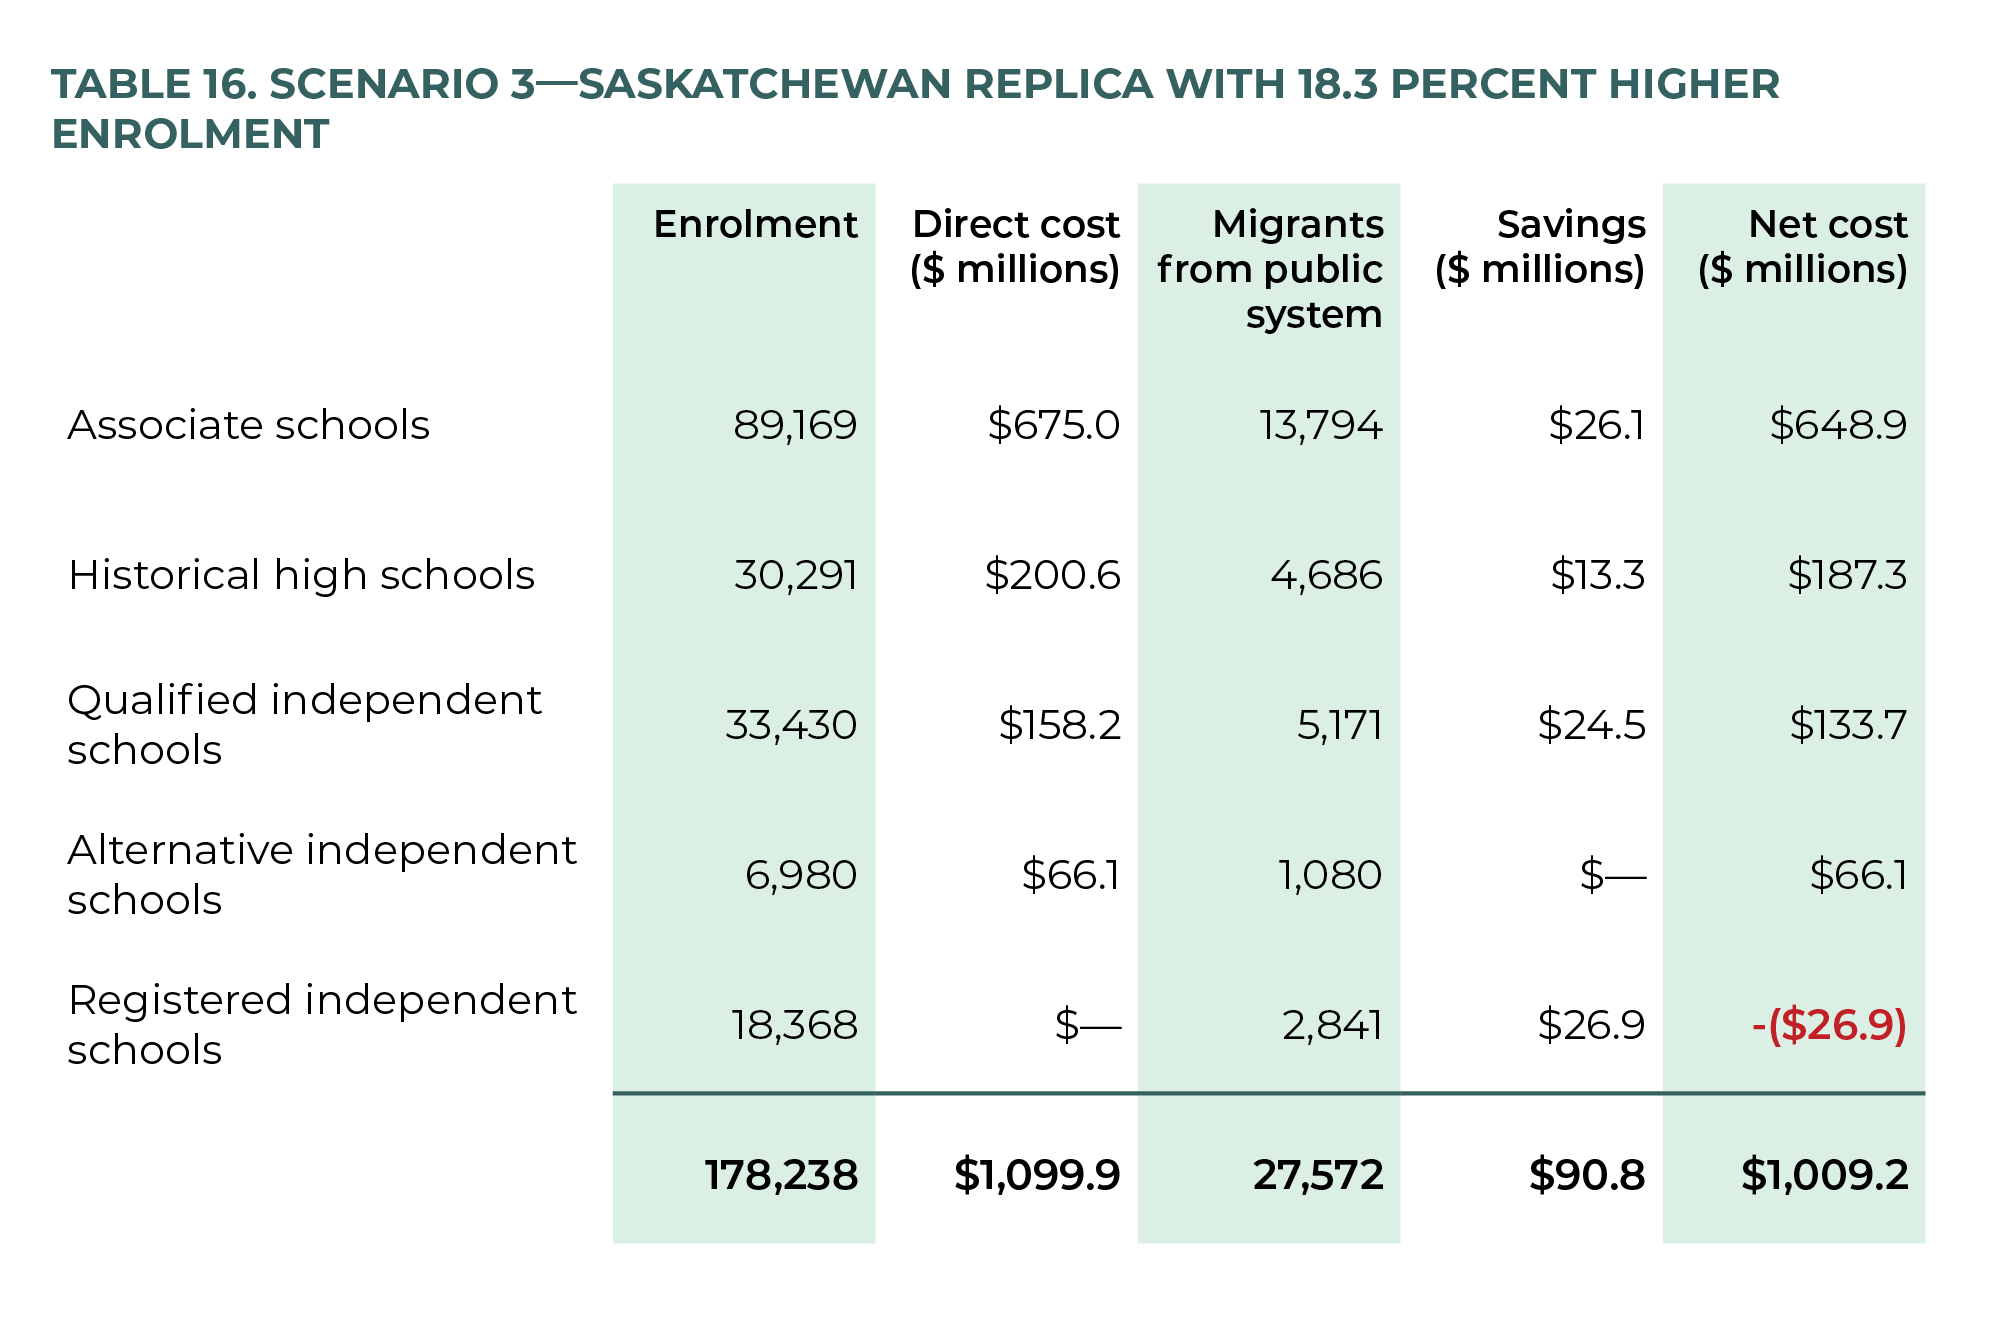
Model 4: Saskatchewan Realistic
Realistically, it is hard to imagine Ontario introducing five funding categories that are so particular to Saskatchewan. It is considerably more likely—and reasonable—to introduce just the Qualified (funded) and Registered (non-funded) categories. This fourth model applies the three scenarios, using the same share of funded to non-funded enrolment as presently exists in Saskatchewan, but with all funded independent schools only receiving 50 percent operating grants, as shown in table 17.
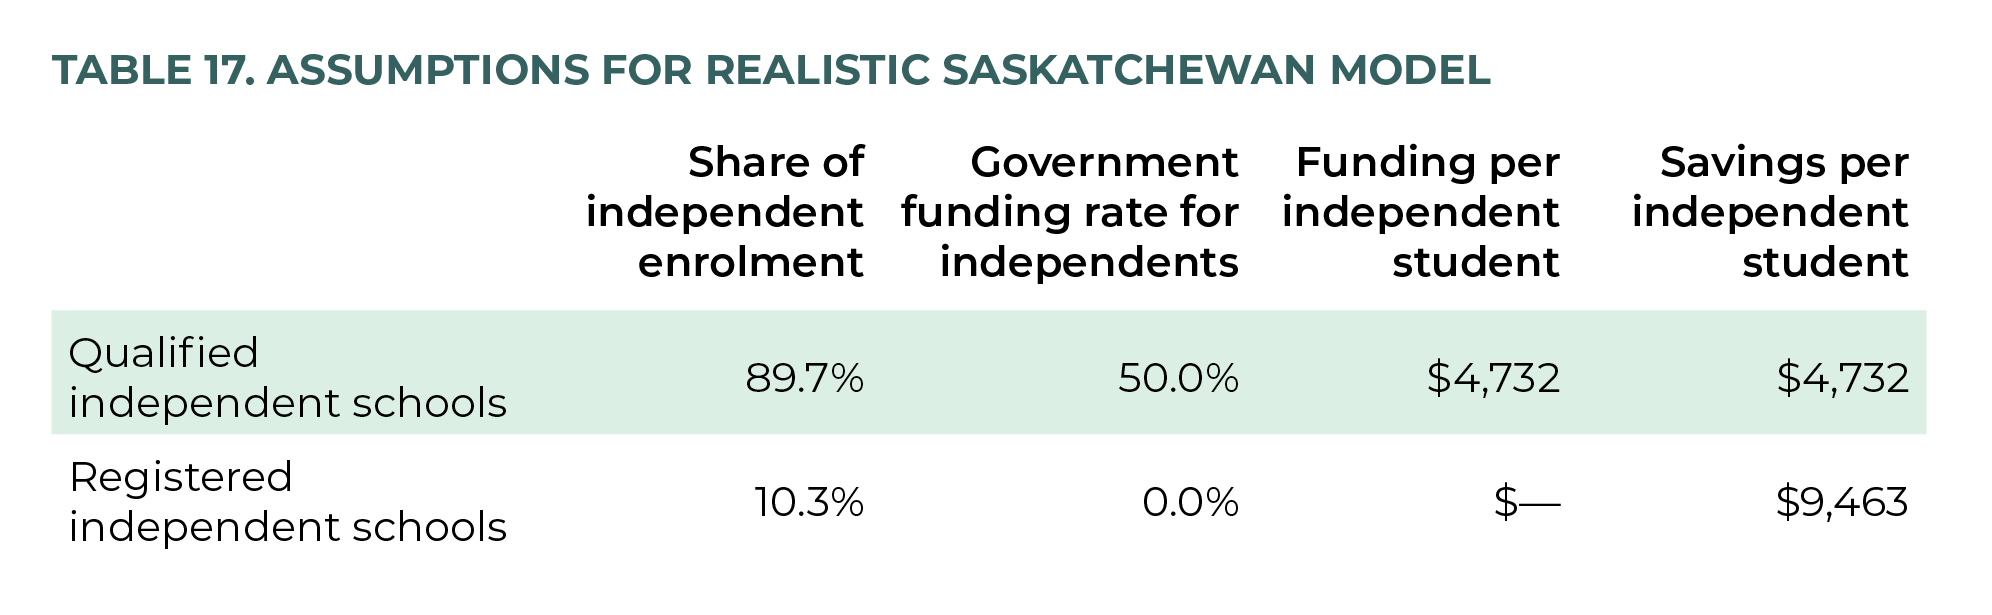
Table 18 presents scenario 1. With all funded students in the Qualified category the direct cost ($639.4 million) is about one-third or $290.4 million less than if Ontario applies all Saskatchewan’s funding categories—not to mention further savings accrued through reduced administrative (bureaucratic) complexity, in terms of both initial implementation and ongoing oversight.
Such savings are intuitively expected, but what may be counterintuitive is that net costs actually decrease as independent enrolment increases in scenarios 2 and 3, due to increased savings from higher student migration. Under this funding scheme, 162,418 independentschool students cost a net $628 million, while the larger 178,238 enrolment costs a net $612.5 million, as shown in tables 19 and 20, respectively.
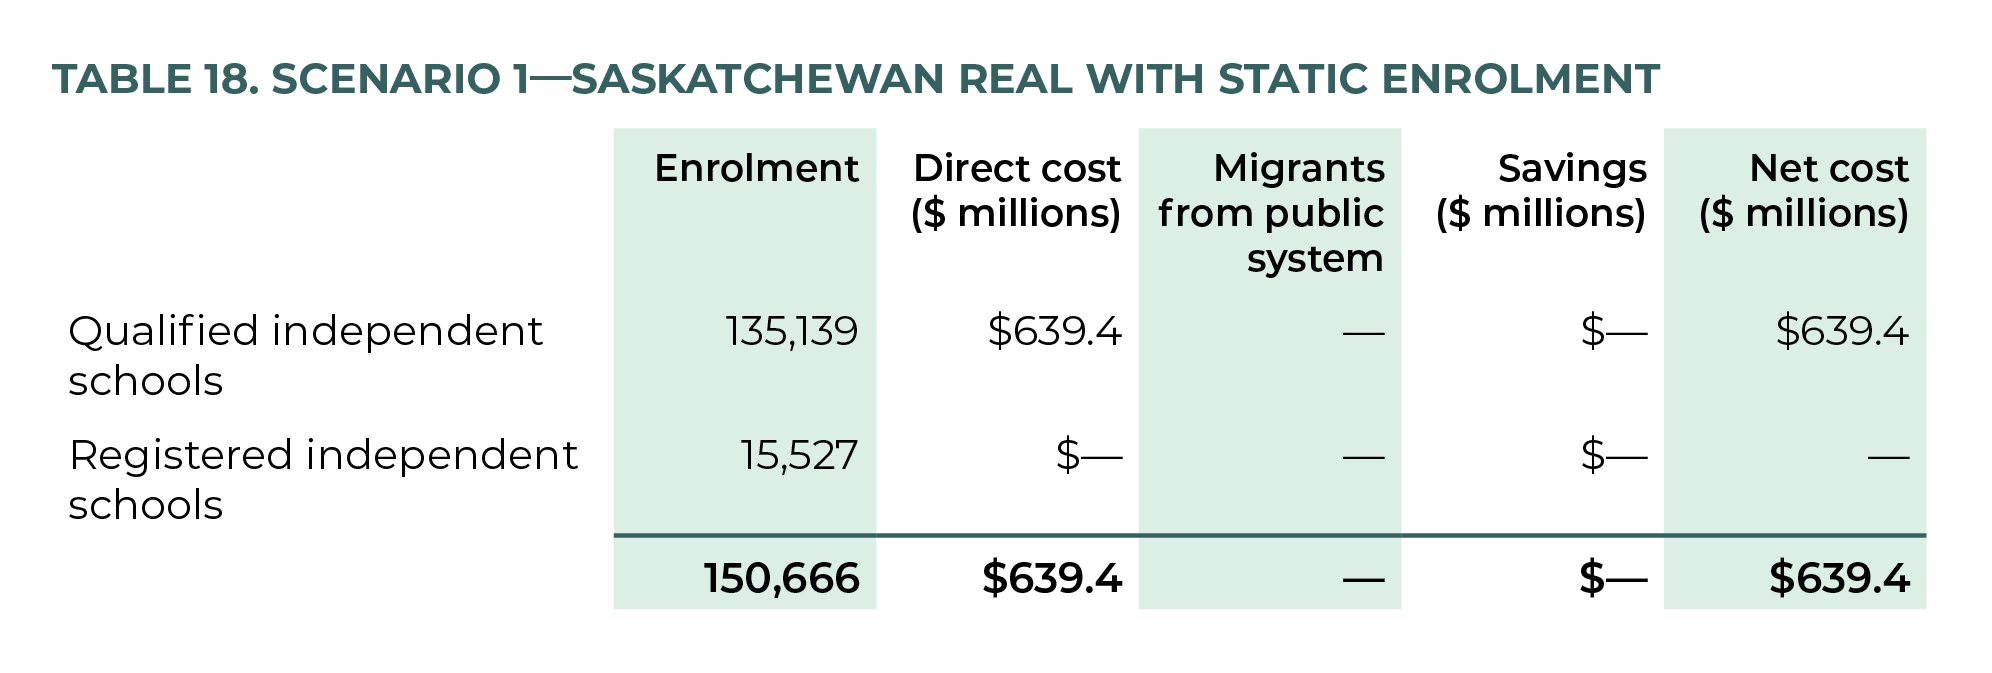
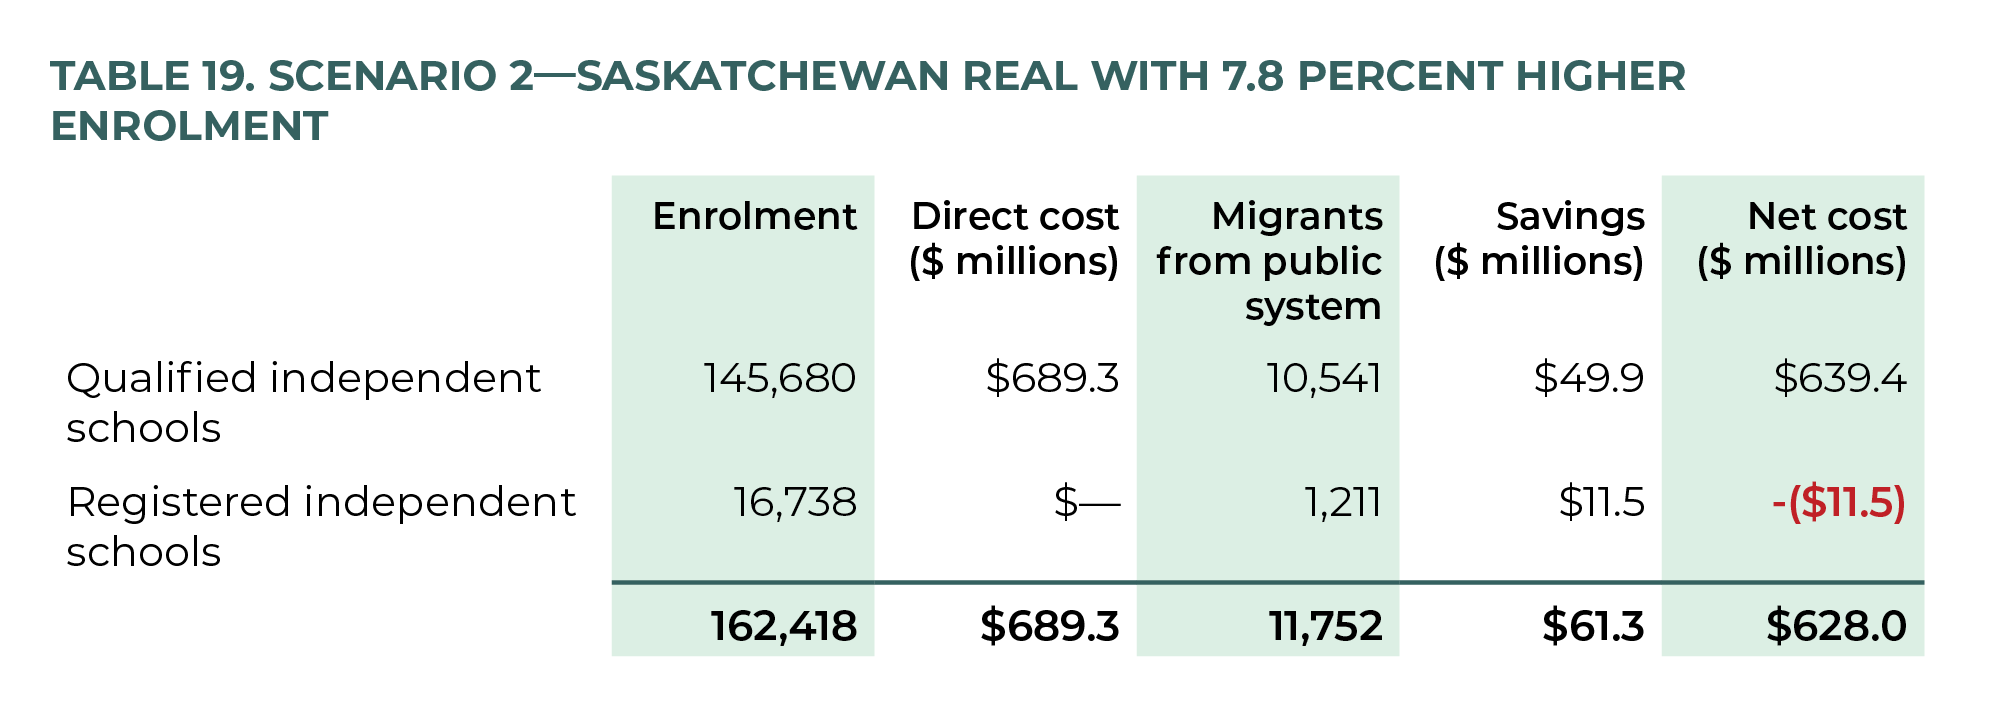
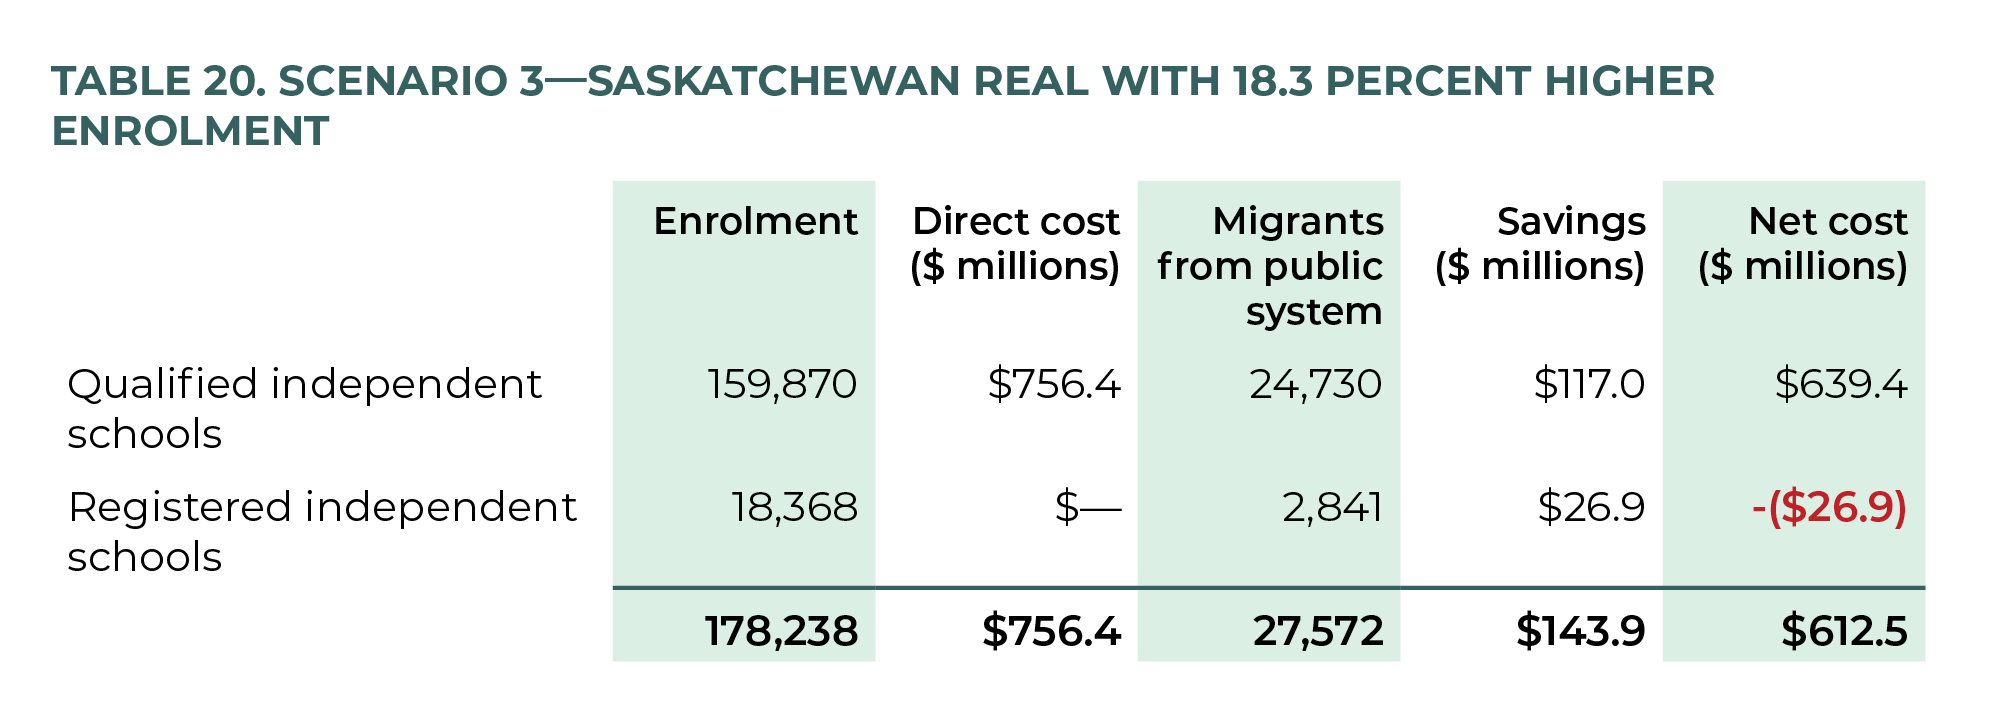
British Columbia: Model 5
Although, broadly speaking, Alberta may have the most pluralistic education system in Canada, 125 125 BC does not have religious schools in its public system. Only independent schools can be religious schools. when it specifically comes to independent schools, British Columbia (BC) boasts what might be considered the most robust independent-school sector in the country. Certainly this is the case in terms of share of students enrolled.
Understanding BC's Independent School System
British Columbia’s stand-alone Independent Schools Act recognizes four categories of independent schools—namely, Group 1, Group 2, Group 3, and Group 4 schools. The province’s Group 1 and 2 independent schools are eligible for government grants based on adherence to specified criteria, while Group 3 and 4 schools receive no funding.
To be eligible for government grants, Group 1 schools must employ BC-certified teachers, have educational programs consistent with relevant ministerial orders, provide a program that meets the criteria set out in the BC curriculum, meet administrative requirements, maintain adequate educational facilities suitable for instruction, and comply with municipal and regional-district building codes. Also, their per-student operating costs must be equal to or less than the local school district’s per-student grant amount. Group 2 schools must meet all the same criteria as Group 1 schools, but their per-student costs (tuition costs or per-student expenditures) exceed those of the local public-school boards. Both Group 1 and Group 2 schools must be operated by a non-profit authority. 126 126 British Columbia, Independent School Act, Pub. L. No. [RSBC 1996] chap. 216, https://www.bclaws.gov.bc.ca/civix/document/id/complete/statreg/96216_01.
In addition to the two partially funded categories, the two non-funded categories allow for a broad spectrum of independent schools in BC. To qualify as a Group 3 school, at least half the school’s students must be “eligible students” (school-age BC residents whose parents are either Canadian citizens or permanent residents). As in other provinces, the Group 3 category allows school societies to maximize independence and minimize oversight. They are not required to employ BClicenced teachers or deliver programs consistent with ministry standards. For school societies that prefer not to receive any public funding, the Group 3 category provides such an option. However, they are not allowed to issue the Dogwood Diploma (BC’s official certificate of graduation) nor claim to be “certified by the Province of British Columbia.” Both Group 3 and Group 4 schools are allowed to operate as for-profit companies or non-profits. 127 127 Federation of Independent School Associations (FISA) of BC, “Summary of Conditions for Classification of Independent Schools: DL and non-DL,” June 2009, https://fisabc.ca/wp-content/uploads/pdf/4-requirements-forschools.pdf. Schools in the Group 4 category must meet most of the same educational program requirements as Group 1 schools, 128 128 BC, Independent School Act and must be bonded. 129 129 BC Ministry of Education, “Fees and Bonding Statement: School Year 2020/2021,” Government of British Columbia, https://www2.gov.bc.ca/gov/content/education-training/k-12/administration/legislation-policy/independent-schools/group-4-independent-school-bonding-policy Group 4 schools are also unique in that they primarily enrol students from outside BC—mostly international students. Their high school graduates are eligible to receive the Dogwood Diploma if the school’s teachers are BC certified. 130 130 BC, Independent School Act.
The funding for Group 1 and 2 schools is administered through a system of tiered grants under which they receive 50 percent and 35 percent, respectively, of the operating grant provided to the local school district per fulltime equivalent (FTE) student. 131 131 Government of BC, “Funding Rates for Independent Schools 2020/21: Final,” Resource Management Division, December 2020, https://www2.gov.bc.ca/assets/gov/education/administration/kindergarten-to-grade-12/independent-schools/funding-rates-for-is-20-21-final.pdf. The perFTE-student funding rates are calculated based on public-school operating grants and the enrolment in the school district where the independent school is located, in accordance with Independent School Regulation, section 3(4). 132 132 BC Ministry of Education, “Grants to Independent Schools,” May 2020, https://www2.gov.bc.ca/gov/content/education-training/k-12/administration/legislation-policy/independent-schools/grants-to-independent-schools.
Each eligible independent school’s grant is calculated as follows:
Local school district per FTE grant amount × Number of eligible students × Designated percentage
Applying BC's Funding Model to Ontario
Table 21 recapitulates the four categories of independent schools in BC, which table 22 breaks down by number of schools, enrolment, and share. 133 133 BC Ministry of Education, “Independent School Information,” 2021, http://www.bced.gov.bc.ca/apps/imcl/imclWeb/IndSchool.do?school_category=Independent School. Students in BC’s public and independent schools are able to cross-enrol into either sector. As a result, independent-school headcount enrolments may include, as part of their September 30 headcount, students whose school of record is a public school or another independent school. In data submitted to Statistics Canada and other official enrolment records, the Ministry of Education adjusts the headcount to ensure that each student is only reported with the school of record. Hence, the difference between this number and the Statistics Canada total private school enrolment. Unlike Ontario, BC does not have a publicly funded Roman Catholic separate-school system. Thus, in applying BC’s independent-school funding scheme to Ontario, we make a few simple adjustments to our estimations of the already-outlined general model.
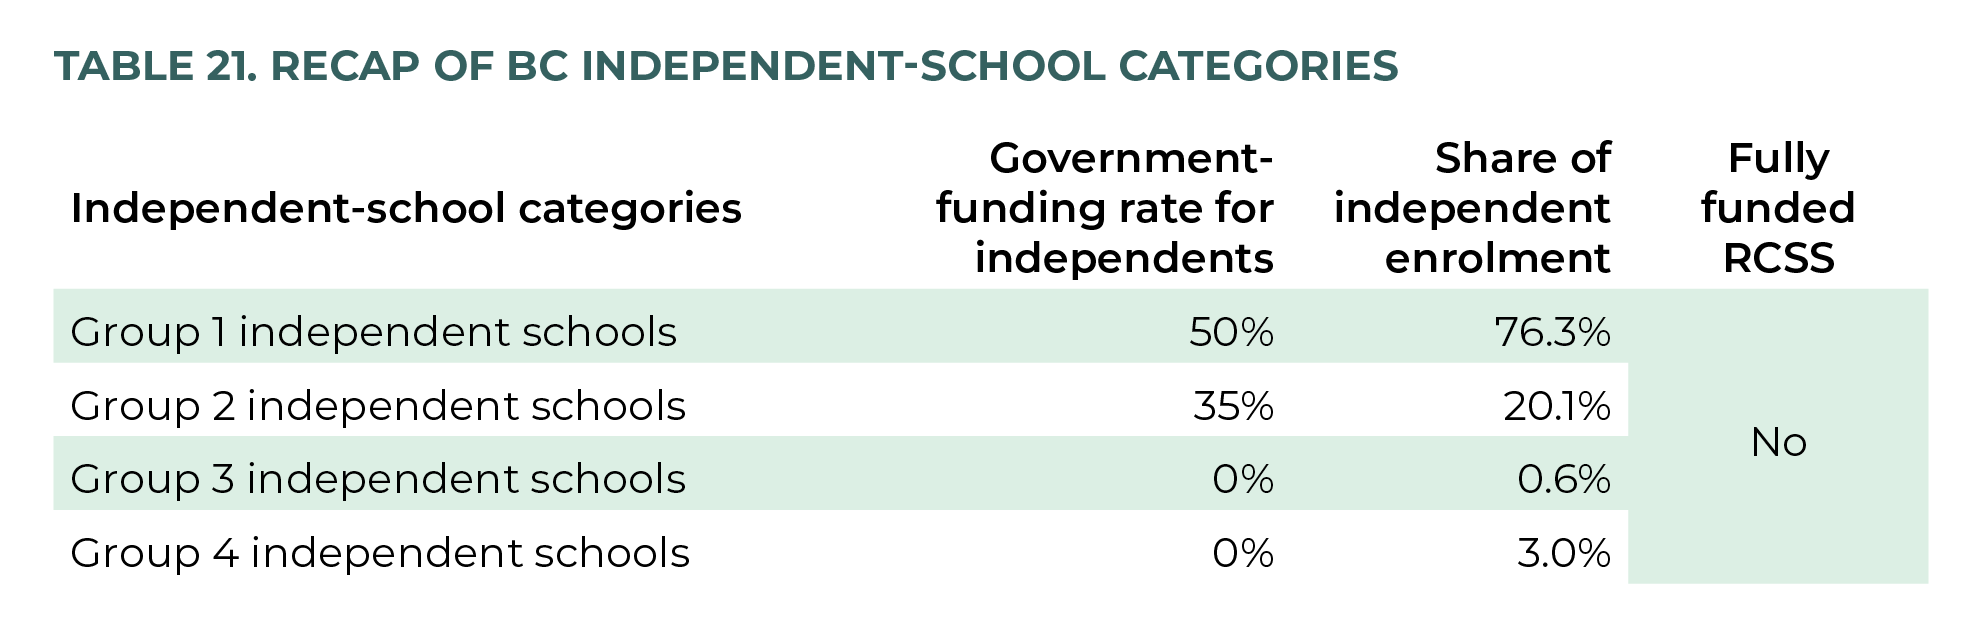
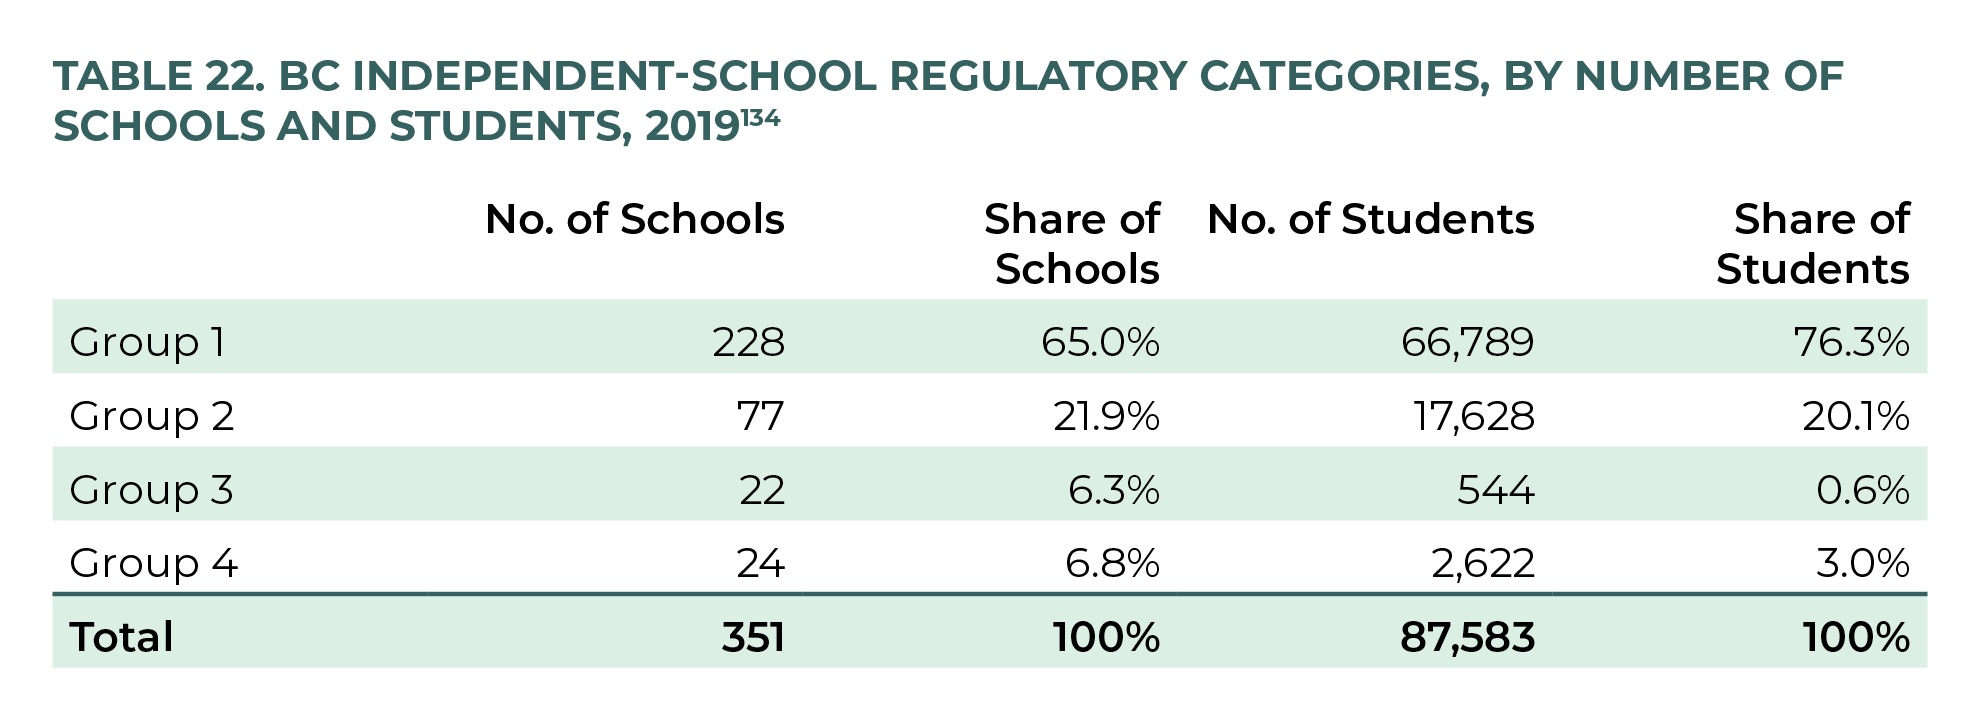
First, as figure 9 shows, we delineate between Roman Catholic and non-Catholic Group 1 schools. There are 74 Group 1 Roman Catholic schools, enrolling 18,946 students, or 21.6 percent of BC’s independent-school population. 135 135 Authors’ calculations based on BC Ministry of Education, “Independent School Information.”
Second, we assume Roman Catholic parents who enrol their children in Roman Catholic schools do so primarily because the school is Roman Catholic. 136 136 We acknowledge the governance of Roman Catholic schools is quite different in BC than in Ontario. Each diocese in BC has its own non-profit society that operates its own Roman Catholic independent schools “in an identical manner” to the other BC dioceses. See “History of Catholic Education,” Catholic Independent Schools Vancouver Archdiocese, https://cisva.bc.ca/info/history/. Put simply, if the students currently enrolled in BC’s Roman Catholic independent schools were in Ontario, we assume they would likely be enrolled in Ontario’s Roman Catholic separate schools and be fully funded by taxpayers. 137 137 About 1 percent of Ontario’s independent schools are Roman Catholic. In this analysis we ignore this fact, even though it could be the case that Roman Catholic independent schools would be increasingly established, should partial funding be made available. (This, of course, would realize further taxpayer savings; and thus it is possible our BC Model overestimates the cost of funding Ontario independent schools using a BC-equivalent approach.)
Third, we adjust the total enrolment in independent schools by subtracting Group 1 Roman Catholic schools from the total BC independent-school enrolment, leaving an adjusted total of 68,637 students, 78.3 percent of total BC independent-school enrolment. Among the “adjusted total,” 47,843 students—or 69.7 percent (of 68,637)—are enrolled in non-Catholic Group 1 schools, 17,628 (25.7%) in Group 2 schools, 554 (0.8%) in Group 3 schools, and 2,622 (3.8%) in Group 4 schools—for a total of 95.4 percent of independent students funded and 4.6 percent non-funded. We use this adjusted total enrolment to set our assumptions for the hypothesized relative share of enrolment in Ontario’s independent schools, as table 23 presents. Importantly, since Group 4 schools predominantly enrol international students and exist for out-of-province students, no BC taxpayer savings are realized from changes in their enrolment. (Also, note that all BC tables from hereon are the authors’ calculation based on data from BC Ministry of Education 138 138 BC Ministry of Education, “Independent School Information.” and Statistics Canada. 139 139 Statistics Canada, “Table 37-10-0109-01: Number of Students in Elementary and Secondary Schools.” Statistics Canada, “Table 37-10-0065-01: School Board Expenditures.” )
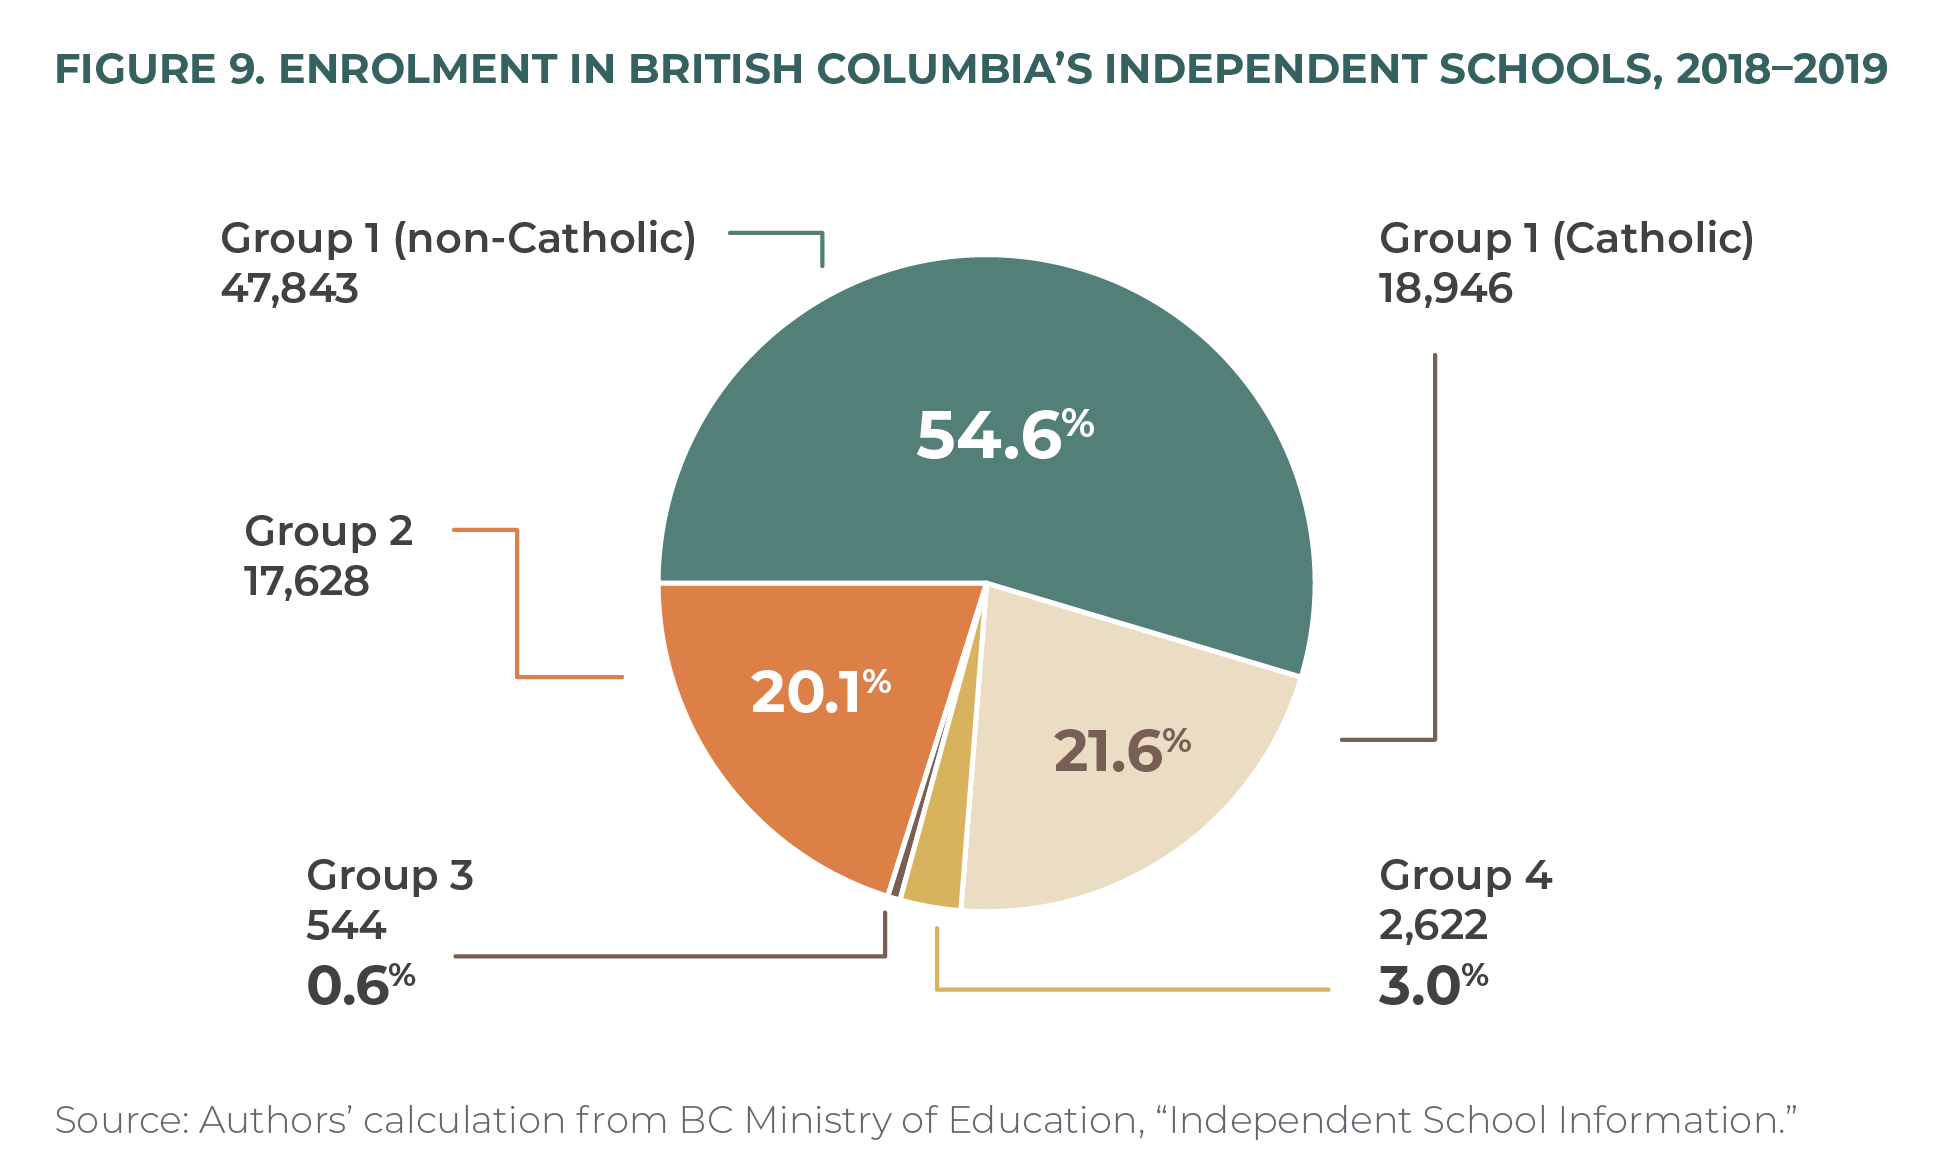
Table 24 presents the scenario 1 cost to directly fund the 95.4 percent of funded students in Ontario’s independent schools ($625.1 million), with 50 percent the per-student public-school operating grant for 69.7 percent of students in the equivalent of Group 1 nonCatholic schools ($496.9 million) and 35 percent funding for the 25.7 percent in the equivalent of Group 2 schools ($128.2 million).
Table 25 shows that scenario 2’s direct cost of $673.8 million less $58.2 million savings ($4,731.50 per student in Group 1 nonCatholic schools, $6,150.95 per Group 2 student, and $9,463 per Group 3 student) from public- to independent-school migration results in a net cost of $615.6 million.
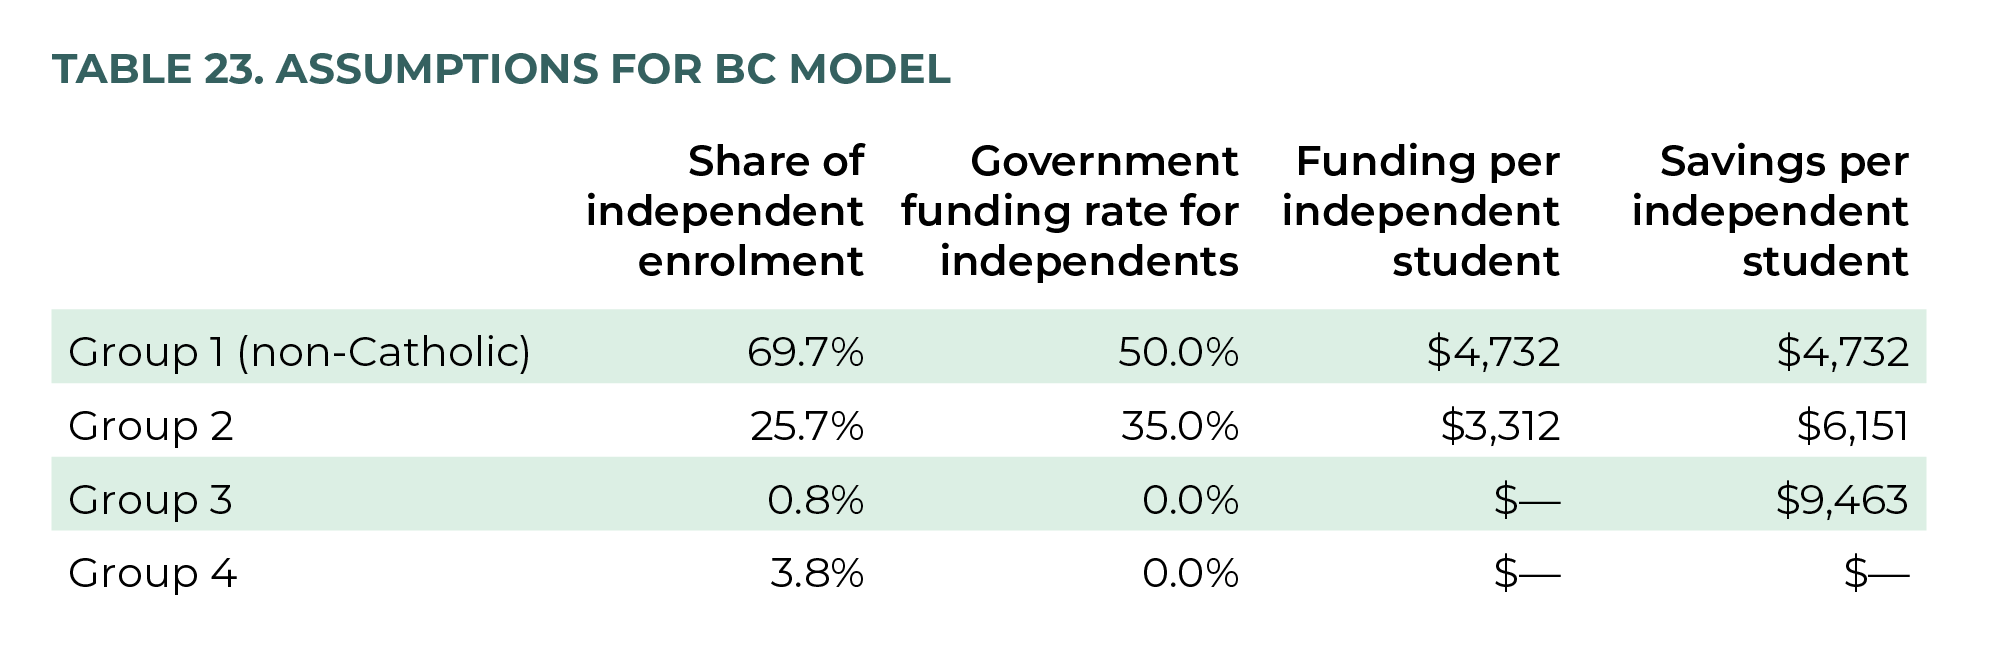
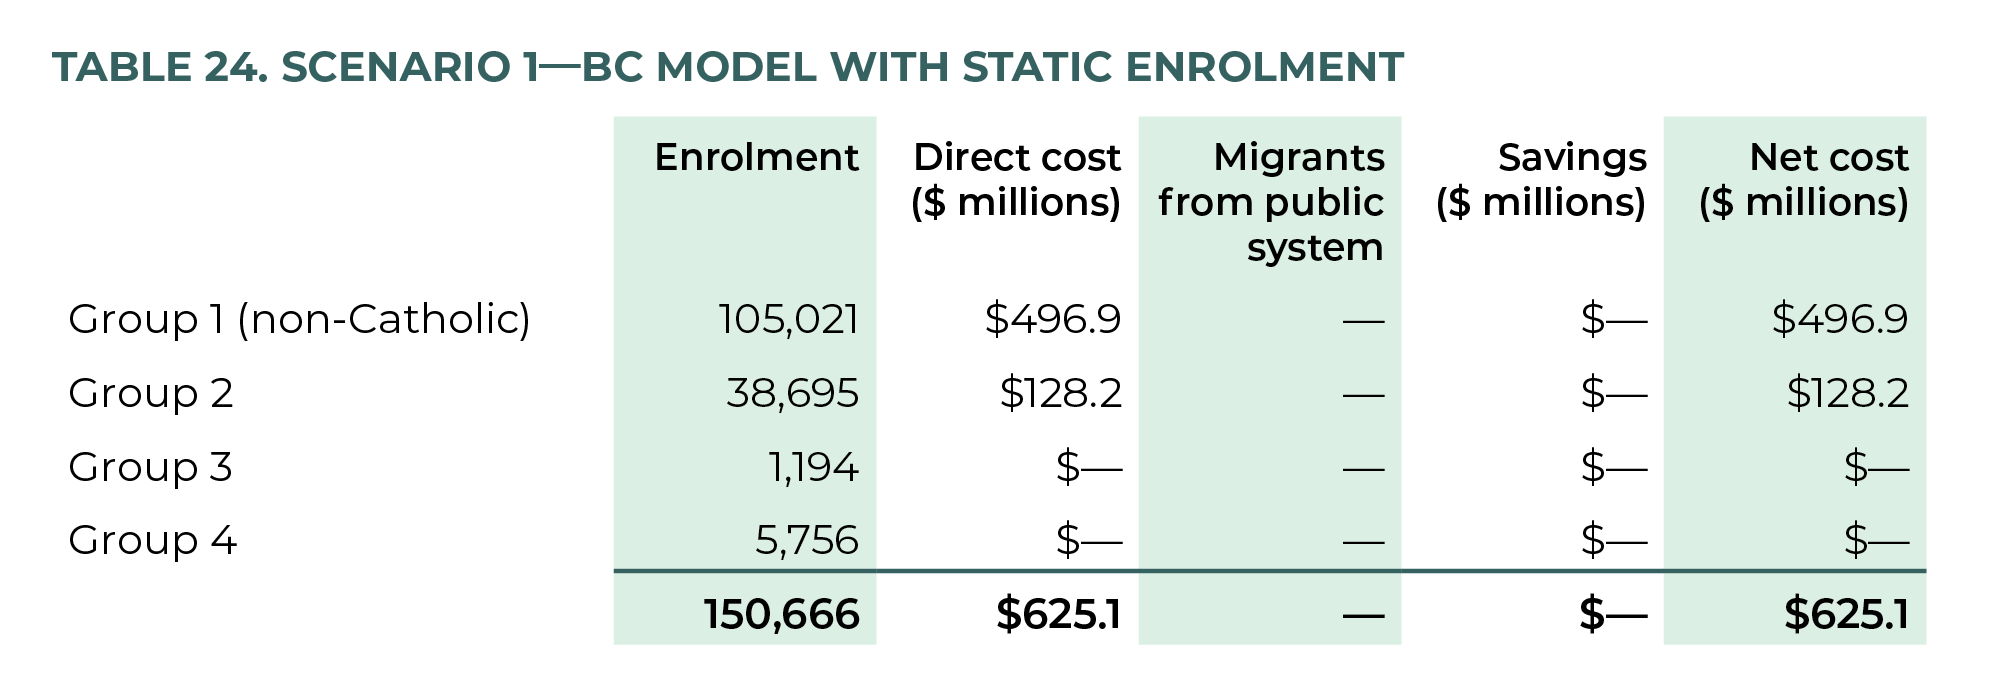
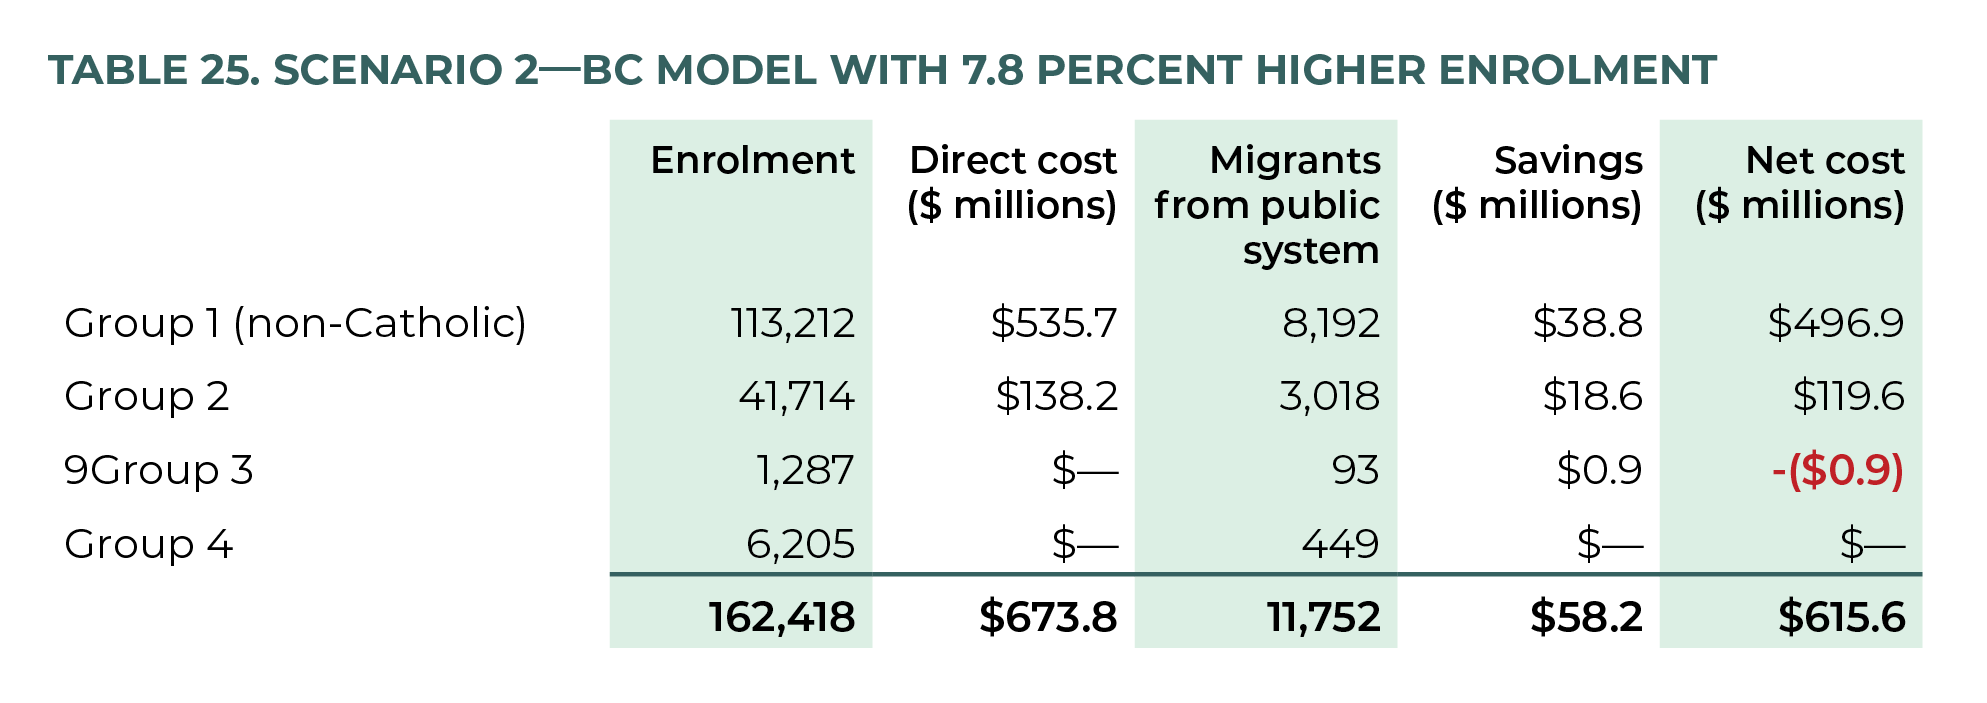
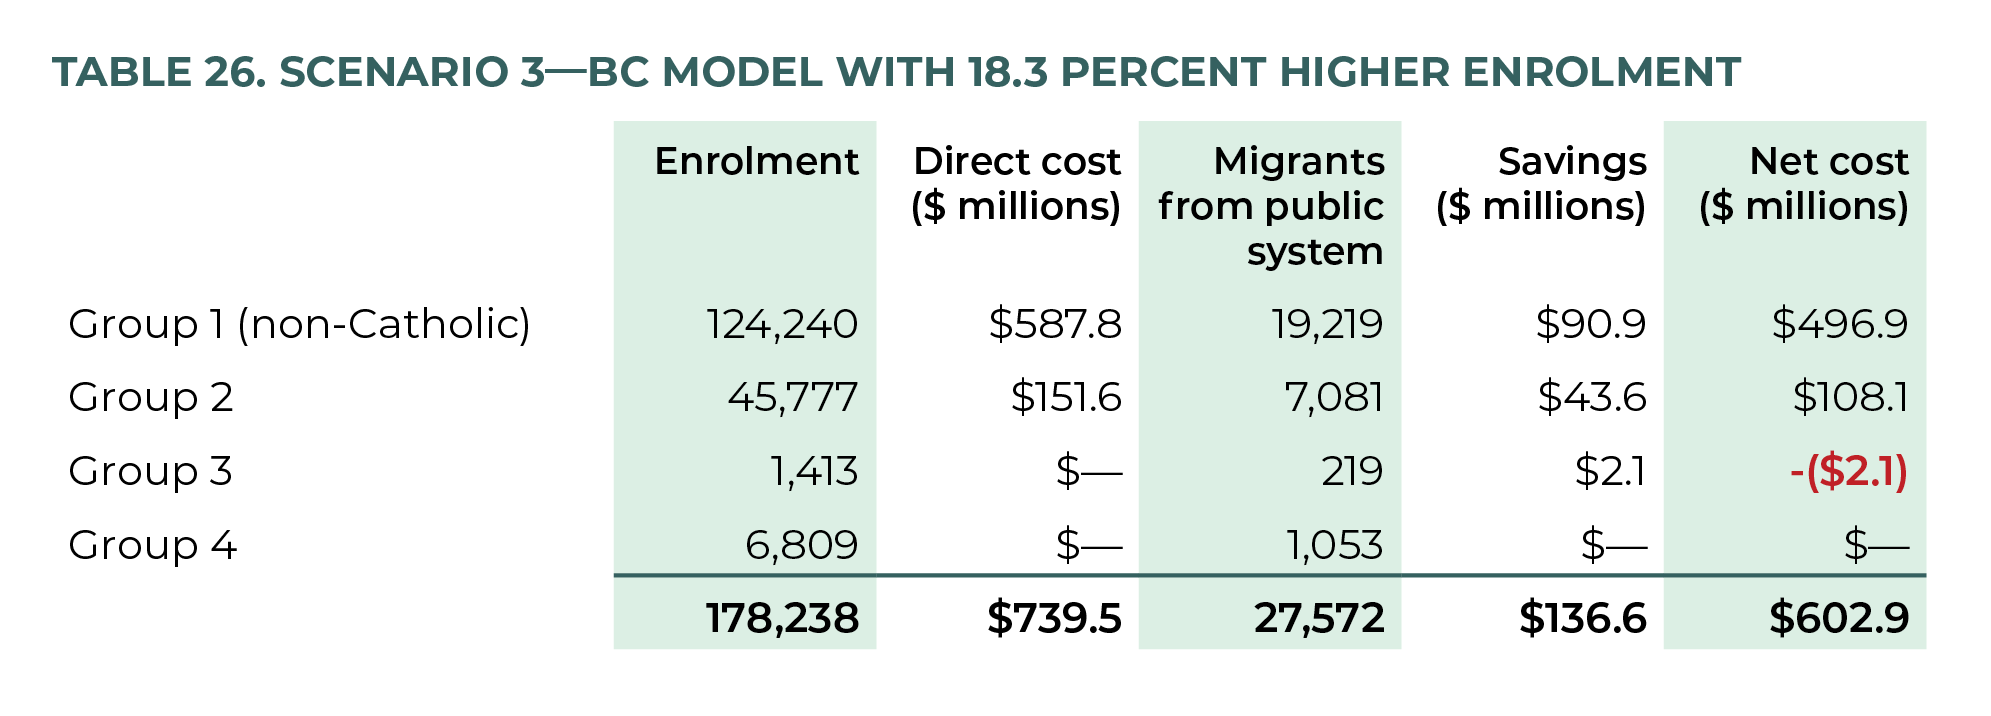
Under scenario 3, direct costs of $739.5 million less $136.6 million in migration savings results in a net cost of $602.9 million, as presented in table 26.
Manitoba: Model 6
At the time of writing, the Manitoba Legislature is currently debating The Education Modernization Act, or Bill 64, which some are calling the “biggest overhaul in more than 60 years” to Manitoba’s education system. 140 140 R.A. Clifton, “Bill 64 Won’t Destroy Public Education,” Winnipeg Free Press, March 31, 2021, https://www.winnipegfreepress.com/opinion/analysis/bill-64-wont-destroy-public-education-574104442.html. The details and outcome are still being debated; thus the following is based on existing (i.e., prereform) legislation and regulations. At present and into the foreseeable future, Manitoba, like BC and Quebec, partially funds independent schools, including Catholic independent schools, but does not have a taxpayer-funded Roman Catholic separate-school system.
Understanding Manitoba's Independent-School System
Manitoba has two categories of independent schools—Funded and Non-funded—governed by the province’s Public Schools Act, section 60(5). 141 141 Province of Manitoba, The Public Schools Act, Pub. L. No. C.C.S.M. c. P250, Manitoba Laws, 2019, https://web2.gov.mb.ca/laws/statutes/ccsm/p250_2e.php#60(5). In the Public Schools Act and other relevant legislation, independent schools are still referred to as private schools. Under the Act, Funded independent schools are required to implement a provincially mandated core curriculum and to teach a sufficient number of approved courses to ensure an equivalent standard of education as that offered in public schools. They are also expected to employ Manitoba-certified teachers. In addition to complying with such other requirements as may be prescribed by relevant regulation from time to time, in terms of their administration, they are required to have a legally incorporated board of directors and an elected advisory board that (1) includes at least three persons who are parents or guardians of children enrolled in the independent school, and (2) reports on the school on a regular basis during the school year, and not less often than once in each school term, to parents or guardians of students. Non-funded independent schools, on the other hand, are not required to meet these conditions. In reference to non-funded schools, the Public Schools Act merely requires that a field representative certify “the child is currently receiving a standard of education at home or elsewhere equivalent to that provided in a public school.” 142 142 Manitoba, Public Schools Act.
The funding for independent schools is specified in the Private School Grants Regulation. Funded independent schools receive direct funding for instruction and services (the Instruction and Services Grant), supports for students with special needs, and a curricular materials grant that is set at a specific amount per eligible pupil. Indirect funding is also provided to Funded independent schools through shared service agreements with public-school divisions for clinician services, facilities and resources, and transportation. 143 143 Province of Manitoba, “Private School Grants Regulation,” Pub. L. No. M.R. 84/2013, in The Public Schools Act (C.C.S.M. c. P250), 2012, https://web2.gov.mb.ca/laws/regs/current/_pdf-regs.php?reg=61/2012. As of the 2020–2021 school year, the amount of Instruction and Services Grant that each Funded independent school receives is based on the number of eligible pupils enrolled at the school. The grant amount per student is set at 50 percent of the public-school net operating expenditures from two years previous to the current funding year, up to $5,988. 144 144 Manitoba Education, “Funding of Independent Schools and Reporting Requirements: 2020/2021 School Year,” September 2020, https://www.edu.gov.mb.ca/k12/finance/forms/independent/docs/enrol_reporting_2020.pdf.
Applying Manitoba's Funding Model to Ontario
Table 27 recapitulates Manitoba’s independentschool categories and funded rate, and figure 10 shows enrolment distribution. As of 2018–2019, there are 16,344 students enrolled in Manitoba’s 111 independent schools. Among them, 14,474 students (88.6%) are enrolled in sixty-two Funded independent schools. Among the funded, 6,097 students (37.3 percent of total independent school enrolment) are enrolled in nineteen Roman Catholic Funded independent schools, while 8,377 students (51.3 percent of total independent school enrolment) attend non-Catholic Funded independent schools. 145 145 Manitoba Education, “School Enrolment Reports,” September 2020, https://www.edu.gov.mb.ca/k12/finance/sch_enrol/index.html.
As with BC and Quebec, we adjust the total independent-school enrolment by subtracting Roman Catholic Funded independent schools. We then use the “adjusted total enrolment”—the 10,247 students enrolled in Manitoba’s non-Catholic independent schools in 2018–2019—to determine the relative enrolment in Ontario’s independent schools under Manitoba’s funding model, as table 28 presents. Note that all Manitoba tables hereon are the authors’ calculations based on Manitoba Education 146 146 Manitoba Education, “School Enrolment Reports.” and Statistics Canada 147 147 Statistics Canada, “Table 37-10-0109-01: Number of Students in Elementary and Secondary Schools.” Statistics Canada, “Table 37-10-0065-01: School Board Expenditures.” data.
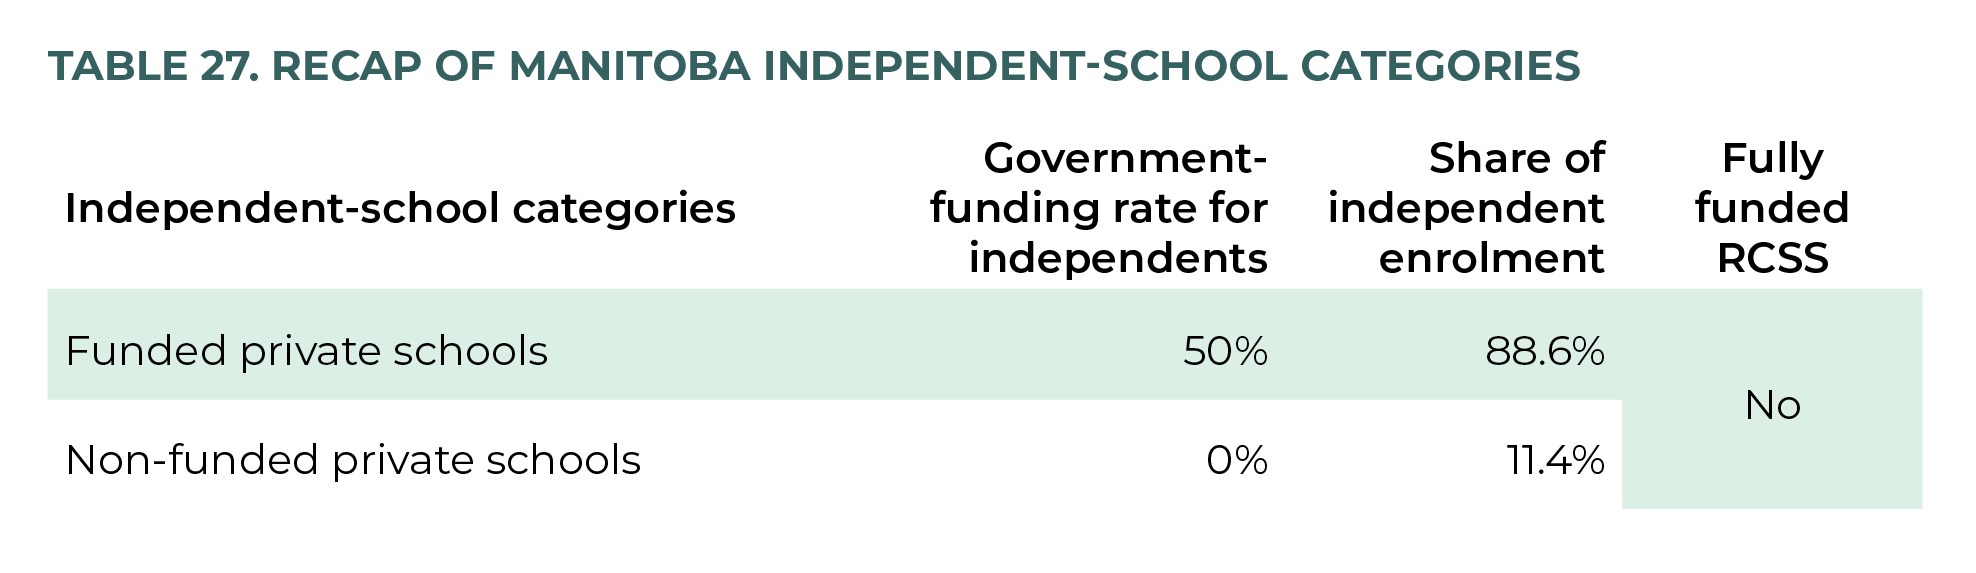
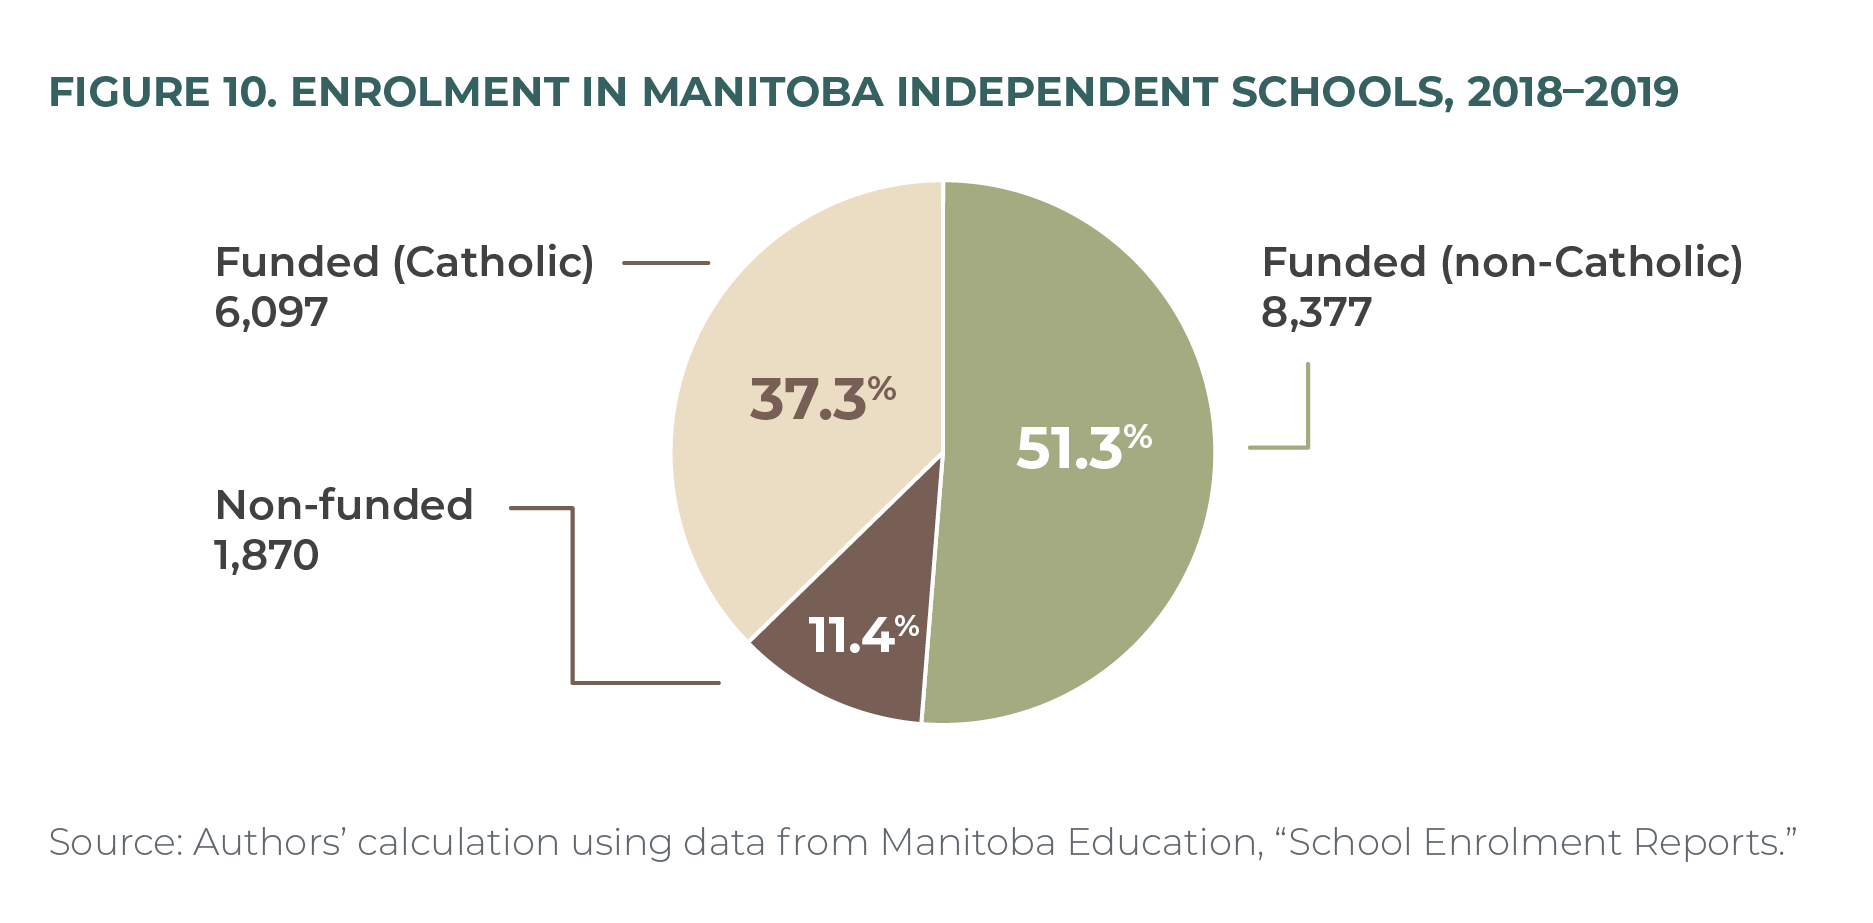
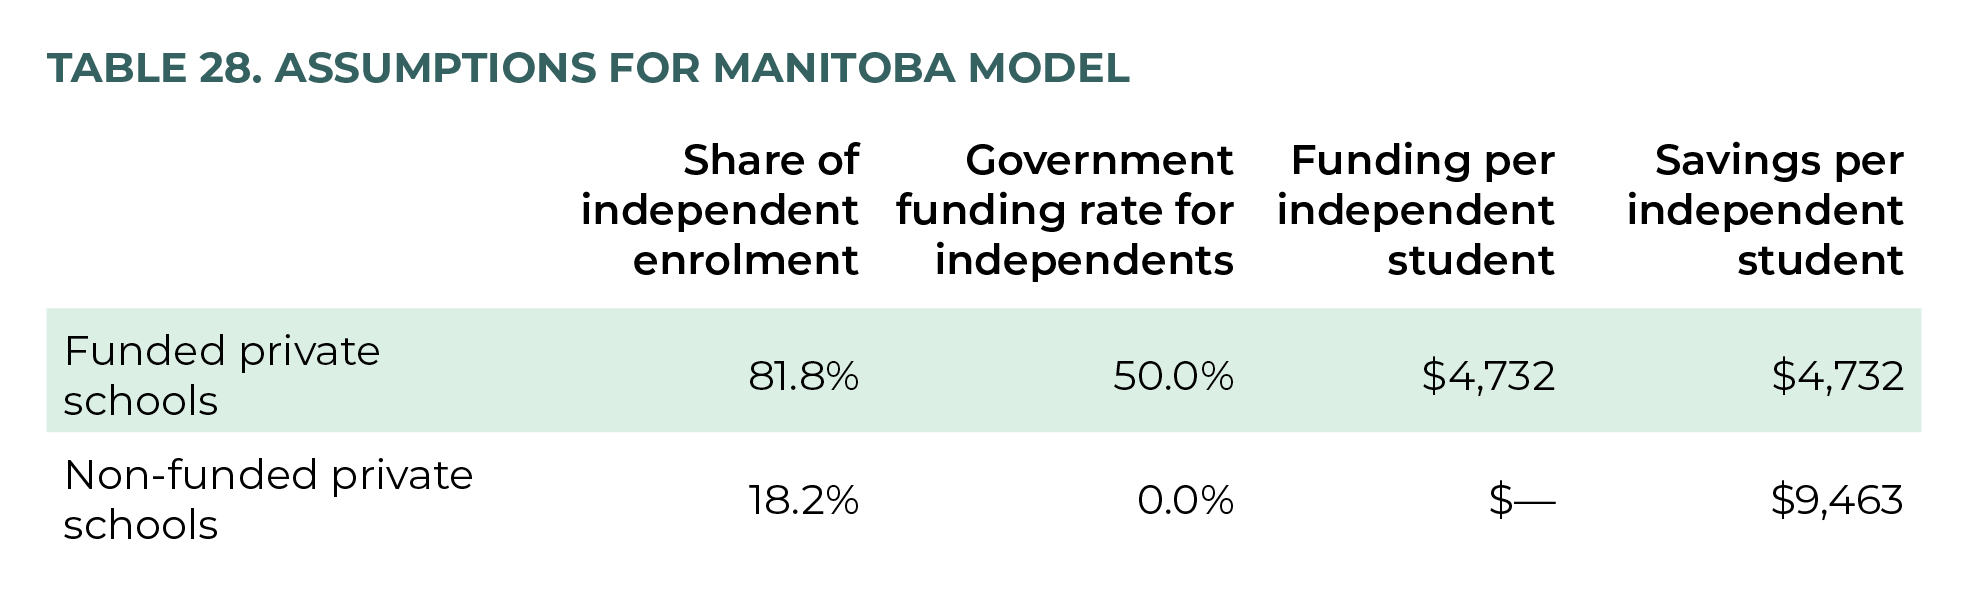
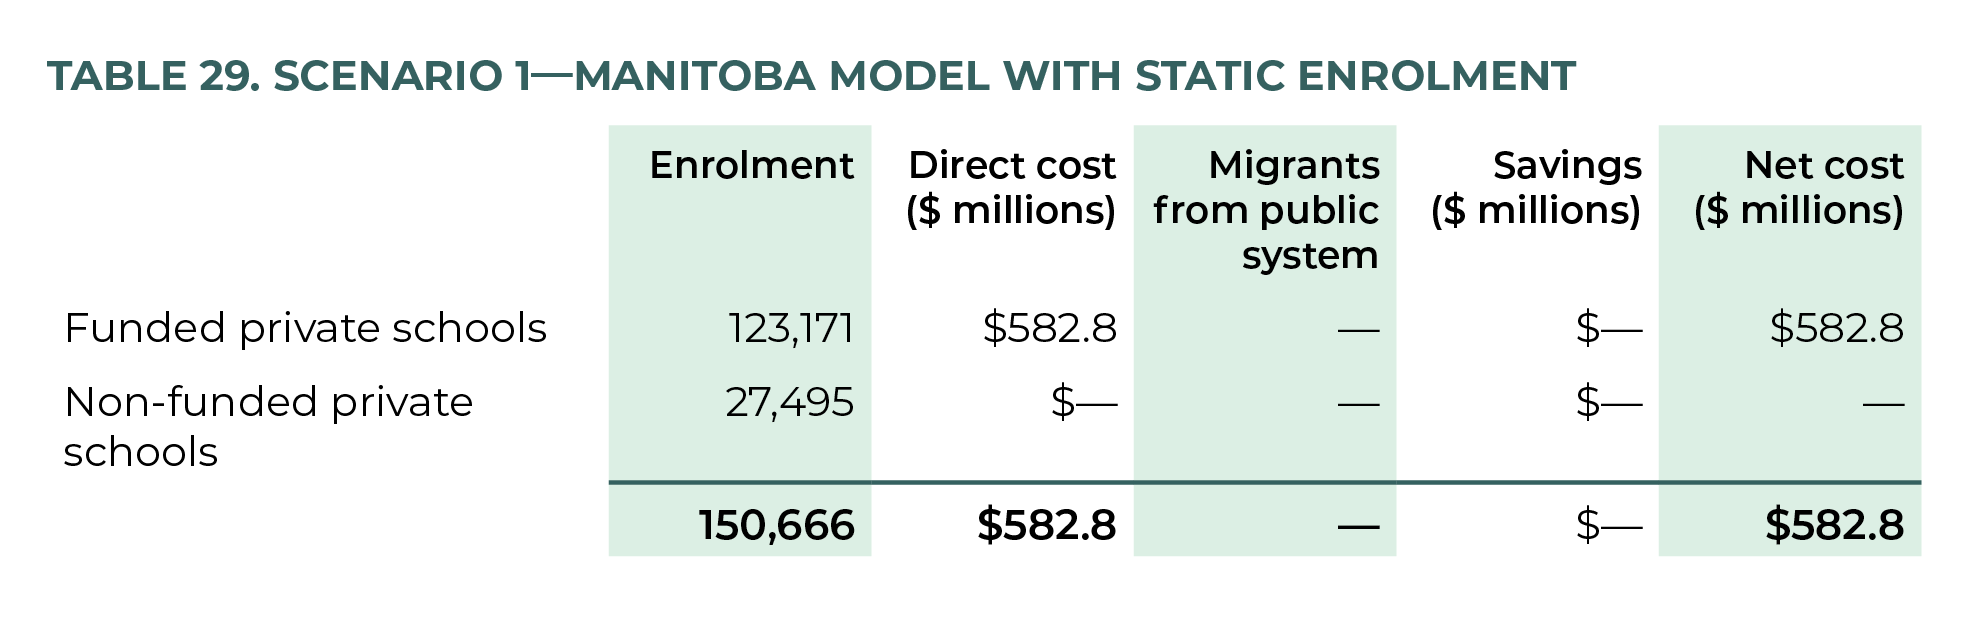
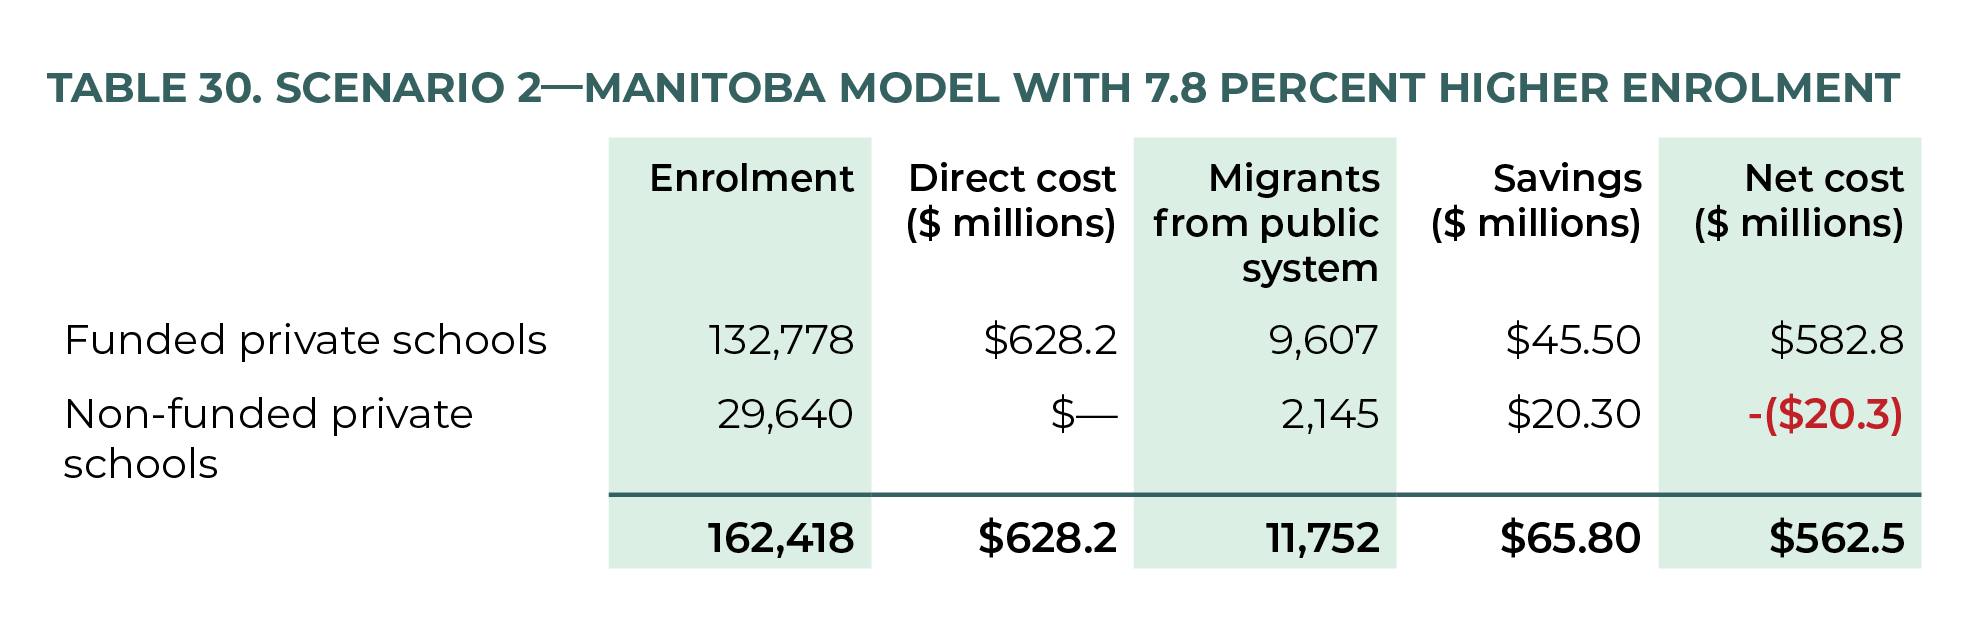
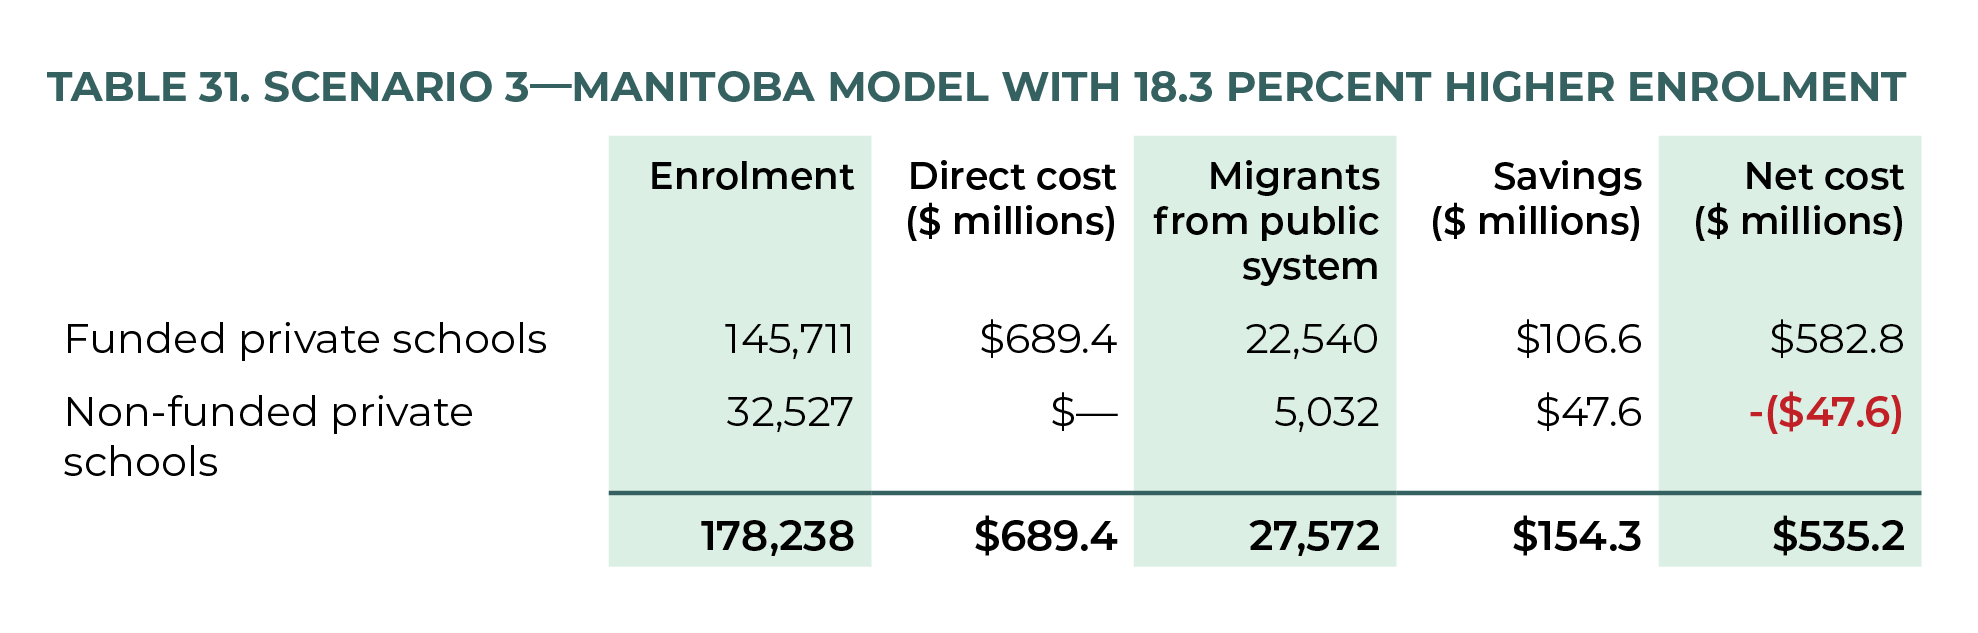
Scenario 1 estimates a cost of $582.8 million to fund Ontario’s non-Catholic independent schools at 50 percent of the $9,463 per-student operating expenditure of public schools (table 29).
Scenario 2 estimates $628.2 million for direct funding less $65.8 million in migration savings for a net cost of $562.5 million (table 30).
Before accounting for student migration, the direct cost of scenario 3 is $689.4 million. After accounting for savings of about $154.3 million from public- to independent-school student transfers, the estimated net cost is $535.2 million to fund Ontario independent schools using the Manitoba model (table 31).
Quebec: Model 7
As the only predominantly French-speaking province, Quebec and its culture are distinct in many ways. This distinction extends to education and is evident in the uniqueness of the province’s elementary and secondary school system.
Much could be written about Quebec’s approach. To start, the secondary school level has five grades (called Secondary I–V or simply grades 7–11) and does not have a grade 12, unlike other Canadian provinces. Furthermore, post-secondary education in the province includes two levels: Collegiate education (two years) and University education (three or four years, depending on the program of study). Quebec’s two-year Collegiate system—undertaken at Collège d’enseignement général et professionnels (CEGEPs) (or, General and Vocational Colleges, in English)—is unique to the province. CEGEPs are a bridge between compulsory schooling and university. More so, other Canadian provinces do not consider Quebec’s secondary diploma (i.e., completion of grade 11) to be sufficient qualification for university admission. 148 148 K.L. Robson, “The Structure of Education in Canada,” in Sociology of Education in Canada (Toronto: Pearson Canada, 2013).
The province historically funded religious separate schools but no longer does. Quebec abolished its publicly funded separate Catholic and Protestant school boards in 1997, in favour of simply French and English school boards—moving from religious to linguistic variation.
149
149
D. Allison and D. Van Pelt, “Canada,” in Glenn and de Groof, Balancing Freedom, Autonomy and Accountability
in Education, 3:79–142.
Understanding Quebec's Independent-School System
It has been argued elsewhere that Quebec’s independent schools are functionally more akin to charter schools than “private” schools, given how generously they are funded and how heavily they are regulated 150 150 S.J. Caldas and S. Bernier, “The Effects of Competition from Private Schooling on French Public School Districts in the Province of Québec,” Journal of Educational Research 105, no. 5 (2012): 353–65, 354. —especially in contrast to Ontario, where independent schools are truly independent. In Quebec, all “private educational institution[s]” must hold a permit issued by the Minister of Education, Recreation, and Sports or by the Minister of Higher Education, Research, Science, and Technology, depending on educational services or categories of educational services the school seeks to offer. Among a host of regulations and prerogatives, the minister may set an expiry period for the permit, 151 151 The validity period is typically three years, with a five-year renewal. and after consulting the Commission consultative de l’enseignement privé (hereafter “Commission”), the minister may set an independent school’s maximum enrolment capacity upon permit issuance. 152 152 Statuts du Québec, “Chapitre II: Permis,” in Chapitre E-9.1: Loi Sur l’Enseignement Privé, http://legisquebec.gouv.qc.ca/fr/pdf/cs/E-9.1.pdf. In addition to holding a permit, to receive public funding, independent schools must receive approval after applying to the Commission. 153 153 Statuts du Québec, “Chapitre VI: Commission Consultative de l’Enseignement Privé,” in Chapitre E-9.1: Loi Sur l’Enseignement Privé, http://legisquebec.gouv.qc.ca/fr/pdf/cs/E-9.1.pdf. Van Pelt, Hasan, and Allison summarize the Commission process as follows:
The Commission considers all applications for permits and accreditation, modifications, and renewals, advising the Minister as it considers appropriate. Accreditations for subsidies are specific to the education services delivered as specified in the application and approved by the Commission. Because of this,funding for independent schools varies
depending on the services provided,rather than being a percentage of public school funding as in other provinces. Even so . . . the subsidy per pupil is about 60% of that paid to public schools. 154 154 Van Pelt, Hasan, and Allison, “The Funding and Regulation of Independent Schools in Canada,” 8.
In the 2017–2018 financial year, Quebec’s direct funding to independent schools was $589.3 million, covering about 43.4 percent of their expenditures. This amount is allocated to independent schools on a per-student basis for expenses related to teaching activities, activities to support education and training, extracurricular activities, administrative activities, activities relating to movable and immovable property, related activities, and auxiliary enterprises. 155 155 Québec Ministère de l’Éducation et de l’Enseignement supérieur, “Guide Général du Financement,” 26.
There are three main components of the government grants to independent schools; a Basic allowance, an Allowance in lieu of rental value, and Additional allowances. The Basic allowance represents the bulk of the government grant to eligible schools. Perstudent amounts are allocated for general students and for students with special needs, according to the grade level. For students with disabilities or learning difficulty, the perstudent amount is specific to each special-needs school. The Allowance in lieu of the rental value is approximately 60 percent 156 156 A per-student amount specific to each level of education is used to establish this allocation. of the amount paid to public schools for educational services. This Allowance is meant for the purchase of furniture, equipment and tools (to carry out major repairs), and to allow the improvement and transformation of school buildings. The fact that the Allowance in lieu of rental value can be used for the improvement and transformation of school buildings makes Quebec unique among the provinces—elsewhere, public funding for independent schools is mainly restricted to operating expenses and not directed at any capital expenses. Last, Quebec’s independent schools can also receive Additional allowances for special programs or educational services, other than those financed by the grant, as well as school transportation grants. These Additional allowances aim to take into account specific situations and develop certain activities considered a priority by the Ministry. 157 157 Québec Ministère de l’Éducation et de l’Enseignement supérieur, “Guide Général du Financement.”
Applying Quebec's Funding Model to Ontario
Table 32 recapitulates Quebec’s independentschool categories and the approximate perstudent rate of funding, and figure 11 shows enrolment distribution. 158 158 Databank of Official Statistics on Québec, “School Attendance,” 2021, https://bdso.gouv.qc.ca/pls/ken/ken2122_navig_niv_2.page_niv2?p_iden_tran=REPERTW50YC351558536171179PU%7C%7B&p_lang=2&p_id_ss_domn=825; Banque de données des statistiques officielles sur le Québec, “Effectif scolaire de la formation générale des jeunes par école selon diverses variables, années scolaires 2014–2015 à 2020–2021 Québec,” 2021, https://bdso.gouv.qc.ca/pls/ken/ken213_afich_tabl.page_tabl?p_iden_tran=REPER0JXANX47175270687458jiY0,&p_lang=1&p_id_ss_domn=825&p_id_raprt=3512#de_temps_refrn=2019-2020p&tri_de_statut=1&tri_codfc2=5.
As of 2018–2019, Quebec has 304 independent schools, with a total enrollment of 125,316 students. Among these, 252 independent schools (82.9%) receive government subsidies for 115,129 students (91.9% of total independent-school enrolment). About 59 independent schools (19.4%) enrolling 41,251 students (32.9%) are Catholic. And a total of 52 independent schools (17.1%) with 10,187 students (8.1%) are not funded. 159 159 Databank of Official Statistics on Québec, “School Attendance.”
Quebec’s non-Catholic independent schools enrolled 84,065 students in 2018–2019—74,448 (88.6% of non-Catholic independent enrolment) in funded schools and 9,617 in non-funded schools. 160 160 Databank of Official Statistics on Québec, “School Attendance.” As with BC and Manitoba, in order not to overweight Roman Catholic enrolment, we use these adjusted totals as the basis for the relative enrollment in Ontario for our assumptions in table 33. Note that all Quebec tables hereon are the authors’ calculations based on data from the Databank of Official Statistics on Quebec 161 161 Databank of Official Statistics on Québec, “School Attendance.” and Statistics Canada. 162 162 Statistics Canada, “Table 37-10-0109-01: Number of Students in Elementary and Secondary Schools.” Statistics Canada, “Table 37-10-0065-01: School Board Expenditures.”
Scenario 1 will cost $752.5 million to fund Ontario’s independent schools at 60 percent of the public-school per-student amount, with no student migration (table 34).
Scenario 2 will cost $811.2 million to directly fund independent schools. After adjusting for student migration, the net cost is an estimated $758.7 million (table 35).
Scenario 3 will cost around $890.2 million to directly fund students in independent schools. After accounting for student migration, the net cost is an estimated $767 million (table 36).
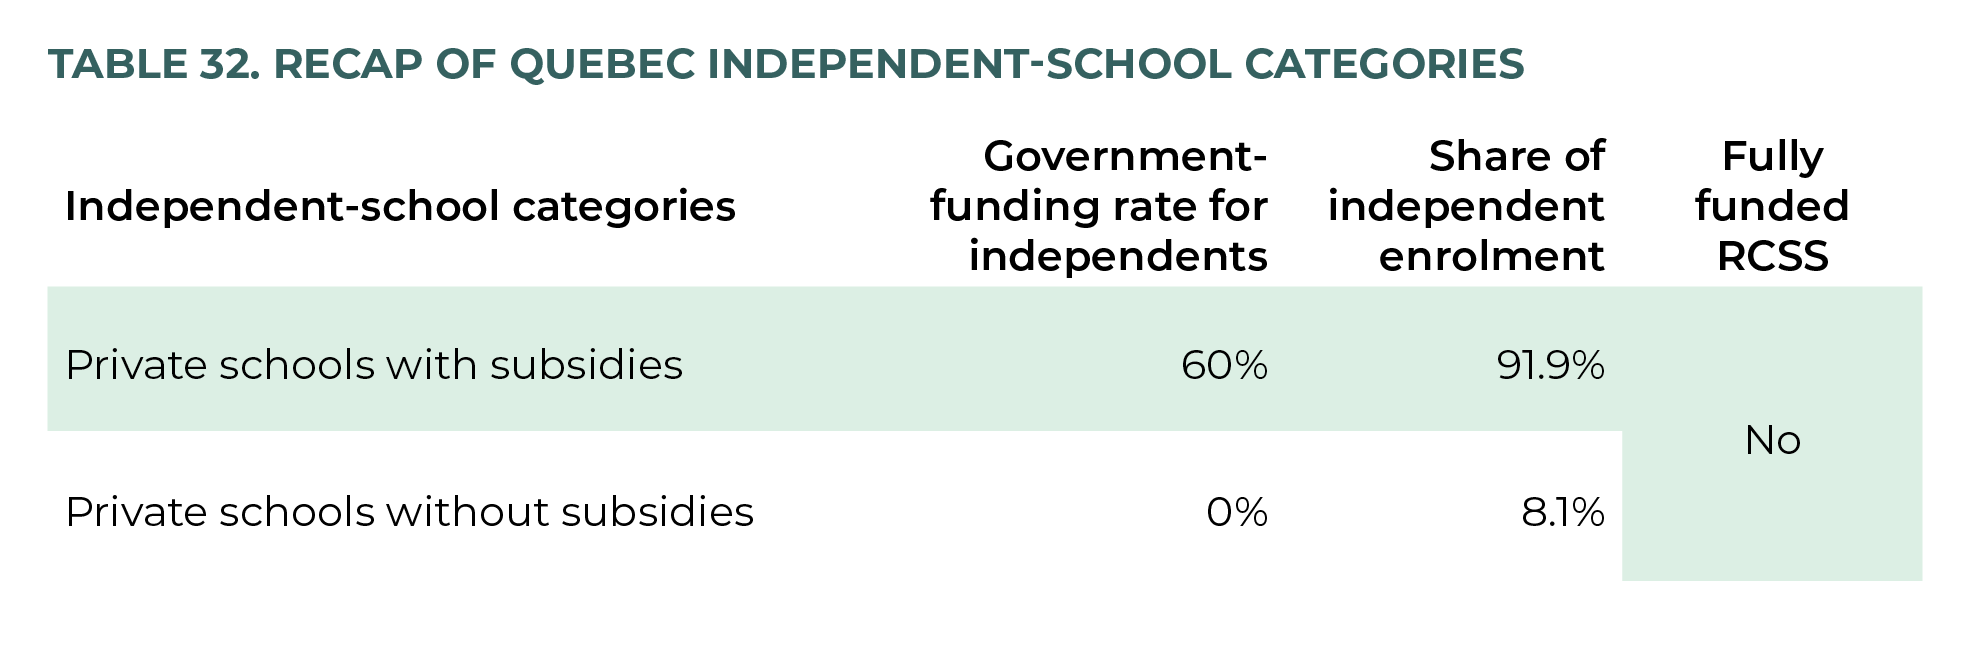
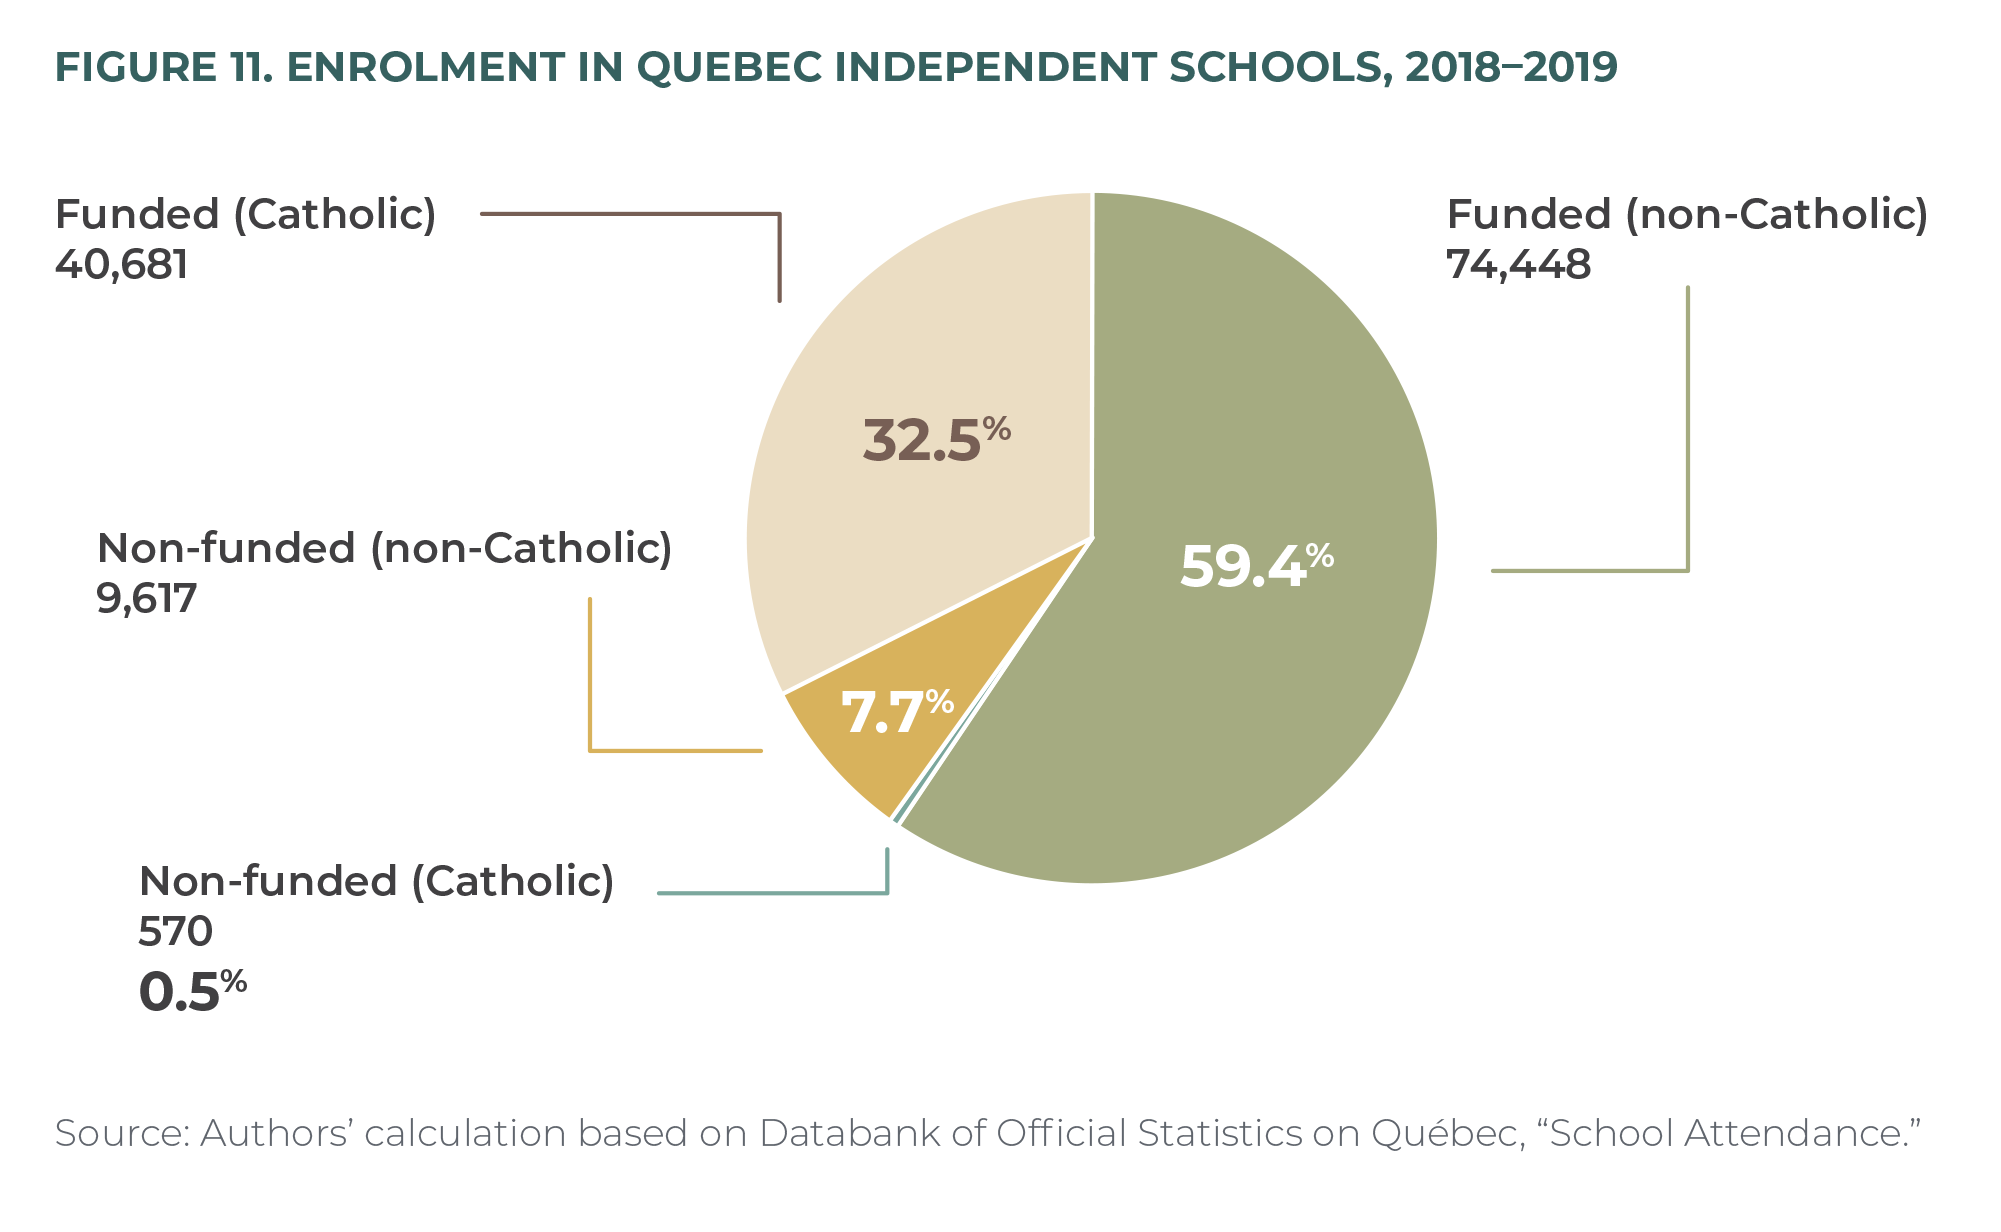
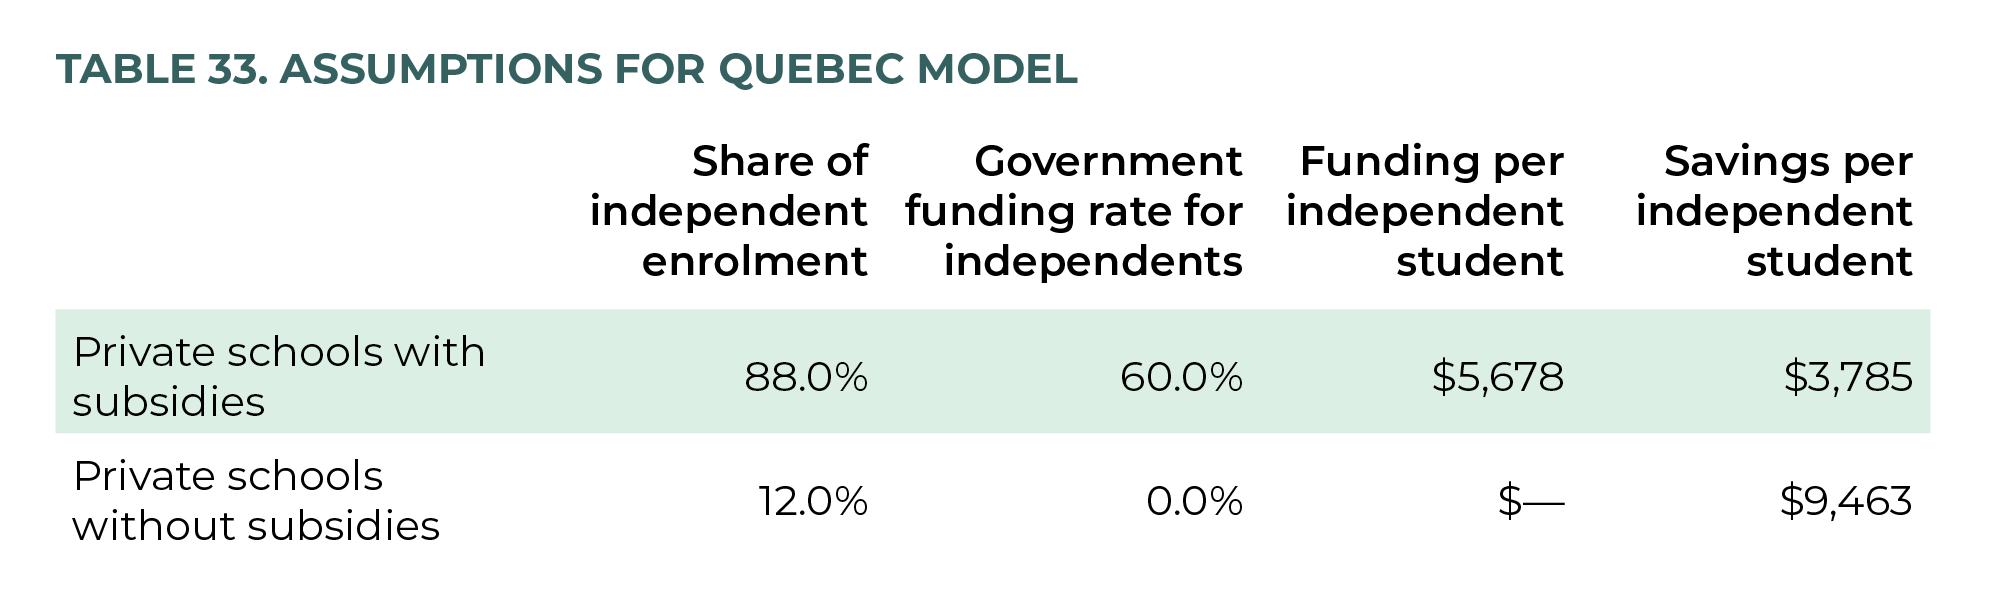
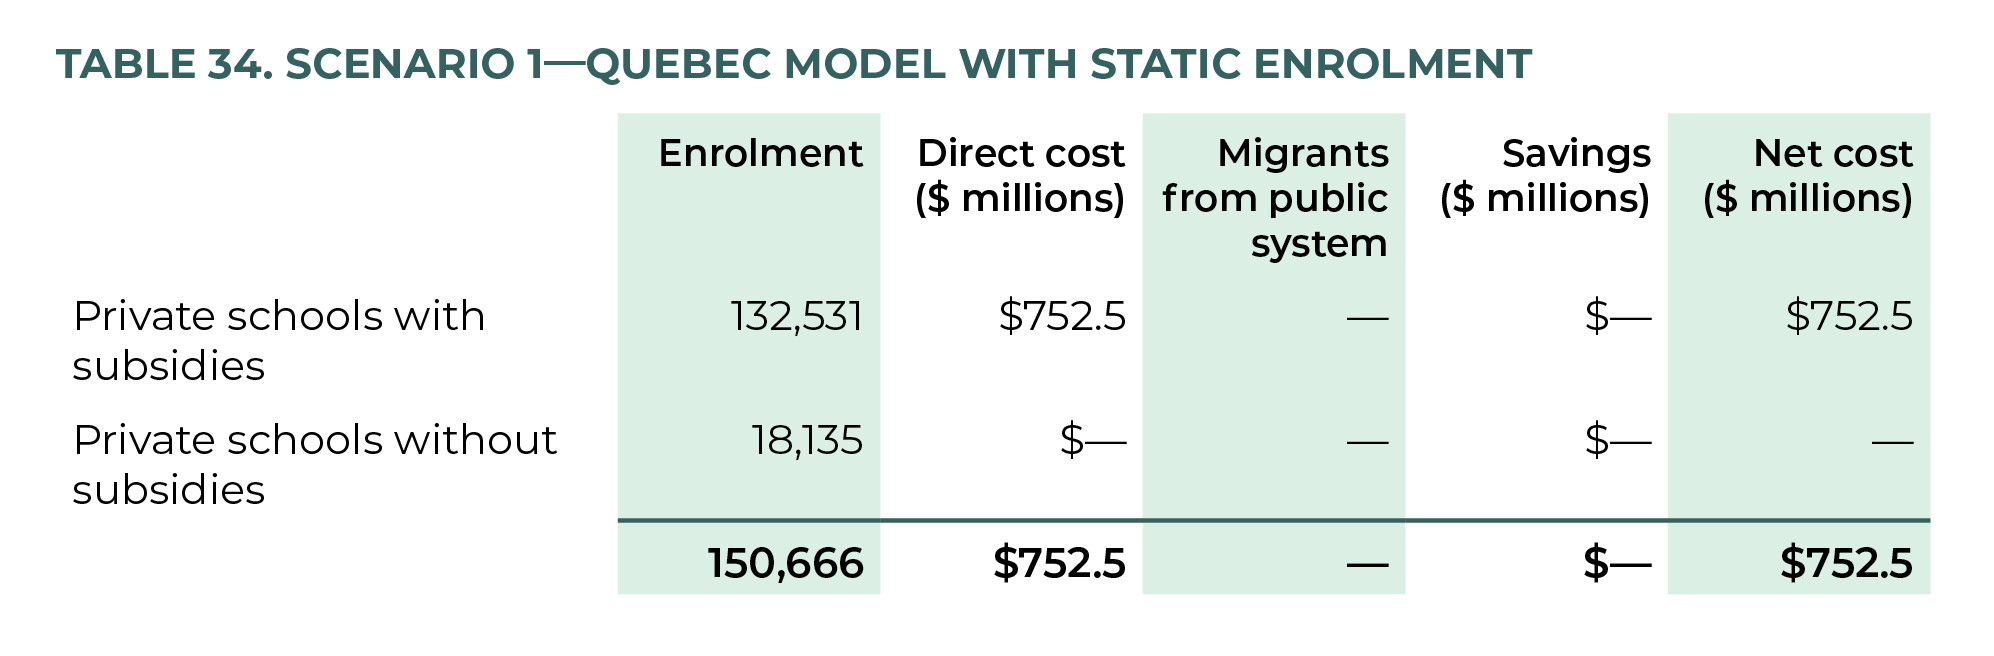
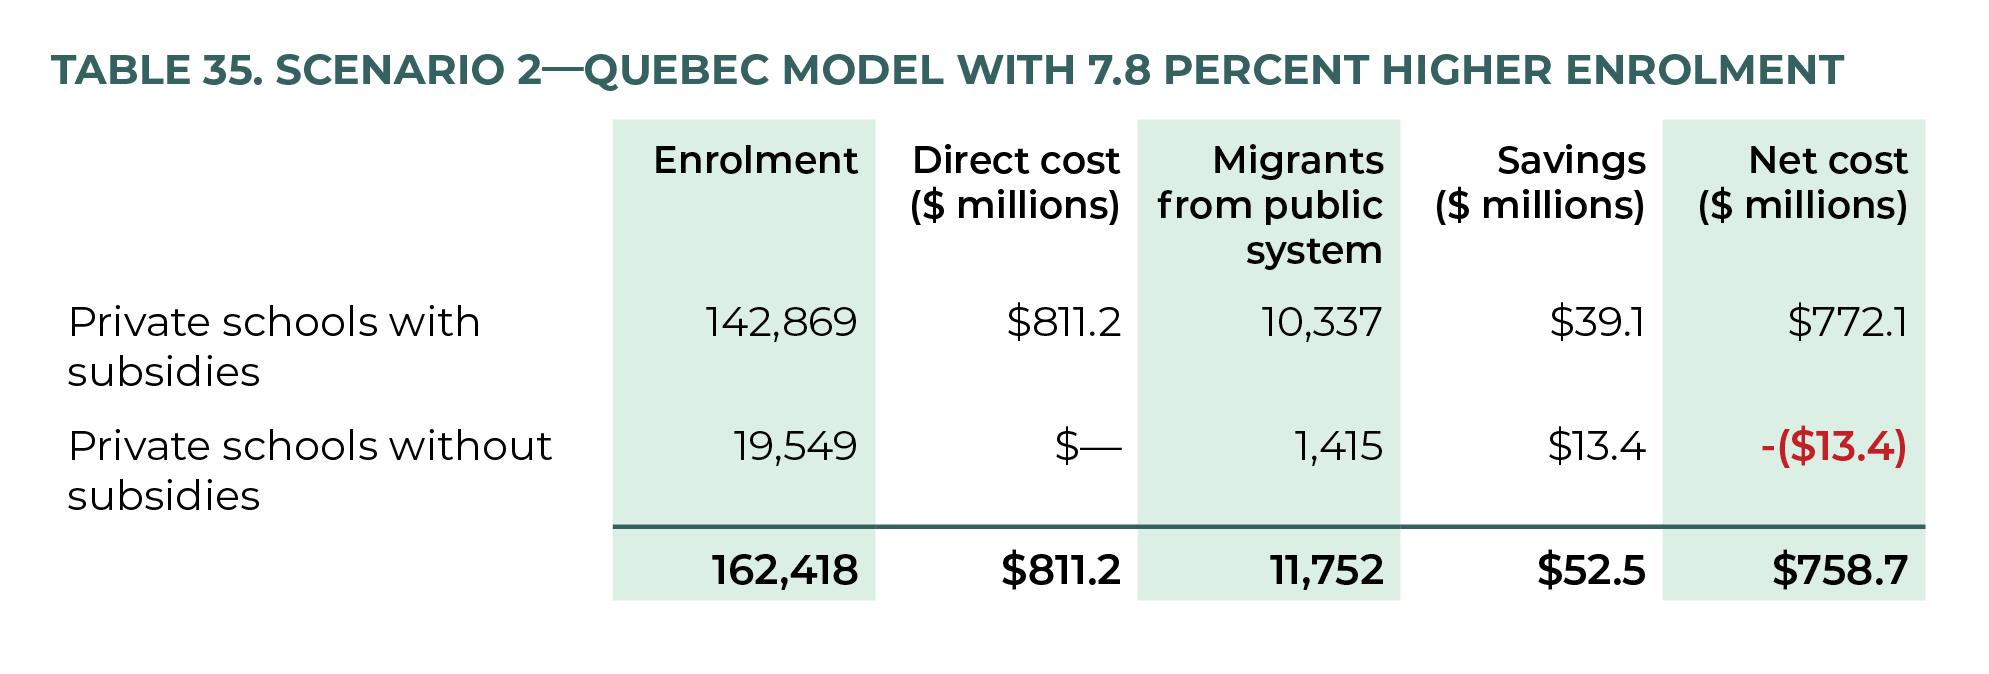
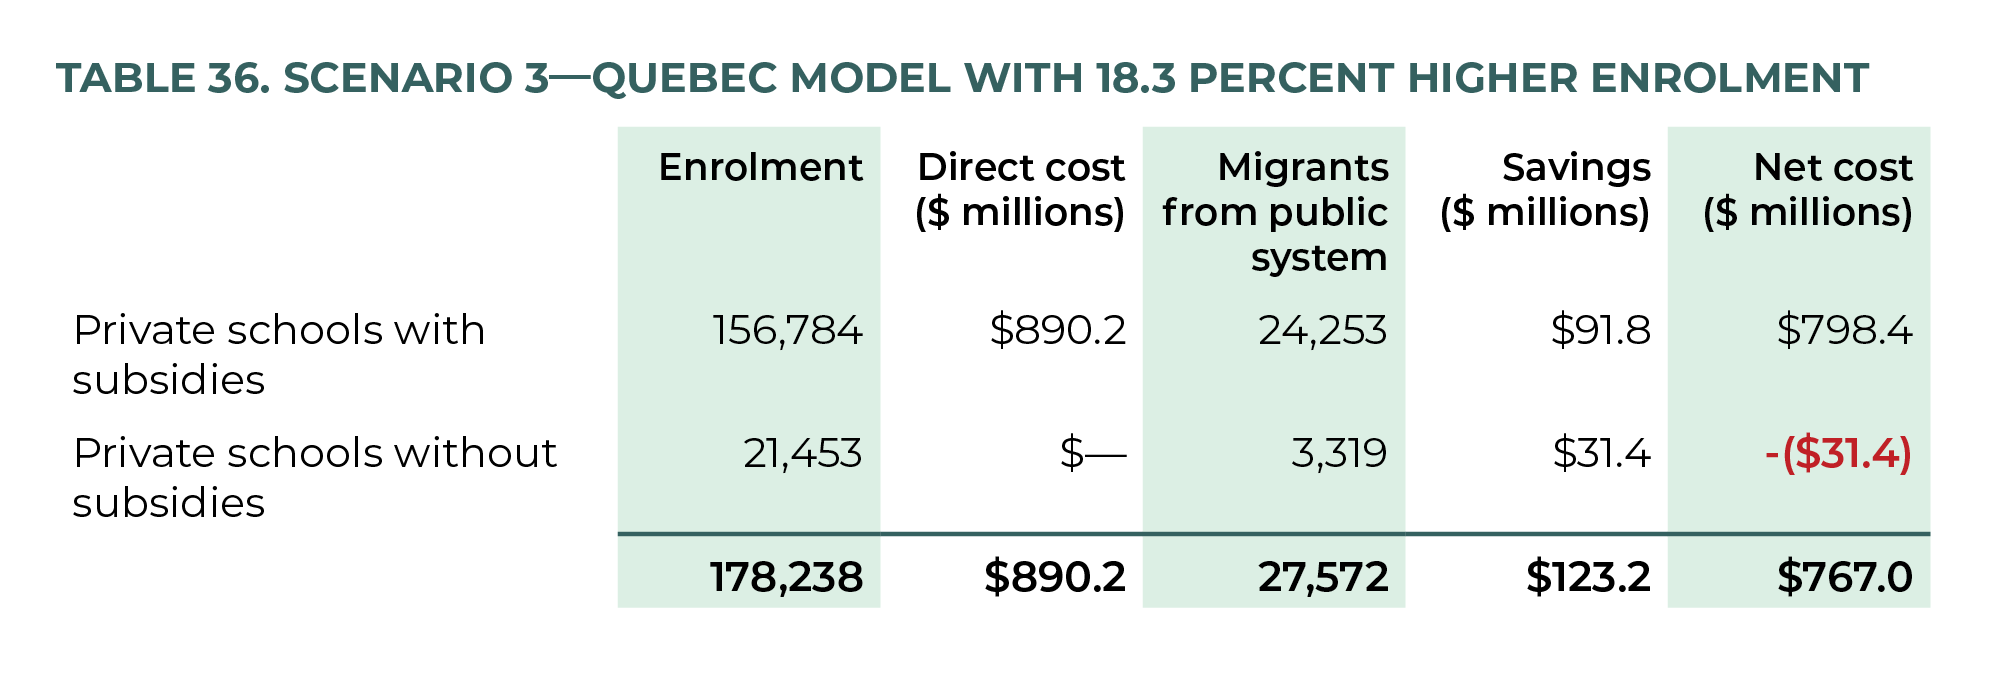
Summary of Results
Table 37 summarizes the direct and net costs of the seven options for funding independent schools in Ontario, for the lower-bound enrolment estimate (scenario 1), most plausible enrolment estimate (scenario 2), and upperbound enrolment estimate (scenario 3). 163 163 The data is from the 2018–2019 school year, as it is the most recent year for which comparable and complete data is available across all provinces. Each model applies one of the existing provincial independent-school funding schemes in Canada to Ontario’s independent-school sector, with the exception of the first model, which applies full operational funding (on par with public schools) to Ontario’s independent schools. It is also important to note that cost savings are realized in the second and third scenarios, as seen in the difference between their direct and net costs, due to the migration of students from public to independent schools.
Conclusion
Estimating the cost of funding Ontario independent schools based on Canadian jurisdictions is a hypothetical exercise, as the local issues, conditions, and circumstances—and politics—of every province are unique, and all existing funding schemes emerged in distinct combinations of the aforementioned at particular moments in time, none of which can be replicated in Ontario. Each funding scheme has unique stipulations in its province of origin, and thus implies considering that province’s rules for registering, classifying, and approving non-funded schools. This may be untenable in Ontario. Moreover, given that an average 92.4 percent of independent-school students attend funded independent schools in every province with funding, we have worked from the assumption—for the sake of modelling—that this would be paralleled in Ontario. This is likely an overestimation, as the independentschool sector in Ontario is growing, vibrant, and diverse—and perhaps many in the sector are uninterested in any possible “strings” attached with funding. Regardless, we believe this assumption is the most defensible. Last, current times have brought alternate ways of helping and funding education freedom that need not rely on the methods used in the past, nor should the province exclusively consider solutions from Canadian provinces. For example, if Ontario truly desires to be a twenty-first-century leader, it is likely preferable to consider the more recent solutions from other international jurisdictions, such as directly funding students rather than indirectly funding them through government transfers to independent schools. 164 164 For more on this, see Hunt, “Flexible Education in an Age of Disruption,” 12–15.
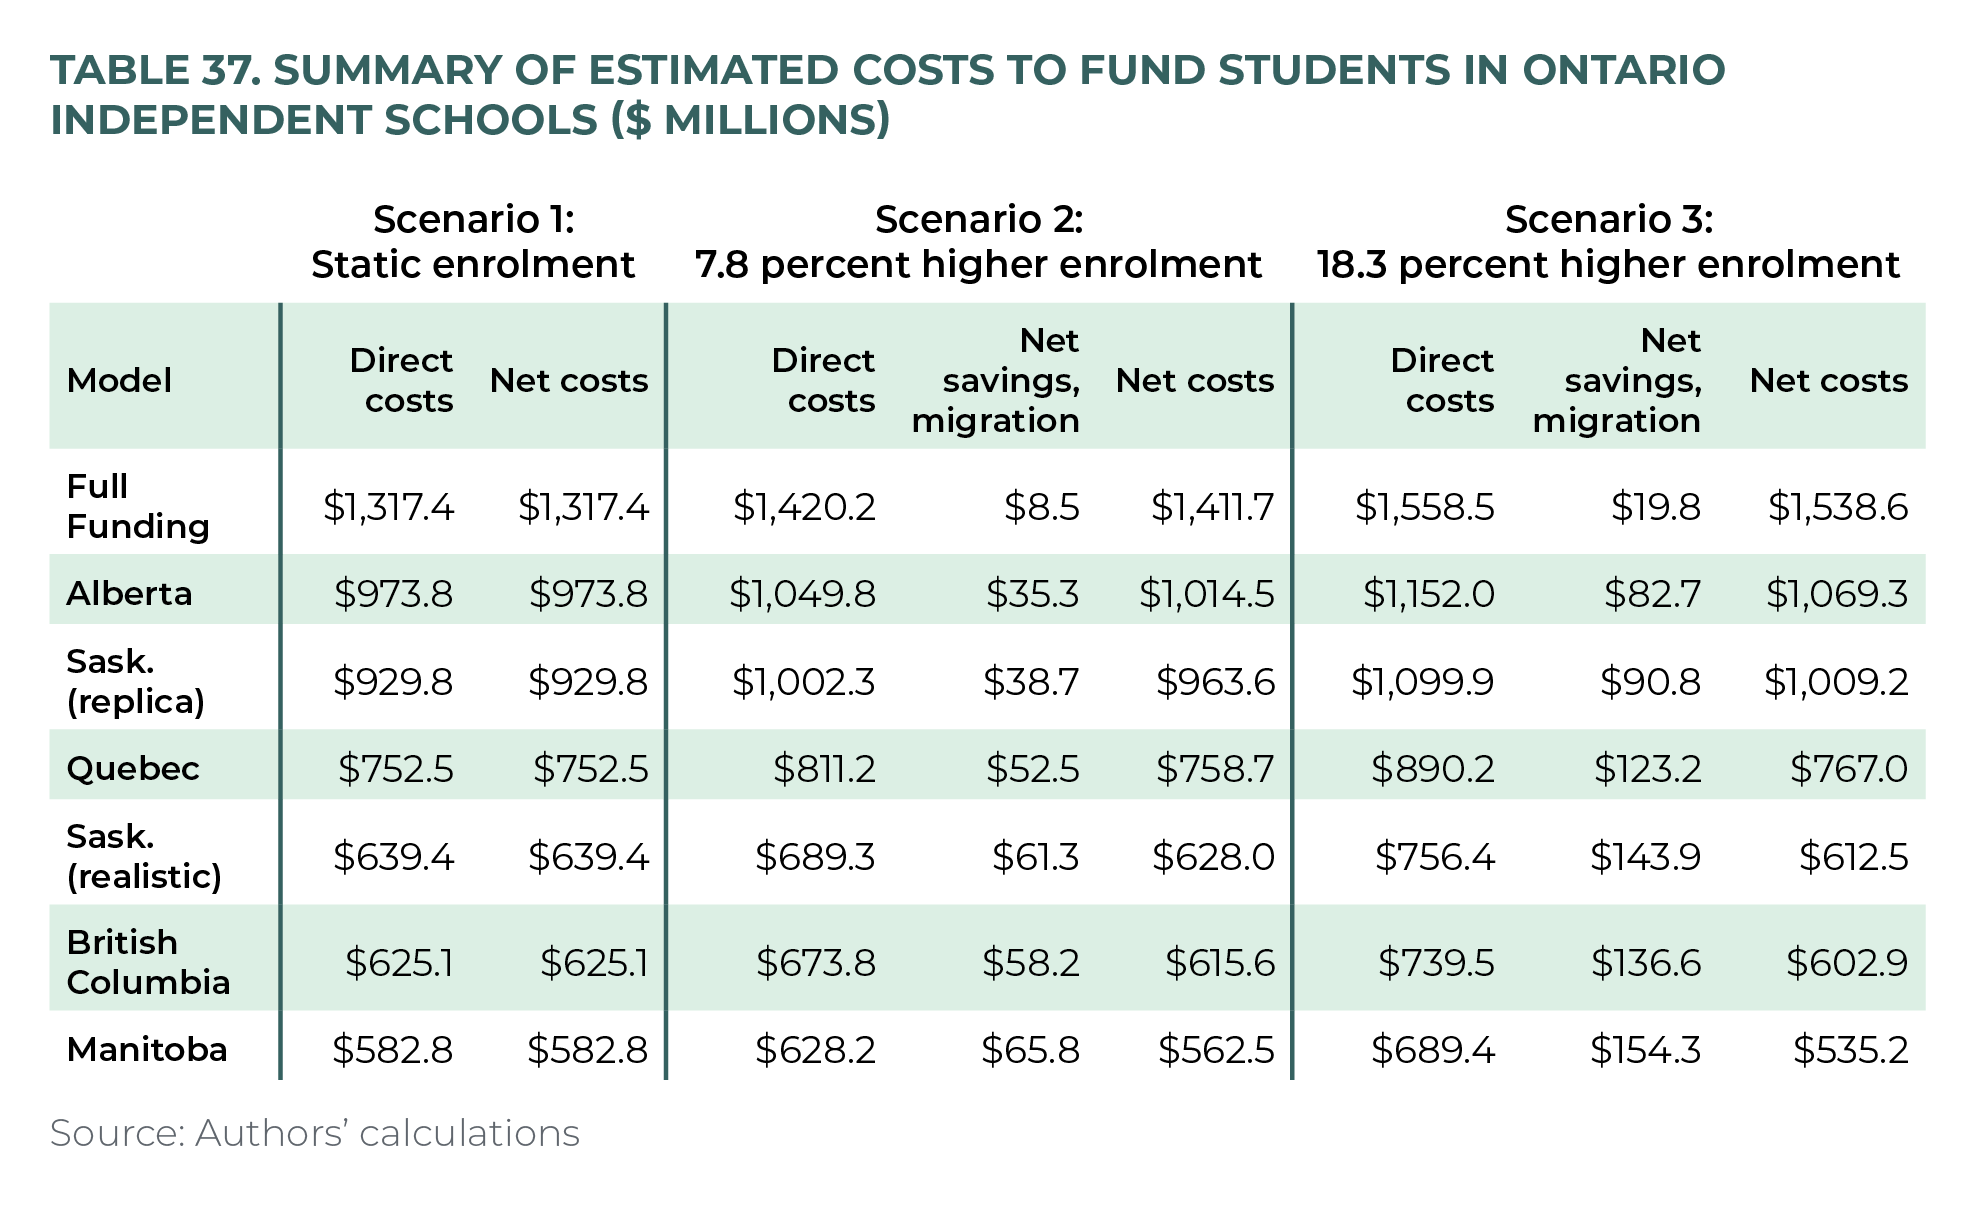
In conclusion, the challenge for any effective and equitable education system in a free society is balancing families’ educational freedom with school autonomy and high standards. Getting this combination of choice, independence, and accountability right—as research from around the world has shown for years—is truly a tide that lifts all boats to help disadvantaged students, while improving both student performance and non-cognitive outcomes—not to mention strengthening democratic citizenship and social cohesion.
Ontario’s lack of equitable funding—entirely excluding the independent-school sector from public funds—is an anomalous policy, from a global and even Canadian perspective. At least partially funding students in independent schools is the basic standard in democracies and advanced economies.
Catching up with the rest of the world’s basic standards of equity and pluralism means designating public funds to follow all Ontario students who so desire to participate in the school where they fit and that best meets their needs—including independent schools—without undue financial burden (as is the case presently in Ontario for many families). Or, Ontario should provide a tuition tax credit to parents of independent-school students and donors who support these communities.
Remedying this inequity in Ontario, as presented in our analyses, will have an immediate-term annual cost between $535.2 million and $1.539 billion dollars. This is around 1/3 to 4/5 of 1 percent (0.3% to 0.8%) of Ontario’s $186 billion annual budget
165
165
P. Bethlenfalvy, “Ontario’s Action Plan: Protecting People’s Health and Our Economy,” 2021 Ontario Budget,
Government of Ontario, 2021, 163, https://budget.ontario.ca/2021/pdf/2021-ontario-budget-en.pdf.
—a minimal cost for substantial benefit.
The spillover effects of financially supporting students who are enrolled in independent schools is likely to have an outsized impact. Put simply, this will most greatly benefit the most socioeconomically disadvantaged Ontario students, without excessively burdening or disrupting taxpayers and the existing school systems. For example, few Ontarians need a school that specializes in educating students with distinct special-education needs, but to those students and their families, such a school may be the difference between a rich and impoverished education. In an education system that prides itself on equity, inclusion, and excellence, such schools should not be easily accessible only to those of wealth and other means. Moreover, all of us benefit—all society is strengthened—when we look out for our neighbours and help ensure all students, especially the most disadvantaged, receive the best possible education that best meets their needs. This is at the heart of such funding, and why such reasoning rightly extends to students in religious communities. Few Ontarians are Adventist or Calvinist or Jewish or Sikh. But to those families who are, limiting them from formation within their cultural heritage and the richness of their faith is no longer defensible, if it ever was. Why, by withholding K–12 grants, would we limit this education experience to Ontarians of means, or those Ontarians of one particular faith? That is inconsistent with the spirit and foundation of Ontario and Ontarians.
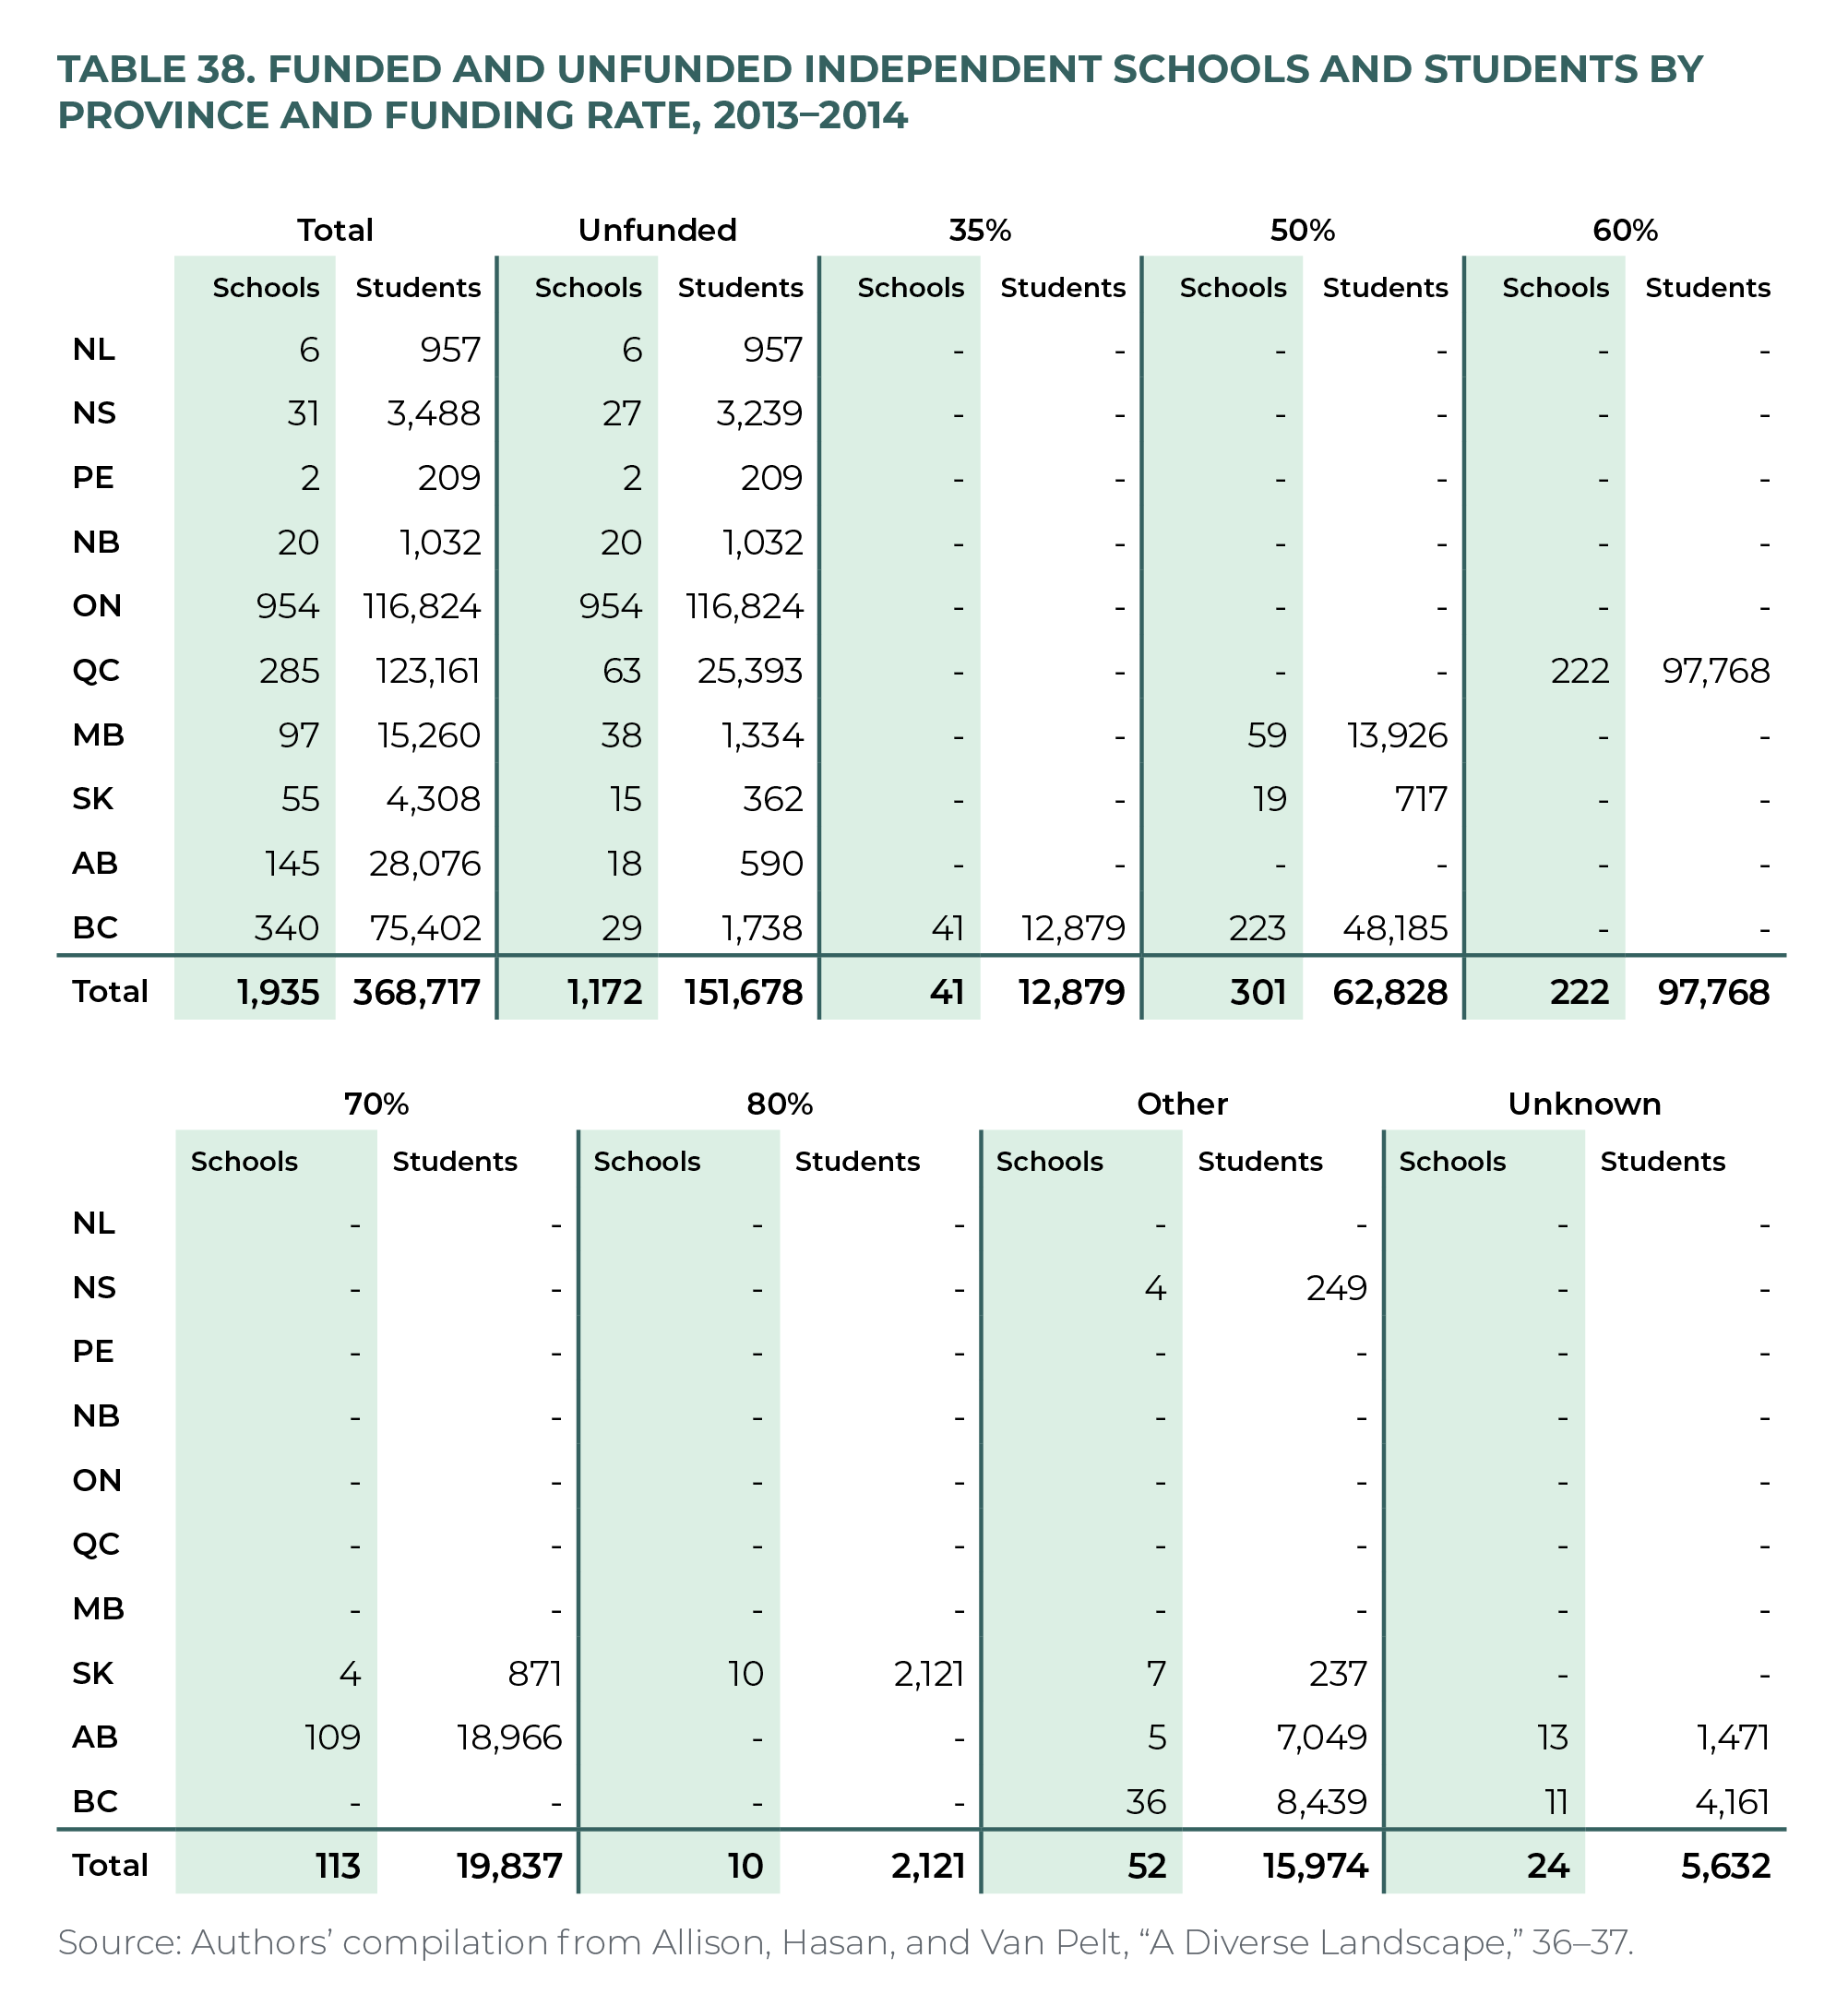
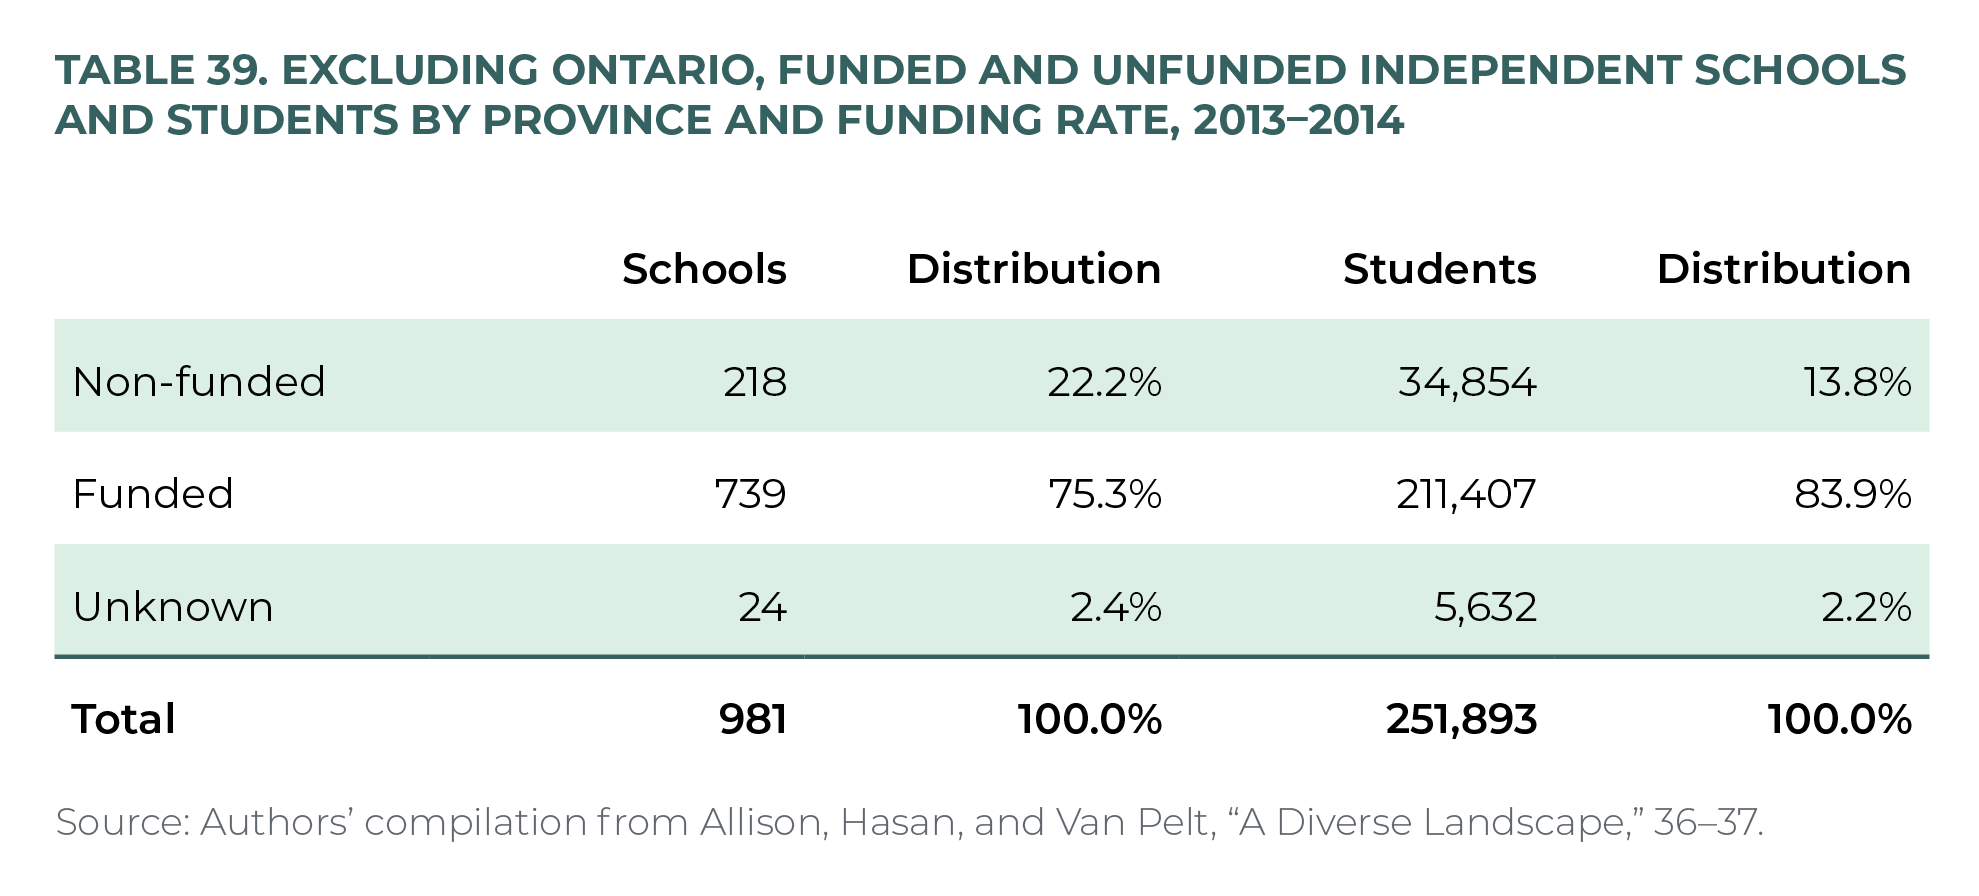
Appendix 2: Anticipated Impact of Independent-School Funding on K-12 Enrolment
Policy-Related Enrolment Effects on Catholic Separate Schools in Ontario
Exhaustive details of the complex history of taxpayer-funded grants for Catholic separate school boards are outside the scope of this study, but it is important to note that despite the guarantee of equitable funding in Section 93(1) of the Constitution Act, 1867—grandfathered in from existing legislation prior to Confederation—Ontario’s Catholic separate schools received fewer funds than government-run district schools, most especially in urban regions, until 1990. 166 166 R. Dixon, “An Historical Understanding of Key Issues Related to Catholic Education,” Dufferin-Peel Catholic District School Board, 2009. Going back to the first separate-school clause in the 1841 Common School Act, Ontario has always supported funding Catholic schools in some capacity, 167 167 Dixon, “An Historical Understanding of Key Issues Related to Catholic Education,” 2 but at times during that 150-year period—in earnest, as of the early twentieth century 168 168 Dixon, “An Historical Understanding of Key Issues Related to Catholic Education,” 4–5. —various governments found creative ways of circumventing the spirit of Section 93. 169 169 For an insightful analysis of the spirit of the law in S.93 of the Constitution Act, see the discussion on the origins of Roman Catholic separate schools in B. Fawcett, “Unchartered Territory.” One such example was funding for high schools. It was not until the mid-1980s that equitable funding was extended beyond grade 10 to all Catholic separate school boards. 170 170 Dixon, “William Davis and the Road to Completion in Ontario’s Catholic High Schools, 1971–1985.”
It is the introduction of funding to grades 11, 12, and 13—from no grants to on par with government-run schools—that is relevant to this study. How did this policy affect enrolment? According to scholar Derek J. Allison, one of the foremost authorities on Ontario education policy, “Extension of funding effectively resulted in the transfer of some 25,000 students from private to public schools,” 171 171 Allison, “Expanding Choice in Ontario’s Public Schools,” 14. primarily—almost entirely—from changed-status not cross-sector transfers. This points to the upper bound of potential enrolment changes resulting from similar policy reforms—which, when considering that around two million students were enrolled in Ontario’s school system at that time, is actually a surprisingly small number. Moreover, there is another important caveat to Allison’s assertion, which may be even more illuminating. Catholic high school enrolment peaked at 32 percent of the provincial share of secondary students, mirroring the share of Catholics in that age cohort in Ontario. Allison continues, “This suggests the increase in separate high school enrolment may have been largely driven by Catholic rather than non-Catholic enrolments.” 172 172 Allison, “Expanding Choice in Ontario’s Public Schools,” 15. In other words, the growth and decline in Catholic-school enrolment is reflective of the growth and decline in the number of school-age Catholics in Ontario.
Policy-Related Enrolment Effects on Independent Schools in Other Provinces
The same limited uptake in enrolment can be seen when looking at the provinces that partially fund independent schools. For example, the first province to introduce funding for independent schools was Alberta in 1967. 173 173 M. Wagner, “Charter Schools in Alberta: Change or Continuity in Progressive Conservative Education Policy?,” Alberta Journal of Educational Research 45, no. 1 (1999): 52–66, 55, https://journalhosting.ucalgary.ca/index.php/ajer/article/view/54626. Fifty-four years later, despite receiving operating grants up to 70 percent of the public-school rate, independent-school enrolment remains below 5 percent of the total Alberta student population today. In BC, where separate schools do not exist and therefore all Roman Catholic schools are independent, enrolment in independent schools was about 4 percent of the total student population when funding was introduced in 1977. Enrolment has increased every single year since, and yet, after nearly a half-century of non-stop growth, BC’s independent-school enrolment is still a small minority of the province’s student population, at just 13 percent, today. 174 174 Hunt and Van Pelt, “Who Chooses Independent Schools in British Columbia and Why?” 8. In Saskatchewan, in 2011, a new partially funded independentschool category was introduced. Since then, Saskatchewan’s independent-school enrolment has experienced the fastest percentage growth in the country: 34 percent over the seven years between 2011 and 2018. 175 175 5,196 ÷ 3,878 = 34%. However, in real terms, this is an increase of just 1,318 students over seven years, 176 176 5,196 – 3,878 = 1,318. or 188 students per year, in a province where total K–12 enrolment has increased by 19,701 students in the same period, from 172,551 students in 2011–2012 to 192,252 students in 2018–2019. 177 177 Statistics Canada, “Table 37-10-0109-01: Number of Students in Elementary and Secondary Schools.” Today, Saskatchewan’s independent-school enrolment remains below 3 percent of total student enrolment. In other words, Saskatchewan’s recent move to provide additional funding to independent schools has had a negligible effect on public-school enrollment. These three examples strongly suggest that any concerns that the introduction of funding for Ontario independent schools will lead to a mass exodus of students are unfounded.
Enrolment Effects Unrelated to Public Policy
Few parents pursue independent schools for their children, even in the provinces with funding. For those that do, the literature indicates that parents choose independent schools for primarily qualitative reasons, like school atmosphere, student safety, trust for the curriculum and instruction, student discipline, and alignment of the school philosophy with parents’ values (including religious values), among others. For those who can afford tuition, these factors typically have a larger impact on parents’ decision than does the cost. 178 178 Van Pelt, Hunt, and Wolfert, “Who Chooses Ontario Independent Schools and Why?”; J.P Kelly and B. Scafidi, “More Than Scores: An Analysis of Why and How Parents Choose Private Schools,” EdChoice, November 2013, http://www.edchoice.org/wpcontent/uploads/2015/07/More-Than-Scores.pdf. As Van Pelt, Hunt, and Wolfert, “Who Chooses Ontario Independent Schools and Why?,” find of independent school parents in Ontario, “The top-ranked reasons why parents chose an independent school for their children include school safety—concerns about bullying being less important than trust in the curriculum and staff—as well as a supportive and motivating educational environment that matches their families’ values. When responses from religious and non-religious independent school parents are considered together, the five most cited characteristics for parents are that their chosen independent school (1) is safe, (2) offers a supportive, nurturing environment, (3) emphasizes character development, (4) has trustworthy curriculum, and (5) has outstanding teachers. Conversely, the least important factors for parents include having family and friends at the school, transportation, cost, and geographic proximity. This does not imply that costs are unimportant but, as previously discussed, simply that enrolment in independent schools is not directly proportional to the amount of public funding offered to the independent-education sector. Many families that prefer an independent school for their children use whatever funding is available (and, in some cases, no funding) and enrol their children in schools that meet their preferences and are within their family budgets (albeit it is worth noting that many in Ontario receive bursaries or other tuition supports, especially for religious independent schools). Several intervening factors can probably better explain the enrolment in independent schools in each province, including demographics, religious affiliations, education policies, history of the education system, local culture, and so on. A detailed determination of the strength of these factors is beyond the scope of the present analysis.
Appendix 3: Saskatchewan Independent-School Categories
Saskatchewan has five 179 179 One school in a sixth category, Outreach Schools, existed for the three years from 2013–2014 to 2015–2016. See Van Pelt, “Qualified Independent Schools in Saskatchewan.” main categories of independent schools—namely, Registered independent schools, Alternative independent schools, Historical high schools, Associate independent schools, and Qualified independent schools. Every category of independent school, except Registered independent schools, 180 180 All independent schools in Saskatchewan must be registered with the government, but they do not have to receive any government funding. The Registered independent schools category provides an option for school societies that prefer maximum independence and minimal oversight. They do not receive funding. receives some amount of partial funding from the provincial government.
Registered independent schools must meet a number of basic eligibility requirements, including having a board with at least three adults from different family units; two students from two different family units; facilities that meet safety, health, and construction standards; incorporation in Saskatchewan; a distinct and non-misleading name; and willingness to be inspected by ministry officials. If the school offers secondary-level credits, it must also follow provincial curriculum policy, provide only approved programs, and agree to be supervised by ministry personnel and teachers. 181 181 Government of Saskatchewan, “Registered Independent Schools Regulations.”
Alternative independent schools primarily serve students with special-education needs. These schools are required to meet the same basic requirements as Registered independent schools. In addition, they also must follow provincial curriculum, provide only approved programs, employ only provincially approved teachers (with Saskatchewan Teachers Federation membership), and agree to be supervised by ministry officials. Alternative independent schools are funded through individual service agreements; whereby, only “students of the province” placed in the school by the government receive funding. Alternative independent schools are funded between $23,728 and $56,190 per student, depending on the negotiated requirement to serve the individual student. 182 182 Van Pelt, “Qualified Independent Schools in Saskatchewan.”
Historical high schools are a closed group of schools that have been designated to this category due to their historical contributions in filling educational gaps in the province. They offer only grades 9 to 12. They meet the basic requirements of Registered independent schools, plus they follow provincial curriculum policy, provide only approved programs, employ only provincially certified teachers (with Saskatchewan Teachers Federation membership), and agree to be inspected and supervised by ministry officials or designates. Historical high schools receive partial government funding at 70 percent of the provincial per-student average amount. 183 183 Van Pelt, “Qualified Independent Schools in Saskatchewan.” This provincial per-student average is calculated based on the eligible operating funding amount, and does not include debt repayment, First Nations and Métis Education Achievement Fund amounts, associate school funding, language and culture, and other funding adjustments. 184 184 Saskatchewan Ministry of Education, “2021–22 Funding Manual.”
Associate schools are a category of independent schools that have been established for faith-based reasons and that have a contractual agreement with a public-school board of education to operate in association with that board. They essentially operate as a school within a specific school division, following all of the policies and procedures of that board. They must meet the basic requirements of Registered independent schools but are also required to have operated for two consecutive years immediately before entering the Associate School Agreement. Associate schools must also follow provincial curriculum policy, provide only approved programs, and employ only registered teachers who hold a valid Professional A Teacher’s Certificate (issued pursuant to The Registered Teachers Act). 185 185 Government of Saskatchewan, “Registered Independent Schools Regulations.” Associate schools are funded at approximately 80 percent of the provincial-average operating per-student amount. 186 186 Van Pelt, “Qualified Independent Schools in Saskatchewan.”
The newest category, Qualified independent schools, was created in December 2011. These schools must meet the same basic requirements as Registered independent schools. In addition, they must have operated for two consecutive years before applying for funding, be owned and operated by a non-profit corporation, follow provincial curriculum policy, provide only approved programs, employ only provincially certified teachers, participate fully in the ministry’s accountability framework, submit annual financial statements, agree to be supervised and inspected by ministry officials, and comply with ministry policy and directives. These schools receive partial government funding of 50 percent of the provincial per-student average amount. 187 187 Van Pelt, “Qualified Independent Schools in Saskatchewan.”
References
Alberta, Government of. Education Act. Pub. L. No. Statutes of Alberta, 2012 Chapter E-0.3 (2012).
———. “Education: Annual Report 2018–2019.” June 2019. https://open.alberta.ca/dataset/8b226e68-1227-4aec-87a5-b573f3bfb062/resource/fec2c6c0-2fa7-4030-adcc8f3dbaa1bcf4/download/education-annual-report-2018-2019-web.pdf.
———. “Establishing a Private School: Application Process and Requirements.” 2018. https://open.alberta.ca/dataset/d6185185-28e0-4b73-8d5f-293777df363f/resource/2d41f3d8-
739c-408a-adbf-0c6307ec8ccb/download/edc-establishing-private-school-application-process-and-requirements-2018.pdf.
———. “Student Population Statistics.” 2021. https://www.alberta.ca/student-populationstatistics.aspx.
Alberta Ministry of Education. “Funding Manual for School Authorities 2020/2021 School Year.” 2021. https://open.alberta.ca/publications/1485-5542.
Alberta, Province of. “Private Schools Regulation.” In Education Act, Pub. L. No. Alberta Regulation 93/2019 (2019). https://www.qp.alberta.ca/documents/Regs/2019_093.pdf.
Allison, D. “Bringing School Choice to Ontario.” Fraser Institute, September 2020. https://www.fraserinstitute.org/sites/default/files/bringing-school-choice-to-ontario.pdf.
———. “Expanding Choice in Ontario’s Public Schools.” Fraser Institute, November 2015. https://www.fraserinstitute.org/sites/default/files/expanding-choice-in-ontarios-publicschools.pdf.
Allison, D., and D. Van Pelt. “Canada.” In Balancing Freedom, Autonomy and Accountability in Education, edited by C. Glenn and J. de Groof. Nijmegen, 3:79–142. Nijmegen: Wolf Legal Publishers, 2012.
Allison, D., S. Hasan, and D. Van Pelt. “A Diverse Landscape: Independent Schools in Canada.” Fraser Institute, June 2016. https://www.fraserinstitute.org/sites/default/files/a-diverse-landscape-independent-schools-in-canada.pdf.
Bank of Canada. “Inflation Calculator.” https://www.bankofcanada.ca/rates/related/inflationcalculator/.
Bennett, P.W. The State of the System: A Reality Check on Canada’s Schools. Montreal: McGill Queen’s University Press, 2020.
Berner, A.R. “Good Schools, Good Citizens: Do Independent Schools Contribute to Civic Formation?” Cardus, June 2021. https://www.cardus.ca/research/education/reports/goodschools-good-citizens/.
Bethlenfalvy, P. “Ontario’s Action Plan: Protecting People’s Health and Our Economy.” 2021 Ontario Budget, Government of Ontario, 2021. https://budget.ontario.ca/2021/pdf/2021-ontario-budget-en.pdf.
Boeskens, L. “Regulating Publicly Funded Private Schools: A Literature Review on Equity and Effectiveness.” OECD Education Working Papers 147 (2016): http://dx.doi.org/10.1787/5jln6jcg80r4-en.
British Columbia, Government of. “2020/21 Interim Operating Grants.” May 2021. https://www2.gov.bc.ca/gov/content/education-training/k-12/administration/resourcemanagement/k-12-funding-and-allocation/operating-grants/k12funding-20-21.
———. “Funding Rates for Independent Schools 2020/21: Final.” Resource Management Division, December 2020. https://www2.gov.bc.ca/assets/gov/education/administration/kindergarten-to-grade-12/independent-schools/funding-rates-for-is-20-21-final.pdf.
———. Independent School Act. Pub. L. No. [RSBC 1996] CHAPTER 216. https://www.bclaws.gov.bc.ca/civix/document/id/complete/statreg/96216_01.
British Columbia Ministry of Education. “2018/2019–2020/21 Service Plan.” February 2018. https://www.bcbudget.gov.bc.ca/2018/sp/pdf/ministry/educ.pdf.
———. “Fees and Bonding Statement: School Year 2020/2021.” Government of British Columbia. https://www2.gov.bc.ca/gov/content/education-training/k-12/administration/legislation-policy/independent-schools/group-4-independent-school-bonding-policy.
———. “Grants to Independent Schools.” May 2020. https://www2.gov.bc.ca/gov/content/education-training/k-12/administration/legislation-policy/independent-schools/grantsto-independent-schools.
———. “Independent School Information.” 2021. http://www.bced.gov.bc.ca/apps/imcl/imclWeb/IndSchool.do?school_category=Independent School.
Caldas, S.J., and S. Bernier. “The Effects of Competition from Private Schooling on French Public School Districts in the Province of Québec.” Journal of Educational Research 105, no. 5 (2012): 353–65.
Catholic Independent Schools Vancouver Archdiocese. “History of Catholic Education.” https://cisva.bc.ca/info/history/.
Cheng, A., and D. Iselin. “Cardus Education Survey Australia: Australian Schools and the Common Good.” August 2020. https://carduseducationsurvey.com.au/wp-content/uploads/2020/08/Cardus-Education-Survey-Australia_Full-Report-Final.pdf.
Clemens, J., S. Parvani, and J. Emes. “Comparing the Family Income of Students in British Columbia’s Independent and Public Schools.” Fraser Institute, March 2017. https://www.fraserinstitute.org/sites/default/files/comparing-family-income-of-students-in-BCsindependent-and-public-schools.pdf.
Clifton, R.A. “Bill 64 Won’t Destroy Public Education.” Winnipeg Free Press, March 31, 2021. https://www.winnipegfreepress.com/opinion/analysis/bill-64-wont-destroy-publiceducation-574104442.html.
DeAngelis, C.A. “The Public Benefit of Private Schooling: Test Scores Rise When There Is More of It.” Cato Institute, January 22, 2018. https://www.cato.org/policy-analysis/publicbenefit-private-schooling-test-scores-rise-when-there-more-it.
Dixon, R. “An Historical Understanding of Key Issues Related to Catholic Education.” Dufferin Peel Catholic District School Board, 2009.
———. “William Davis and the Road to Completion in Ontario’s Catholic High Schools, 1971–1985.” Canadian Catholic Historical Association, Historical Studies 69 (2003): 7–33.
EdChoice. “The 123s of School Choice: What the Research Says About Private School Choice Programs in America.” April 15, 2021. https://www.edchoice.org/research/the-123s-ofschool-choice-2/.
Egalite, A.J. “Measuring Competitive Effects from School Voucher Programs: A Systematic Review.” Journal of School Choice 7, no. 4 (2013): 443–64. https://dx.doi.org/10.1080/15582159.2013.837759.
Egalite, A.J., and P.J. Wolf. “A Review of the Empirical Research on Private School Choice.” Peabody Journal of Education 91, no. 4 (2016): 441–54. https://dx.doi.org/10.1080/0161956X.2016.1207436.
Epple, D., R.E. Romano, and M. Urquiola. “School Vouchers: A Survey of the Economics Literature.” Journal of Economic Literature 55, no. 2 (2017): 441–92. https://dx.doi.org/10.1257/jel.20150679.
European Parliament. “Resolution of 12 June 2018 on Modernisation of Education in the EU.” June 12, 2018. https://www.europarl.europa.eu/doceo/document/TA-8-2018-0247_EN.html.
Fawcett, B. “Unchartered Territory: A Historical and Critical Analysis of Alberta’s Prohibition on Religious Charter Schools.” Cardus, April 2021. https://www.cardus.ca/research/education/reports/unchartered-territory/.
Federation of Independent School Associations (FISA) of BC. “Summary of Conditions for Classification of Independent Schools: DL and non-DL.” June 2009. https://fisabc.ca/wp-content/uploads/pdf/4-requirements-for-schools.pdf.
Glenn, C.L. “What the United States Can Learn from Other Countries.” In What America Can Learn from School Choice in Other Countries, edited by D.F. Salisbury and J. Tooley, 79–88. Washington, DC: Cato Institute, 2005.
Glenn, C.L., J. de Groof, and C.S. Candal. Balancing Freedom, Autonomy, and Accountability in Education. 4 vols. Nijmegen: Wolf Legal Publishers, 2012.
Green, B., D. Sikkema, and D. Sikkink. “Cardus Education Survey 2018: Ontario Bulletin.” Cardus, October 2018. https://www.cardus.ca/research/education/reports/carduseducation-survey-2018-ontario-bulletin/.
Hill, T., N. Li, and J. Emes. “Education Spending in Public Schools in Canada: 2021 Edition.” Fraser Institute, January 2021. https://www.fraserinstitute.org/sites/default/files/education-spending-in-public-schools-in-canada-2021.pdf.
Howley, C., J. Johnson, and J. Petrie. “Consolidation of Schools and Districts: What the Research Says and What It Means.” National Education Policy Center, February 2011. https://nepc.colorado.edu/sites/default/files/PB-Consol-Howley-Johnson-Petrie.pdf.
Hoxby, C.M. Introduction to The Economics of School Choice, edited by C.M. Hoxby, 1–22. Chicago: University of Chicago Press, 2003. https://www.nber.org/system/files/chapters/c10083/c10083.pdf.
———. “School Choice and School Productivity: Could School Choice Be a Tide that Lifts All Boats?” In The Economics of School Choice, edited by C.M. Hoxby, 287–341. Chicago: University of Chicago Press, 2003. https://www.nber.org/system/files/chapters/c10091/c10091.pdf.
Hunt, D. “Flexible Education in an Age of Disruption: Embracing Innovation and Diversity in Ontario K–12 Education.” Cardus, May 2020. https://www.cardus.ca/research/education/reports/flexible-education-in-an-age-of-disruption/.
———. “Independent Schools Left Out of Ontario’s COVID Support.” Ottawa Citizen, April 1, 2021. https://ottawacitizen.com/opinion/hunt-independent-schools-left-out-of-ontarioscovid-support.
———. “Religious Freedom Equals Educational Freedom.” Convivium, March 31, 2021. https://www.convivium.ca/articles/religious-freedom-equals-educational-freedom/.
Hunt, D., and D. Van Pelt. “Who Chooses Independent Schools in British Columbia and Why?” Cardus, August 2019. https://www.cardus.ca/research/education/reports/whochooses-independent-schools-in-british-columbia-and-why/.
Hunt, D., and R. Leistra. “Who Chooses Alberta Independent Schools and Why?” Cardus, September 2020. https://www.cardus.ca/research/education/reports/who-chooses-albertaindependent-schools-and-why/.
Hunter, J.D., and R.S. Olson. “The Moral Ecology of Formation: Conclusions and Parting Questions.” In The Content of Their Character: Inquiries into the Varieties of Moral Formation, edited by J.D. Hunter and R.S. Olson. New York: Finstock & Tew, 2018.
Justesen, M.K. “Learning from Europe: The Dutch and Danish School Systems.” Adam Smith Institute, 2002.
Kelly, J.P., and B. Scafidi. “More Than Scores: An Analysis of Why and How Parents Choose Private Schools.” EdChoice, November 2013. http://www.edchoice.org/wp-content/uploads/2015/07/More-Than-Scores.pdf.
Kuyper, A. On Education. Edited by Wendy Naylor and Harry Van Dyke. Bellingham, WA: Lexham, 2019.
Lagos, J.A. “Parental Education Rights in the United States and Canada: Homeschooling and Its Legal Protection.” PhD diss. Pontificia Universitas Sanctae Crucis, Facultas Iuris Canonici, Rome, 2011.
Lankford, H., and J. Wyckoff. “Primary and Secondary School Choice Among Public and Religious Alternatives.” Economics of Education Review 11, no. 4 (1992): 317–37.
Laschinger, J. “When Lack of Faith Lost John Tory an Election.” Toronto Star, July 30, 2016. https://www.thestar.com/news/insight/2016/07/30/when-lack-of-faith-lost-john-tory-anelection.html.
MacLeod, A., S. Parvani, and J. Emes. “Comparing the Family Income of Students in Alberta’s Independent and Public Schools.” Fraser Institute, October 2017. https://www.fraserinstitute.org/sites/default/files/comparing-the-family-income-of-students-inalbertas-independent-and-public-schools.pdf.
Manitoba Education. “Annual Report 2018–2019.” https://www.edu.gov.mb.ca/annualreports/edu_18-19/report.pdf.
———. “Funding of Independent Schools and Reporting Requirements: 2020/2021 School Year.” September 2020. https://www.edu.gov.mb.ca/k12/finance/forms/independent/docs/enrol_reporting_2020.pdf.
———. “School Enrolment Reports.” September 2020. https://www.edu.gov.mb.ca/k12/finance/sch_enrol/index.html.
Manitoba, Province of. The Education Administration Act. Pub. L. No. C.C.S.M. c. E10, Manitoba Laws (2019).
———. “Private School Grants Regulation.” Pub. L. No. M.R. 84/2013, in The Public Schools Act (C.C.S.M. c. P250), 2012. https://web2.gov.mb.ca/laws/regs/current/_pdf-regs.php?reg=61/2012.
———. The Public Schools Act. Pub. L. No. C.C.S.M. c. P250, Manitoba Laws (2021). https://web2.gov.mb.ca/laws/statutes/ccsm/p250_2e.php#60(5).
Manitoba’s Commission on Kindergarten to Grade 12 Education. “A Comprehensive, Independent Review of the Kindergarten to 12 Education System.” http://www.mbschoolboards.ca/documents/Advocacy/K12 Review_PublicDiscussionPaper-ENG.pdf.
Marcus, P., D. Van Pelt, and T. Boven. “Pandemic Pivot: Christian Independent Schooling During the Initial 2020 Lockdown.” Cardus, June 2021. https://www.cardus.ca/research/education/reports/pandemic-pivot/.
Marcus, P., N. Brouwer, D. Van Pelt, T. Boven, and D. Hunt. “Pandemic Response: How Christian Independent Schools Responded to a Year of COVID-19.” Cardus, August 2021. https://www.cardus.ca/research/education/reports/pandemic-response/.
Merrifield, J. “Assessing Competition.” In School System Reform: Why and How Is a Price-less Tale. Murrells Inlet, SC: Covenant Books, 2019.
Ontario Ministry of Education. “Education Funding: Technical Paper 2019–20.” Spring 2019. http://www.edu.gov.on.ca/eng/funding/1920/TechnicalPaper2019-20.pdf.
———. “Private School Enrolment by Gender.” Data Catalogue, 2021. https://data.ontario.ca/en/dataset/private-school-enrolment-by-gender.
———. “Quick Facts: Ontario Schools, 2016–17.” 2019. http://www.edu.gov.on.ca/eng/general/elemsec/quickfacts/2016_2017.html.
———. “School Information and Student Demographics.” Data Catalogue, 2021. https://data.ontario.ca/en/dataset/school-information-and-student-demographics.
Organisation for Economic Co-operation and Development [OECD]. PISA 2009 Technical Report. Paris: OECD Publishing, 2012. http://dx.doi.org/10.1787/9789264167872-en.
———. Public and Private Schools: How Management and Funding Relate to their Socio-economic Profile. Paris: OECD Publishing, 2012. http://dx.doi.org/10.1787/9789264175006-en.
———. School Choice and School Vouchers: An OECD Perspective. Paris: OECD Publishing, 2017. https://www.oecd.org/education/School-choice-and-school-vouchers-an-OECDperspective.pdf.
Organization International pour la Liberté Educative. “Freedom of Education Index: Worldwide Report 2016 on Freedom of Education.” Novae Terrae Foundation, 2016. https://www.oidel.org/wordpress/wp-content/uploads/2016/02/FEI_complet2.pdf.
Pakaluk, C.R. “What Good Is a Good Fit? Religious Matching and Educational Outcomes.” Cosmos + Taxis 9, no. 1–2 (2021): 3–30.
Pelz, M.L., and K.R. den Dulk. “Looking Within or Reaching Out? The Effects of Religion on Private Enrollments in an Era of School Choice.” Politics and Religion 11, no. 1 (2018): 79–115. doi:10.1017/S1755048317000499.
Pennings, R., J. Seel, D. Van Pelt, D. Sikkink, and K. Wiens. “Cardus Education Survey: Do the Motivations for Private Religious Catholic and Protestant Schooling in North America Align with Graduate Outcomes?” Cardus, 2011. https://www.cardus.ca/research/education/reports/cardus-education-survey-phase-i-report-2011/.
Phillips, W.J. “Ontario Public and Catholic School Merger Study.” Federation of Urban Neighbourhoods, March 2012. https://urbanneighbourhoods.ca/wp-content/uploads/2020/10/ontario-public-and-catholic-school-merger-study.pdf.
Québec, Banque de données des statistiques officielles sur le. “Effectif scolaire de la formation générale des jeunes par école selon diverses variables, années scolaires 2014–2015 à 2020–2021 Québec.” 2021. https://bdso.gouv.qc.ca/pls/ken/ken213_afich_tabl.page_tabl?p_iden_tran=REPER0JXANX47175270687458jiY0,&p_lang=1&p_id_ss_domn=825&p_id_raprt=3512#de_temps_refrn=2019-2020p&tri_de_statut=1&tri_codfc2=5.
Québec, Databank of Official Statistics on. “School Attendance.” 2021. https://bdso.gouv.qc.ca/pls/ken/ken2122_navig_niv_2.page_niv2?p_iden_tran=REPERTW50YC351558536171179PU%7C%7B&p_lang=2&p_id_ss_domn=825.
Québec, Gouvernement du. “Education: A Plan for Success.” The Québec Economic Plan: Budget 2018–2019, March 2018. http://www.budget.finances.gouv.qc.ca/budget/2018-2019/en/documents/Education_1819.pdf.
Québec Ministère de l’Éducation et de l’Enseignement supérieur. “Guide Général du Financement, Publication 2019–2020: Éducation Préscolaire et Enseignement Primaire et Secondaire.” 2019. http://www.education.gouv.qc.ca/fileadmin/site_web/documents/PSG/ress_financieres/rb/Guide_fin_2019-2020.PDF.
Québec, Statuts du. “Chapitre II: Permis.” Chapitre E-9.1: Loi Sur l’Enseignement Privé. http://legisquebec.gouv.qc.ca/fr/pdf/cs/E-9.1.pdf.
———. “Chapitre VI: Commission Consultative de l’Enseignement Privé.” Chapitre E-9.1: Loi Sur l’Enseignement Privé. http://legisquebec.gouv.qc.ca/fr/pdf/cs/E-9.1.pdf.
Robson, K.L. “The Structure of Education in Canada.” In Sociology of Education in Canada. Toronto: Pearson Canada, 2013.
Saskatchewan Ministry of Education. “2021–22 Funding Manual: Prekindergarten to Grade 12 Funding Distribution Model.” April 2021. https://publications.saskatchewan.ca/#/products/100142.
Saskatchewan, Government of. “2018–19 Ministry of Education Budget Backgrounder.” Student First media release, April 2018. https://www.saskatchewan.ca/-/media/news-release-backgrounders/2018/apr/2018-19-education-backgrounder.pdf.
———. “Qualified Independent Schools.” 2021. https://www.saskatchewan.ca/government/education-and-child-care-facility-administration/services-for-school-administrators/qualified-independent-schools.
———. “Registered Independent Schools Regulations.” Pub. L. No. Chapter E-0.2 Reg 27 (2018). https://publications.saskatchewan.ca/api/v1/products/91108/formats/107986/download.
Shakeel, M.D., and P. Wolf. “Does Private Islamic Schooling Promote Terrorism? An Analysis of the Educational Background of Successful American Homegrown Terrorists.” EDRE Working Paper No. 2017-20 (2017). https://papers.ssrn.com/sol3/papers.cfm?abstract_id=3068968.
Shapiro, B.J. “The Report of The Commission on Private Schools in Ontario.” Government of Ontario, October 1985. https://archive.org/details/reportofprivschools00comm.
Statistics Canada. “2011 National Household Survey, Statistics Canada Catalogue no. 99-010-X2011032.” https://www12.statcan.gc.ca/nhs-enm/2011/dp-pd/dt-td/Rp-eng.cfm?LANG=E&APATH=3&DETAIL=0&DIM=0&FL=A&FREE=0&GC=0&GID=0&GK=0&GRP=0&PID=105399&PRID=0&PTYPE=105277&S=0&SHOWALL=0&SUB=0&Temporal=2013&THEME=95&VID=0.
———. “Table 10-10-0024-01: Canadian Classification of Functions of Government, by General Government Component (x 1,000,000).” 2021. https://www150.statcan.gc.ca/t1/tbl1/en/tv.action?pid=1010002401.
———. “Table 36-10-0487-01: Gross Domestic Product (GDP) at Basic Prices, by Sector and Industry, Provincial and Territorial (x 1,000,000).” 2021. https://www150.statcan.gc.ca/t1/tbl1/en/tv.action?pid=3610048701.
———. “Table 37-10-0065-01: School Board Expenditures (x 1,000).” 2021. https://www150.statcan.gc.ca/t1/tbl1/en/tv.action?pid=3710006501.
———. “Table 37-10-0109-01: Number of Students in Elementary and Secondary Schools, by School Type and Program Type.” 2021. https://www150.statcan.gc.ca/t1/tbl1/en/tv.action?pid=3710010901.
Tiebout, C.M. “A Pure Theory of Local Expenditures.” Journal of Political Economy 64, no. 5 (1956): 416–24.
Truth and Reconciliation Commission of Canada. “Calls to Action.” Government of Canada, 2015. https://www2.gov.bc.ca/assets/gov/british-columbians-our-governments/indigenous-people/aboriginal-peoples-documents/calls_to_action_english2.pdf.
United Nations General Assembly. “The Universal Declaration of Human Rights.” 1948.
Van Pelt, D. “Qualified Independent Schools in Saskatchewan: An Examination of a Recent Policy Change for a New Category of Funded Independent Schools.” Cardus, September 2018. https://www.cardus.ca/research/education/reports/qualified-independent-schoolsin-saskatchewan/.
Van Pelt, D., D. Hunt, and J. Wolfert. “Who Chooses Ontario Independent Schools and Why?” Cardus, September 2019. https://www.cardus.ca/research/education/reports/whochooses-ontario-independent-schools-and-why/.
Van Pelt, D., M. Palacios, and T. Jackson. “Financial Savings: Restructuring Education in Ontario Using the British Columbia Model.” Fraser Institute, September 2014. https://www.fraserinstitute.org/sites/default/files/financial-savings-restructuring-education-inontario-using-the-british-columbia-model.pdf.
Van Pelt, D., R. Pennings, and T. Jackson. “Funding Fairness for Students in Ontario with Special Education Needs.” Cardus, March 2019. https://www.cardus.ca/research/education/reports/funding-fairness-for-students-in-ontario-with-special-educationneeds/.
Van Pelt, D., S. Hasan, and D. Allison. “The Funding and Regulation of Independent Schools in Canada.” Fraser Institute, October 2017. https://www.fraserinstitute.org/sites/default/files/funding-and-regulation-of-independent-schools-in-canada.pdf.
Wagner, M. “Charter Schools in Alberta: Change or Continuity in Progressive Conservative Education Policy?” Alberta Journal of Educational Research 45, no. 1 (1999): 52–66. https://journalhosting.ucalgary.ca/index.php/ajer/article/view/54626.
Wöbmann, L., E. Lüdemann, G. Schütz, and M.R. West. “School Accountability, Autonomy, Choice, and the Level of Student Achievement: International Evidence from PISA 2003.” OECD Education Working Papers 13 (2007): 53–57. doi:10.1787/246402531617.
Woessmann, L. “The Importance of School Systems: Evidence from International Differences in Student Achievement.” Journal of Economic Perspectives 30 (2016): 3–31. http://dx.doi.org/10.1257/jep.30.3.3.
———. “Why Students in Some Countries Do Better: International Evidence on the Importance of Education Policy.” Education Matters 1, no. 2 (2001): 67–74. https://www.educationnext.org/whystudentsinsomecountriesdobetter/.
Woessmann, L., E. Luedemann, G. Schuetz, and M.R. West. School Accountability, Autonomy and Choice Around the World. Cheltenham, UK: Edward Elgar, 2009.
Wolf, P.J., and A.J. Egalite. “Pursuing Innovation: How Can Educational Choice Transform K–12 Education in the U.S.?” Friedman Foundation for Educational Choice, April 2016.
http://www.edchoice.org/wp-content/uploads/2016/05/2016-4-Pursuing-InnovationWEB-1.pdf.