
Table of Contents
Table of Contents
Acknowledgments
The authors wish to thank Derek Allison, Sazid Hasan, and Amanda Dervaitis, who reviewed an earlier draft of this report and provided valuable suggestions and advice.
Executive Summary
What are independent schools? This study introduces a new typology to describe Ontario’s independent schools, and uses this typology to aggregate the school-level data and chart the landscape of independent schools in the province as of 2022.
We had three motivations in conducting this study. First, there is no accepted or widely used typology of independent schools. Second, independent schools are poorly understood in Ontario, which leads to misinformed public narratives and affects public policy. And third, the sector has grown considerably in recent years. Despite dozens of independent schools closing each year, the number of independent schools in Ontario has increased by at least 51.5 percent since the last (and only) study of this kind was conducted—from 954 in 2013–14 to at least 1,445 as of July 2022.
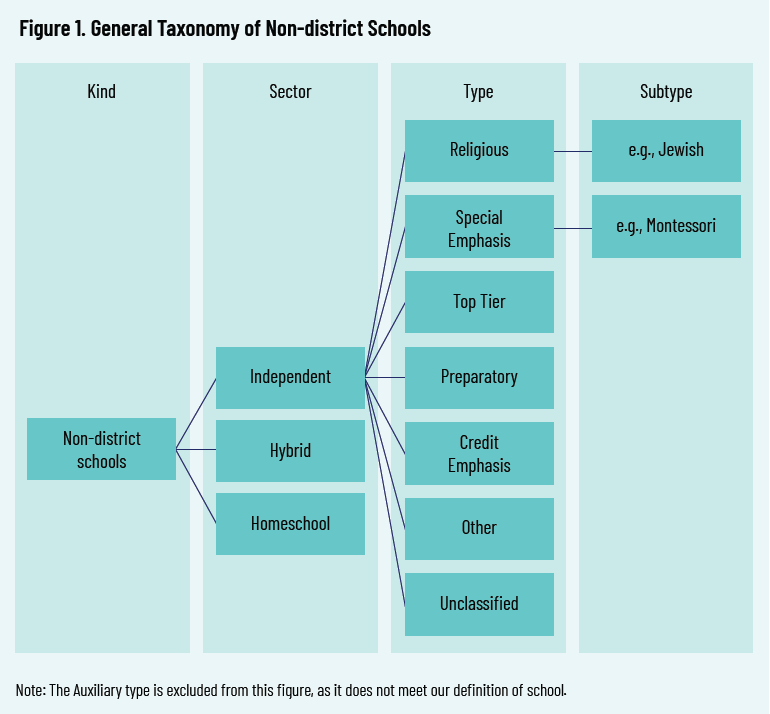
Applying a framework analysis approach, we researched each institution included in the Ontario Ministry of Education’s Open Data Catalogue list of independent schools to develop a typology. We defined six distinct types of independent schools: Religious, Special Emphasis (e.g., Montessori, STEM, Arts), Top Tier (member of an elite school association), Preparatory, Credit Emphasis, and Other. We analyzed, coded, and aggregated 1,445 schools according to these types. We excluded from our analysis two additional categories, Unclassified and Auxiliary. In addition to school type, we explored schools’ different approaches to educational delivery, accreditation and school-association membership, geographic location, and additional variables like school size.
The significant growth in the independent-school sector cannot be attributed to Top Tier schools. Not only are a mere 61 of 1,445 independent schools—4.2 percent—Top Tier schools, but in the time—2019–20 to 2022–23—that one new Top Tier school has opened, 141 net new Credit Emphasis schools, 131 net new Special Emphasis, 32 net new Religious, and three net new Preparatory schools have emerged.
Ontario’s independent-school landscape is robust in its diversity. Special Emphasis schools, for instance, accommodate an immense variety of pedagogical approaches, educational philosophies, lifestyle decisions such as high-performance sport training, neurodiverse learning styles, and other non-traditional learning opportunities.
Independent schools serve a diverse set of students and needs that district schools do not or cannot, given that district schools exist to provide universal education. Pluralism in education contributes to the common good. An increasing number of Ontario families are enrolling their children in independent schools, and their reasons for doing so vary. We hope that our research will encourage Ministry of Education officials, policy-makers, researchers, and the general public to better understand these varied motivations, needs, and purposes of the families and the schools that make up this innovative and growing sector.
Introduction
Over the past twenty years, enrolment in Ontario’s independent schools has increased from 4.1 percent of total K–12 provincial enrolment to 7 percent. 1 1 Enrolment grew from 90,600 students in 1998–99 to 154,638 students in 2019–20. Statistics Canada, “Table 37-10-0109-01: Number of Students in Elementary and Secondary Schools, by School Type and Program Type,” April 2022, https://www150.statcan.gc.ca/t1/tbl1/en/tv.action?pid=3710010901. Many Ontarians, however, remain largely unfamiliar with the independent-school sector, and this unfamiliarity affects both the public narrative and public policy. The common assumption is that independent schools are elite institutions that serve wealthy families, typically in urban settings. In this report we demonstrate, however, that the sector as a whole reveals great heterogeneity.
In addition to understanding the growth and diversity of independent schools, the third motivation for conducting this study was to develop a typology of these schools in Ontario. In conducting this research we were inspired by earlier work by Derek J. Allison, Sazid Hasan, and Deani Van Pelt, who developed a typology to chart the independent-school landscape across Canada, using data from the 2013–14 academic year. 2 2 D.J. Allison, S. Hasan, and D. Van Pelt. “A Diverse Landscape: Independent Schools in Canada,” Fraser Institute, June 2016, https://www.fraserinstitute.org/studies/a-diverse-landscape-independent-schools-in-canada. Our research seeks to build on this earlier study, but we focus solely on Ontario.
What types and subtypes of independent schools make up the sector? What is the purpose of these schools? How do they differentiate themselves? In other words, what is the nature of independent schools, and why do they exist? These are the core questions this study explores. In addition, we will examine where they are located, how they deliver their education, and other key factors that define Ontario’s independent-school landscape.
Research Method
We applied a framework analysis methodology to design and apply our typology of schools. Although typically used in the field of health care, this methodology has been used in education research and for assessing website content. It involves a five-stage process: familiarization, thematic-framework identification, indexing, charting, and mapping and interpretation. The process is both a logical and intuitive one, involving judgments about meaning. 3 3 J. Ritchie and L. Spencer, “Qualitative Data Analysis for Applied Research Policy,” in Analyzing Qualitative Data, ed. A. Bryman and R.G. Burgess (London: Routledge, 1994), 173–94, as cited in A. Srivastava and S.B. Thomson, “Framework Analysis: A Qualitative Methodology for Applied Policy Research,” Journal of Administration and Governance 4, no. 2 (2009): 72–79.
To collect and familiarize ourselves with the data, we used the most recent publicly available list of schools available at the time of writing (April 2022) from the Open Data Catalogue, and then cross-checked it against the most recent list of school closures available at the time of writing (July 2022). 4 4 Ontario Ministry of Education, “Private School Contact Information,” Government of Ontario, April 2022, https://data.ontario.ca/dataset/private-school-contact-information; Ontario Ministry of Education, “Private Schools That Have Closed,” Government of Ontario, July 2022, https://www.ontario.ca/page/private-schools-have-closed. In the second step, we began identifying and coding for emerging themes, based on information about the schools that was included in the catalogue. Once we had a provisional set of themes and definitions of each, the indexing step involved visiting school websites, social-media profiles, publicly accessible school-association membership listings, and performing other search-engine queries in order to further develop, refine, and test categories and assign schools to them. School addresses were entered into Google Maps (or equivalent) to identify a school’s location and confirm its existence. For 1,389 (88.1 percent) schools in the catalogue, this process provided sufficient information for our purposes. For 187 schools (11.9 percent) for which no information was available online, the street-address search was the only source of data outside of the Open Data Catalogue entry. Of these, we could confidently identify 153 as parochial or Mennonite schools, but we could not make a judgment about the remaining 34 schools and therefore labelled them “unclassified.”
The third step, indexing, was done by each researcher working and coding alone from the set of categories and definitions that had been provisionally agreed on by that point. As we each progressed, we added or removed types and subtypes from the set. At stage four, charting, two of the three researchers went back through each type, debating its relevance, attributes, and alignment with the literature, with the goal of seeking intercoder agreement (that is, each coder assigning the same codes to the same items), to gauge and help strengthen the reliability of our typing and coding. This step is perhaps the most contentious issue with published research findings in general and qualitative research in particular. 5 5 J.P.A. Ioannidis, “Why Most Published Research Findings Are False,” PLoS Medicine 2, no. 8, e124 (2005): 696–701; C. Geisler and J. Swarts, “Achieving Reliability,” in Coding Streams of Language (WAC Clearinghouse; Boulder: University Press of Colorado, 2019), 156, https://doi.org/10.37514/PRA-B.2019.0230. We attempted to achieve definitions that are precise and objective enough to be replicable but also flexible enough to capture the extraordinary diversity of the sector and the uniqueness of individual schools. 6 6 Geisler and Swarts, “Achieving Reliability,” 152, 160, 202. We did this fourth stage collaboratively, performing repeated rounds of data analysis on each type and subtype, and on each school assigned multiple types. Where we disagreed we refined our typology until its coding application resulted in agreement at least 95 percent of the time. For the remaining few schools, one of us made the final decision.
After coding for the entire data set, the last step was mapping and interpretation. At this stage, we wrote the final draft of our typology, aggregated schools according to our final set of types and subtypes, and performed data analysis through frequency reporting and cross-tabulation. We performed crosstab analyses in select instances to better understand the characteristics and distribution of schools in the sector, such as comparison of school type by school size.
Limitations
The primary limitation of this study is its reliance on self-reported information, presented in the Open Data Catalogue and on school websites, social media, and elsewhere. These latter media serve an important marketing purpose and, to that end, may express a school’s goals and aspirations more than its current reality, or may otherwise misrepresent important elements. We sought to mitigate this limitation in four ways. (1) Our framework-analysis approach ensured multiple touchpoints and perspectives of the data. (2) We wrote our types and subtypes to be as specific and objective as possible. (3) We sought to identify not merely surface characteristics but the underlying evidence for placement in the various types and subtypes. This required deep familiarity with the sector. And (4) we controlled our interpretive data analysis through intercoder reliability, feedback, and subsequent adjustment.
A second limitation is that in visiting each school’s website and other online assets, we relied on what accumulates to thousands of data sources. It is possible that we missed some features of some schools or miscategorized some schools purely due to researcher error.
Typology
This research focuses on the independent-school sector. We define this sector as those independent schools (also referred to as private schools) in Ontario that are not district schools (also referred to as public, government, or separate schools).
Defining Independent Schools
To begin, we must define the term “independent school” for the purposes of this project. We start from the definition given in the province’s Education Act of 1990: “‘Private school’ means an institution at which instruction is provided at any time between the hours of 9 a.m. and 4 p.m. on any school day for five or more pupils who are of or over compulsory school age in any of the subjects of the elementary or secondary school courses of study and that is not a public school as defined in this section.” 7 7 Education Act, R.S.O. 1990, c. E.2, https://www.ontario.ca/laws/statute/90e02. First, we adjust this definition to account for the fact that some schools, particularly online ones, may not provide instruction specifically within the 9:00 a.m. to 4:00 p.m. window. Then, following Allison, Hasan, and Van Pelt, we further describe independent schools as being distinct from other schools in four fundamental ways:
- Ownership and Operation. In Ontario, all independent schools are owned and operated independently of the government.
- Financing. Independent schools in Ontario are typically non-profit charities that are financed entirely by tuition fees and donations. District schools are almost entirely supported by tax dollars. No public funding is provided to independent schools in Ontario.
- Governance. Whereas district schools have publicly elected or appointed boards, independent schools are governed by boards that are accountable to the schools’ parents, donors, and others in its specific community of support.
- Purpose. District schools exist to provide an education that meets the needs of the province’s population as a whole. Within this population, however, some parents and their children have needs or desires that the universal system does not or cannot meet. Most independent schools therefore provide a more targeted school experience: one that offers a particular pedagogy or curriculum, integrates the education with a particular religious identity, or serves a particular type of student. Thus, Ontario’s independent schools typically provide a distinct form of education for which accessible alternatives are limited or do not exist.
School Types
In our view, no existing typology is robust enough to account for the diversity of the Ontario independent-school sector, and thus we devised our own. Consider the schemas developed by the Organisation for Economic Co-operation and Development (OECD), an international body, and the National Center for Education Statistics in the United States. The OECD classifies independent schools into one of three types according to their governance and funding: government-dependent private schools (which receive 50 percent or more of their core funding from government sources or their teaching staff are paid by government sources), independent private schools (less than 50 percent of core funding from government and their teaching staff are not paid by government), and homeschooling. 8 8 Organisation for Economic Co-operation and Development (OECD), “Public and Private Stakeholders,” OECD Education GPS, 2021, https://gpseducation.oecd.org/revieweducationpolicies/. The National Center for Education Statistics assigns independent schools to one of three major categories (Catholic, other religious, or non-sectarian), and one of seven program emphases that best describe the school—namely, early childhood, Montessori, special program emphasis (e.g., STEM, arts, foreign language immersion), special education, technical/vocational, regular, and alternative (i.e., non-traditional education that falls outside the categories of regular, special program emphasis, special education, or vocational school). Of note, the National Center for Education Statistics deliberately does not define “regular” independent schools. 9 9 S.P. Broughman et al., “Characteristics of Private Schools in the United States: Results From the 2019–20 Private School Universe Survey,” Institute of Education Sciences, September 2021, A2–A3, https://nces.ed.gov/pubs2021/2021061.pdf. Could it be that “regular independent school” is an oxymoron? Or, at a minimum, undefinable? We explore this in our research.
Finally, Scott Davies and Roger Pizarro Milian place 286 Toronto independent schools into four categories based on market segments: Elite, Religious, International, and New Sector. 10 10 R. Pizarro Milian and S. Davies, “Open Competition or Balkanized Coexistence? The Effects of Market Segments on Toronto Private Schools,” Education Policy Analysis Archives 25, no. 39 (2017): 8, http://dx.doi.org/10.14507/epaa.25.2687. In this case, the narrow scope of the study (conducted only on Toronto-based schools) as well as the generation of broad categories based on market characteristics did not fully serve our descriptive purposes.
Allison, Hasan, and Van Pelt identified three types of independent schools: religious orientation, specialty emphasis, and traditional full-program. The researchers concluded that this last type required investigation beyond the scope of their study, so within that third category, only Canadian Accredited Independent Schools (CAIS) were identified. Although Allison, Hasan, and Van Pelt’s typology accounted for 85 percent of the independent schools in Ontario, we were unsatisfied with a typology that left 15 percent of schools unaccounted for. 11 11 In 2013–14, there were 457 religious, 315 specialty, and 37 CAIS schools out of 954 independent schools in Ontario—leaving 145 unaccounted for. We strove for a typology that encompassed the entire sector. Moreover, we concluded that the nature of the sector was such that a typology that permitted the possibility of multi-type schools would be more useful and revelatory than one that did not.
Thus we categorized all schools listed in the Open Data Catalogue into one of six types that we believe best describe the school’s nature and purpose, and two additional types for schools that we removed from our analysis (figure 1). Information concerning nature and purpose was collected from each school’s website, from any description provided by the organizations it was a member of, and from other reports and descriptions discovered through web searches. Most of the pertinent information was collected from the website sections titled “Home,” “About,” “Mission,” or similar. For the large majority, the school type was readily evident. For some, we identified more than one type (e.g., Islamic Montessori). For these multi-type schools, we classified a primary, secondary, and in a few cases a tertiary type. Again, these schools’ primary purpose was usually readily evident, but in a very small minority of instances, judgment calls were ultimately made. For example, is the purpose of a hypothetical Islamic Montessori school to provide an Islamic education via the Montessori method, or is it a Montessori school that incorporates the Islamic faith (or some aspect of the Islamic religion or culture)? The former we would code as Religious (primary type), Islamic (subtype), Special Emphasis (secondary type), Montessori (subtype). The latter we would code as Special Emphasis (primary type), Montessori (subtype), Religious (secondary type), Islamic (subtype). In each instance, this took considerable investigation, but using the school’s own mission statement, vision statement, core values statement, program and course offerings, history, and/or other purpose-identifying factors, we attempted to make such distinctions.
1. Religious
We define a religious independent school as one having a primarily religious identity, purpose, or formal affiliation that is clearly stated or emphasized in the school’s mission statement, name, or in the About, Educational Philosophy, or similar section of the school’s website. Our definition is consistent with the Private School Universe Survey conducted by the National Center for Education Statistics in the United States, which categorizes independent schools as either Catholic or Other Religious if they have either a religious orientation (or purpose) or an affiliation with a religious organization or institution. 12 12 Broughman et al., “Characteristics of Private Schools in the United States,” A5.
If the school described itself as having a religious connection, or founding, or heritage, but did not meet the criteria of the paragraph above, we assigned another type as its primary type, and we assigned Religious as its secondary or tertiary type.
2. Special Emphasis
Consistent with Allison, Hasan, and Van Pelt that built off the National Center for Education Statistics typology, the Special Emphasis type is defined as a school that serves a specific student population (e.g., special needs), or offers a particular curricular emphasis (e.g., music), or operates with a distinct educational philosophy or pedagogical approach (e.g., Waldorf). The special emphasis is clearly stated or emphasized in the school’s mission statement, name, or in the About, Educational Philosophy, or similar section of the school’s website. The special emphasis is not an optional track or appendage to the school’s overall identity but appears to be a core purpose for the school’s existence.
If we judged a special emphasis to exist but not as the school’s primary purpose or identity, we assigned another type as the school’s primary type, and we assigned Special Emphasis as a secondary or tertiary type.
3. Top Tier
Top Tier is the name we have given to those schools commonly thought of as “elite,” with competitive admissions policies, high academic standards, excellent facilities, and tuition rates that are significantly higher than–i.e. at least double–that typically found in other independent-school types. Although we believe that the “top” school for each student is the one that is the best fit for them, we use the term Top Tier for this type, as it is a better descriptor of the school than elite.
Allison, Hasan, and Van Pelt used membership in the CAIS association as a proxy for inclusion in this type, but we believe this definition is too narrow. Our criterion is that the school has official recognition as a member, affiliate, or candidate in at least one of the five independent-school associations that are generally viewed as most prestigious: CAIS, Conference of Independent Schools of Ontario, The Association of Boarding Schools, International (formerly: National) Coalition of Girls’ Schools, and National Association of Independent Schools.
If the school met the Top Tier criteria but we judged that this was not its primary purpose or identity, we assigned another type as its primary type and Top Tier as its secondary or tertiary type.
4. Preparatory
We typed as Preparatory those schools that operate conventional models of schooling but whose primary identity is not Religious, Special Emphasis, Top Tier, or Credit Emphasis. Although “preparatory” language was not a requirement for us in the coding process, we used this term because all these schools presented themselves as university preparatory schools. They emphasize academics, preparation for university, or university placement. We recognize that many of the schools we placed in the four aforementioned categories may be emphasizing and preparing their students for post-secondary education to the same or even greater degree, but we believe a category is needed for preparatory schools that are neither Top Tier nor Credit Emphasis. These schools typically operate in more modest facilities than the typical district schools, but they seek to attract students by the quality of instruction.
Due to the nature of the above criteria, we did not apply secondary or tertiary typing to any Preparatory schools.
5. Credit Emphasis
We typed as Credit Emphasis those schools that emphasize offering credits toward the Ontario Secondary School Diploma (OSSD) in such a way or to such an extent that we judged this to be the school’s primary purpose or identity. 13 13 In Ontario, independent schools are not required to offer credits toward the OSSD. While many do, this is not the primary purpose of the large majority of independent schools. The acquisition of credits toward the OSSD is clearly emphasized on the school’s home page, About, Purpose, or similar section of the school’s website. To our knowledge, no other study has identified these schools as a specific type within a typology, and little research exists about them. From the evidence we reviewed, some schools of this type are legitimate institutions providing a good quality of education. Some of them may offer accredited credit-recovery programs, serve vulnerable populations, and meet otherwise unmet needs, thus making an important contribution to society. 14 14 For an overview of the various types of credit-emphasis schools that exist elsewhere, E.A. Smith, “Failing the Failed: A Treatise on the Need for a Research Based Pedagogical Approach to Credit Recovery” (PhD diss., University of Central Florida, 2014), https://stars.library.ucf.edu/etd/6674. For others, however, we have questions regarding motives and quality. 15 15 More than a decade ago, credit mills were described as “a growing problem in Ontario where private schools are essentially handing out credits and grades for a fee.” See J. Yang, “Star Investigation: Slacking Off Gets High Marks at This ‘High School,’” Toronto Star, September 16,2011, https://www.thestar.com/news/gta/2011/09/16/star_investigation_slacking_off_gets_high_marks_at_this_high_school.html; see also P. Glinos, “Historical Analysis of School Choice in Ontario: Freedom and Inequality,” Encounters in Theory and History of Education 22 (2021): 170, https://doi.org/10.24908/encounters.v22i0.15072. We did not seek to distinguish “legitimate” from “illegitimate” Credit Emphasis schools, as the examination of their financial and procedural operations, and quality of education, were beyond the scope of this study. We recognize, however, that it is not ideal to lump “legitimate” and “illegitimate” schools together. Especially in light of the concerns about the Ministry’s ability to ensure credit validity raised by the auditor general’s 2013 report on private schools in Ontario, 16 16 Office of the Auditor General of Ontario, “Private Schools,” Annual Report, Ministry of Education, 2013, https://www.auditor.on.ca/en/content/annualreports/arreports/en13/306en13.pdf. we assert that further research is essential to better understand this school type.
Many, but not all, schools that we typed as Credit Emphasis focus their recruitment on international students. Having judged that Credit Emphasis was their primary purpose or identity, however, we did not categorize these schools’ primary type as Special Emphasis, subtype International.
If we judged a credit emphasis to exist but not as the school’s primary purpose or identity, we assigned another type as the school’s primary type, and we assigned Credit Emphasis as a secondary or tertiary type.
6. Other
We typed as Other those schools for which we could obtain information beyond their listing in the Open Data Catalogue but that exist for a purpose other than the five purposes described above. Only three schools matched this type.
Due to the nature of the above criterion, we did not apply secondary or tertiary typing to Other schools.
7. Unclassified
We typed as Unclassified the thirty-four schools listed in the Open Data Catalogue but for which we could not obtain any or enough information to place within a type.
Due to the nature of the above criterion, we did not apply secondary or tertiary typing to Unclassified schools.
8. Auxiliary
We typed as Auxiliary any listing in the Open Data Catalogue that does not fit the definition of independent school that we are using. Most of them are school-adjacent programs. Examples include tutoring services, after-school programs, daycares, and summer camps. Others are focused on adult education. Although such programs may be offered by schools, we have excluded all sixty-two listings from our analysis whose only purpose is its auxiliary service(s).
Subtypes
Within the Religious and Special Emphasis types, further categorization illuminated a variety of subtypes within them.
Religious Subtypes
- Adventist (Christian). A self-identified or formal association with the Seventh-day Adventist tradition of the Christian faith.
- Anglican (Christian). A self-identified or formal association with the Anglican tradition of the Christian faith.
- Baptist (Christian). A self-identified or formal association with the Baptist tradition of the Christian faith.
- Islamic. A self-identified or formal association with the Islamic faith.
- Jewish. A self-identified or formal association with the Jewish faith.
- Mennonite (Christian) and/or Parochial. Parochial and/or an identity or formal association with the Mennonite, Orthodox Mennonite, Old Colony Christian, Amish, or a similar tradition within the Christian faith. Note that it is possible that a given parochial independent school is not religious. Given limited available information, and since almost all parochial schools were identified as some form of Christian, we opted to merge all parochial independent schools into this subtype with the various Mennonite traditions.
- Non-denominational Christian. Self-identified with the Christian faith but without reference to any particular denomination, diocese, or sect. The great majority of these schools are evangelical, and many are members of Edvance Christian Schools Association or the Association of Christian Schools International. Note that many of the Edvance schools are historically Reformed, but we did not type historically Reformed schools as “Reformed (Christian)” unless there is a current, direct affiliation.
- Reformed (Christian). A self-identified or formal association with the Reformed tradition of the Christian faith.
- Roman Catholic. A self-identified or formal association with the Roman Catholic Church of the Christian faith.
- Other Christian. A self-identified or formal association with a particular denomination, diocese, or sect not included above, within the Christian faith (e.g., Ukrainian Orthodox, Pentecostal).
- Other Religion. A self-identified or formal association with a religion or faith tradition that is not Christian, Islamic, or Jewish and not included above (e.g., Khalsa [Sikh] schools, Hindu, Bahá’í, interfaith).
Special Emphasis Subtypes
We initially identified over four dozen special emphases. We then reduced them to a smaller set—for example, we grouped French-only, bilingual, other language immersion, and cultural immersion schools into one subtype named Language/Culture. We also restricted our subtypes to those having at least ten schools. The few special emphases that we could not reduce into a smaller set of subtypes, or that had fewer than ten schools, we coded as Other Special Emphasis. Although we attempted to define our subtypes so that any given school fit only one, some schools are genuinely multi-emphasis and thus fall under more than one subtype (e.g., a French Montessori school). The resulting twenty-one subtypes are presented below, with reference to the literature that we used to develop this framework.
In some cases we judged that a Special Emphasis school belonged in more than one subtype equally. Consider the hypothetical case of an all-boys hockey school. Would this school be best typed as Sports or as Boys-Only? How about a Distributed-Learning Nature school? We imagine that interviewing principals, for example, could reveal a similar primary-secondary-tertiary subtype hierarchy as the one we employed for school types, but this was beyond our methodological scope. In all, we coded multiple subtypes (e.g., Montessori Reggio Emilia) for 161 Special Emphasis schools. 17 17 Of 593 schools, 432 have one special emphasis, 136 have two special emphases, 23 have three special emphases, and 2 have four special emphases.
- Arts. These schools offer a fine-arts emphasis. 18 18 C.J. Stufft, “Reading to the Rhythm: Integrating Music into Literacy Instruction,” English in Texas 45, no. 1 (2015): 21–26; K. Walker, “Fine Arts Education,” Research Brief, Education Partnerships, January 3, 2006, https://files.eric.ed.gov/fulltext/ED537918.pdf.
- Boys/Girls Only. These schools admit only boys or only girls, typically for the purpose of providing an education targeted to the learning styles and developmental needs of the particular sex. 19 19 A.G. Bowe et al., “Urban Elementary Single-Sex Math Classrooms: Mitigating Stereotype Threat for African American Girls,” Urban Education 52, no. 3 (2017), 370–98, https://doi.org/10.1177/0042085915574521; A. Jacobson et al., “Single-Sex Education: A Public Policy Issue,” Project Report, Center for Advanced Study in Education, 1995, https://files.eric.ed.gov/fulltext/ED395545.pdf.
- Classical. Rooted in the classical liberal arts tradition, these schools focus on the habits of thought through what Dorothy Sayers called “the lost tools of learning,” the trivium (grammar, dialectic, and rhetoric) and quadrivium (arithmetic, geometry, astronomy, and music), or an interdisciplinary study of the great books (the “classics”) through the ages. Latin is typically offered as a core element of the curriculum. 20 20 D. Sayers, “The Lost Tools of Learning,” Hibbert Journal: A Quarterly Review of Religion, Theology, and Philosophy 46 (1948); K.W. Clark and R.S. Jain, The Liberal Arts Tradition: A Philosophy of Christian Classical Education (Camp Hill, PA: Classical Academic Press, 2013); S.W. Bauer, “What Is Classical Education?,” Well-Trained Mind, June 3, 2009, https://welltrainedmind.com/a/classical-education/.
- Distributed Learning. These schools offer a non-traditional model of education delivery, such as homeschool partnerships, a hybrid of blended online and in-person offerings, distance learning, or a primarily remote- or home-based learning that is still connected to a teacher and school community. 21 21 D.L. Stirling, “Distributed Learning Environments,” December 8, 1997, http://www.stirlinglaw.com/deborah/DLE.htm; J.A. Converso, S.P. Schaffer, and I.J. Guerra, “Distributed Learning Environment: Major Functions, Implementation, and Continuous Improvement,” Learning Systems Institute, Florida State University, October 1999, 17.
- Experiential Learning. These schools adopt a philosophy of education that roots learning within experience, contrasted with traditional models that emphasize concepts and memorization. It focuses on exploratory, play-based, and/or place-based learning, and posits that children benefit from kinesthetic development. In upper elementary and secondary schools, experiential learning can include co-op placements, real-world business and research applications in project-based learning, or travel experiences. We have applied this subtype only when other experiential emphases do not apply. For example, we have not placed Montessori, Waldorf, Nature, Sports, or Arts schools in this subtype 22 22 J.S. Coker et al., “Impacts of Experiential Learning Depth and Breadth on Student Outcomes,” Journal of Experiential Education 40, no. 1 (2017): 5–23, https://doi.org/10.1177/1053825916678265; P. Hernández-Ramos and S. De La Paz, “Learning History in Middle School by Designing Multimedia in a Project-Based Learning Experience,” Journal of Research on Technology in Education 42, no. 2 (2009): 151–73, https://doi.org/10.1080/15391523.2009.10782545; H.A. Hadim and S.K. Esche, “Enhancing the Engineering Curriculum through Project-Based Learning” (paper presented at the 32nd Annual Frontiers in Education Conference, Boston, MA: IEEE, November 6–9, 2002), https://doi.org/10.1109/FIE.2002.1158200.
- First Nation. These schools emphasize Indigenous culture and/or language and are typically located on a reserve. Most receive federal funding but are governed by independent boards. We also included unfunded schools whose core emphasis was Indigenous. Previous studies have excluded federally funded schools from the Ontario independent-school landscape, but we have included them, as they are governed by independent boards and are listed as private schools in the Open Data Catalogue. 23 23 Ontario Public School Boards’ Association, “Indigenous Education,” in Guide to Good Governance 2018–2022, 92–99, https://www.opsba.org/wp-content/uploads/2021/02/OPSBA_Good_Governance_Guide_2018-2022_Chapter6.pdf.
- Holistic. These schools emphasize the integration and development of a child’s physical, emotional, psychological, moral, and spiritual capacities. We classified schools as Holistic if they showed evidence of at least two of the following principles that these schools claim as their defining features: (1) a recognition and discovery of the interconnectedness of all life on earth, (2) the integration into learning of a sense of the sacred and the wonder of the natural world, and (3) the provision of education focused on the whole child: body, mind, and spirit. A recent extension of holistic education is social and emotional learning. 24 24 D. Toprani, M. Borge, and Y. Xia, “Supporting SEL in Progressive Design Contexts” (paper presented at the 13th International Conference of the Learning Sciences, London, UK: June 23–27, 2018): 1573–74, https://repository.isls.org/bitstream/1/740/1/399.pdf. We have not included Waldorf or Special Education schools in this subtype. 25 25 American University School of Education, “What Is Holistic Education? Understanding the History, Methods, and Benefits,” May 13, 2020; F. Arrows and J.P. Miller, “To Name the World: A Dialogue on Holistic and Indigenous Education,” ENCOUNTER: Education for Meaning and Social Justice 25, no. 3 (2012): 2. https://soeonline.american.edu/blog/what-is-holistic-education/.
- International Baccalaureate and Advanced Placement (IB/AP). International Baccalaureate schools are accredited for one or more of the IB programs: Primary Years, Middle Years, Diploma, or Career-Related. IB World schools offer internationally recognized academic programs that promote cultural awareness, second-language learning, critical thinking, and global problem solving. If a school was identified as IB-accredited on the association’s website, we coded it both as a Special Emphasis type and under “School Associations.” If a school self-reported an IB-integrated curriculum but was not listed as accredited on the association’s website, we included it under the Special Emphasis type only. It is important to note that this subtype includes schools that offer IB as their only program of study and schools that offer it as one of their programs. This is one of the judgment calls that we made in order to reduce the overall number of subtypes.
We also included here schools that offer university-level courses through the Advanced Placement program, which is governed by the College Board. Advanced Placement programs offer a head start and increased access to American post-secondary institutions. 26 26 International Baccalaureate, “International Education,” https://www.ibo.org/; College Board, “AP Program,” https://ap.collegeboard.org/. We feel ambivalent about combining IB and AP into one subtype. Future research might make other beneficial distinctions.
- Individualized. These schools adhere to a philosophy of personalized education, in which they tailor learning experiences to each student’s needs. They typically develop differentiated learning plans and provide students the opportunity to make personal decisions about their learning. Specific curricular approaches can include Universal Design for Learning, digital management of learning, and others. Most if not all Special Education schools also fit the definition of Individualized, as do most Montessori and Micro Schools. Those subtypes are excluded from the Individualized count. 27 27 S. Patrick, K. Kennedy, and A. Powell, “Mean What You Say: Defining and Integrating Personalized, Blended and Competency Education,” International Association for K–12 Online Learning, 2013, 37, https://files.eric.ed.gov/fulltext/ED561301.pdf; J.D. Basham et al., “An Operationalized Understanding of Personalized Learning,” Journal of Special Education Technology 31, no. 3 (2016): 126–36, https://doi.org/10.1177/0162643416660835.
- International. This subtype includes schools with either an international or a global emphasis, and excludes IB/AP schools. International schools are defined primarily in terms of student body and target audience (i.e., enrolling non-domestic students). These schools’ websites typically refer to visa requirements and have portions of their site in a language other than English. Global schools “[aim] to empower learners of all ages to assume active roles, both locally and globally, in building more peaceful, tolerant, inclusive, and secure societies.” 28 28 UNESCO, “What Is Global Citizenship Education?,” January 9, 2018, https://en.unesco.org/themes/gced/definition. Global schools may provide a globally focused curriculum, and their mission often specifies ideas of “global citizenship” or “world school.” 29 29 E. Moizumi, “Examining Two Elementary-Intermediate Teachers’ Understandings and Pedagogical Practices About Global Citizenship Education,” Ontario Institute for Studies in Education, University of Toronto, 2010, https://central.bac-lac.gc.ca/.item?id=MR72914&op=pdf&app=Library&oclc_number=1019483268; J. Duarte and C. Robinson-Jones, “Bridging Theory and Practice: Conceptualisations of Global Citizenship Education in Dutch Secondary Education,” Globalisation, Societies and Education (March 6, 2022): 1–17, https://doi.org/10.1080/14767724.2022.2048800. Some global schools calls themselves “international.” Many independent schools have an international or student-exchange program, and many recruit international students, but we applied the International special emphasis only if the global focus or international student body was a core emphasis. Many schools in this subtype fit both definitions: international and global. This fact, and our felt need to limit the number of subtypes, is the reason that we have combined these two into this International subtype.
- Language/Culture. This subtype encompasses language- or culture-immersion (e.g., Mandarin), French-only, and bilingual education. Bilingual schools provide dual language learning, either offering curriculum taught in two languages (e.g., in a 50-50 ratio) or through immersion in a second language. In Ontario, the majority of bilingual schools provide instruction in English and French. French schools may be governed by the Agency for French Education Abroad, under France’s Ministry of Foreign Affairs. 30 30 R.L. Oxford and C. Gkonou, “Interwoven: Culture, Language, and Learning Strategies,” Studies in Second Language Learning and Teaching 8, no. 2 (2018): 403–26, https://doi.org/10.14746/ssllt.2018.8.2.10. Although these latter, of which there are just four in Ontario, have a distinct curriculum, we included them in this subtype, to contain the number of categories.
- Micro School. These schools provide education that envisions a “one-room schoolhouse” type of setting, in which there are multi-age classrooms, small class sizes, and individualized learning. Typically, these schools offer flexibility and innovation in learning in an intimate, community-based environment. 31 31 A. Dervaitis, “Micro Schools: The Wave of the Future,” Our Kids, https://www.ourkids.net/school/micro-schools; J. Bedrick and M. Ladner, “Let’s Get Small: Microschools, Pandemic Pods, and the Future of Education in America,” Backgrounder, Heritage Foundation, 2020, 14, https://www.heritage.org/sites/default/files/2020-10/BG3540.pdf.
- Montessori. Rooted in the pedagogy of Maria Montessori, these schools offer an individualized approach to education that encourages children’s innate creativity and curiosity. Typically, Montessori schools focus on early and/or elementary education. While accredited Montessori schools complete a rigorous accreditation process with an accrediting body (e.g., the Canadian Council of Montessori Administrators), other schools may self-identify as Montessori without formal accreditation. Schools categorized as Montessori consist of both accredited and self-identified Montessori schools. 32 32 Canadian Council of Montessori Administrators, “CCMA Schools,” https://www.ccma.ca/ccma-schools/.
- Nature. Schools with a forest, nature-immersion, ecological or environmental, or outdoor emphasis were given the Nature classification. Forest schools typically offer half- to full-day education programs in natural spaces, in which the whole family—students, parents, even infants—is typically welcome to participate. Similar to the unschooling movement, nature-immersion programs are typically child-led programs. All of them are experiential or immersive education models that tend to be play- or inquiry-based. There is also often an Indigenous component. Increasingly, many schools now offer some outdoor or environmental education, but we only classified schools as Nature if this was a core emphasis. 33 33 E. Oberle et al., “Support Factors and Barriers for Outdoor Learning in Elementary Schools: A Systemic Perspective,” American Journal of Health Education 52, no. 5 (2021): 251–65, https://doi.org/10.1080/19325037.2021.1955232; S. Priest and M. Asfeldt, “The History of Outdoor Learning in Canada,” International Journal of the History of Sport 39, no. 5 (2022): 489–509; R. Louv, Last Child in the Woods: Saving Our Children from Nature-Deficit Disorder (Chapel Hill, NC: Algonquin Books, 2008).
- Reggio Emilia. Originating in Italy, this is a pedagogical philosophy that embraces the image of “the child equipped with 100 languages”—referring to the variety of ways that children learn. This pedagogy maintains a child-centred approach, emphasizing what it views as the rights of the child, and participatory, active learning. It places a strong emphasis on the inclusion of families and the professional development of educators. Typically, these schools focus on early and/or elementary education. 34 34 Reggio Emilia Approach, “Values,” 2022, https://www.reggiochildren.it/en/reggio-emilia-approach/valori-en/.
- Self-Directed Learning. This is a pedagogical approach that centres the student as the primary author of their learning. It involves learning at one’s own pace and emphasizes the use of technology in learning, with educators providing supervisory or tutoring support. 35 35 T. Timothy et al., “The Self-Directed Learning with Technology Scale (SDLTS) for Young Students: An Initial Development and Validation,” Computers & Education 55, no. 4 (2010): 1764–71, https://doi.org/10.1016/j.compedu.2010.08.001.
- Special Education. While schooling that is inclusive of neurodiverse learning has become the norm within Ontario schools generally, some schools exist to provide education that is tailored for students with special needs, neurodiversity, or giftedness. These may include specific curricular approaches such as Arrowsmith programming or the Orton-Gillingham method. We have not included Special Education schools under the Individualized or Holistic subtypes, or vice versa. 36 36 K. McCarty, “Full Inclusion: The Benefits and Disadvantages of Inclusive Schooling; An Overview,” Azusa Pacific University, 2006, 11, https://files.eric.ed.gov/fulltext/ED496074.pdf.
- Sports. These schools emphasize sports, physical education, or athletic development. Sports schools are not also counted as Individualized or Experiential. 37 37 M.A.F. Lounsbery and T.L. McKenzie, “Physically Literate and Physically Educated: A Rose by Any Other Name?,” Journal of Sport and Health Science 4, no. 2 (2015): 139–44, https://doi.org/10.1016/j.jshs.2015.02.002.
- STEM. These are schools with an emphasis on science, technology, engineering, and math. Typically, STEM education is directly linked to career preparation and the development of a workforce that is scientifically and technologically literate. It is rooted in a philosophy that places a high value on the ability of science and technology to solve complex, global problems. 38 38 National Research Council, Successful STEM Education: A Workshop Summary (Washington, DC: National Academies Press, 2011), https://doi.org/10.17226/13230.
- Waldorf. Developed in the early twentieth century by Rudolf Steiner, Waldorf education emphasizes the arts and incorporates them into the curriculum experientially. Accredited Waldorf Schools are affiliated with the Association of Waldorf Schools of North America, but some schools may self-identify as Waldorf without formal accreditation. We have not included Waldorf schools under the Holistic subtype. 39 39 Association of Waldorf Schools of North America, “Waldorf Education: An Introduction,” 2022, https://www.waldorfeducation.org/waldorf-education.
- Other Special Emphasis. Any school that did not fit into one or more of the aforementioned subtypes, but that has an identifiable educational specialty, pedagogical approach, or student demographic that is central to its purpose or identity was given the Other Special Emphasis classification.
Number of Schools
By the time we finalized our data set in July 2022, the Open Data Catalogue listed 1,576 independent schools in Ontario, and we confirmed that 35 of these were permanently closed. Of the remaining 1,541 schools, 62 we identified as Auxiliary, and 34 Unclassified, resulting in 1,445 schools for analysis.
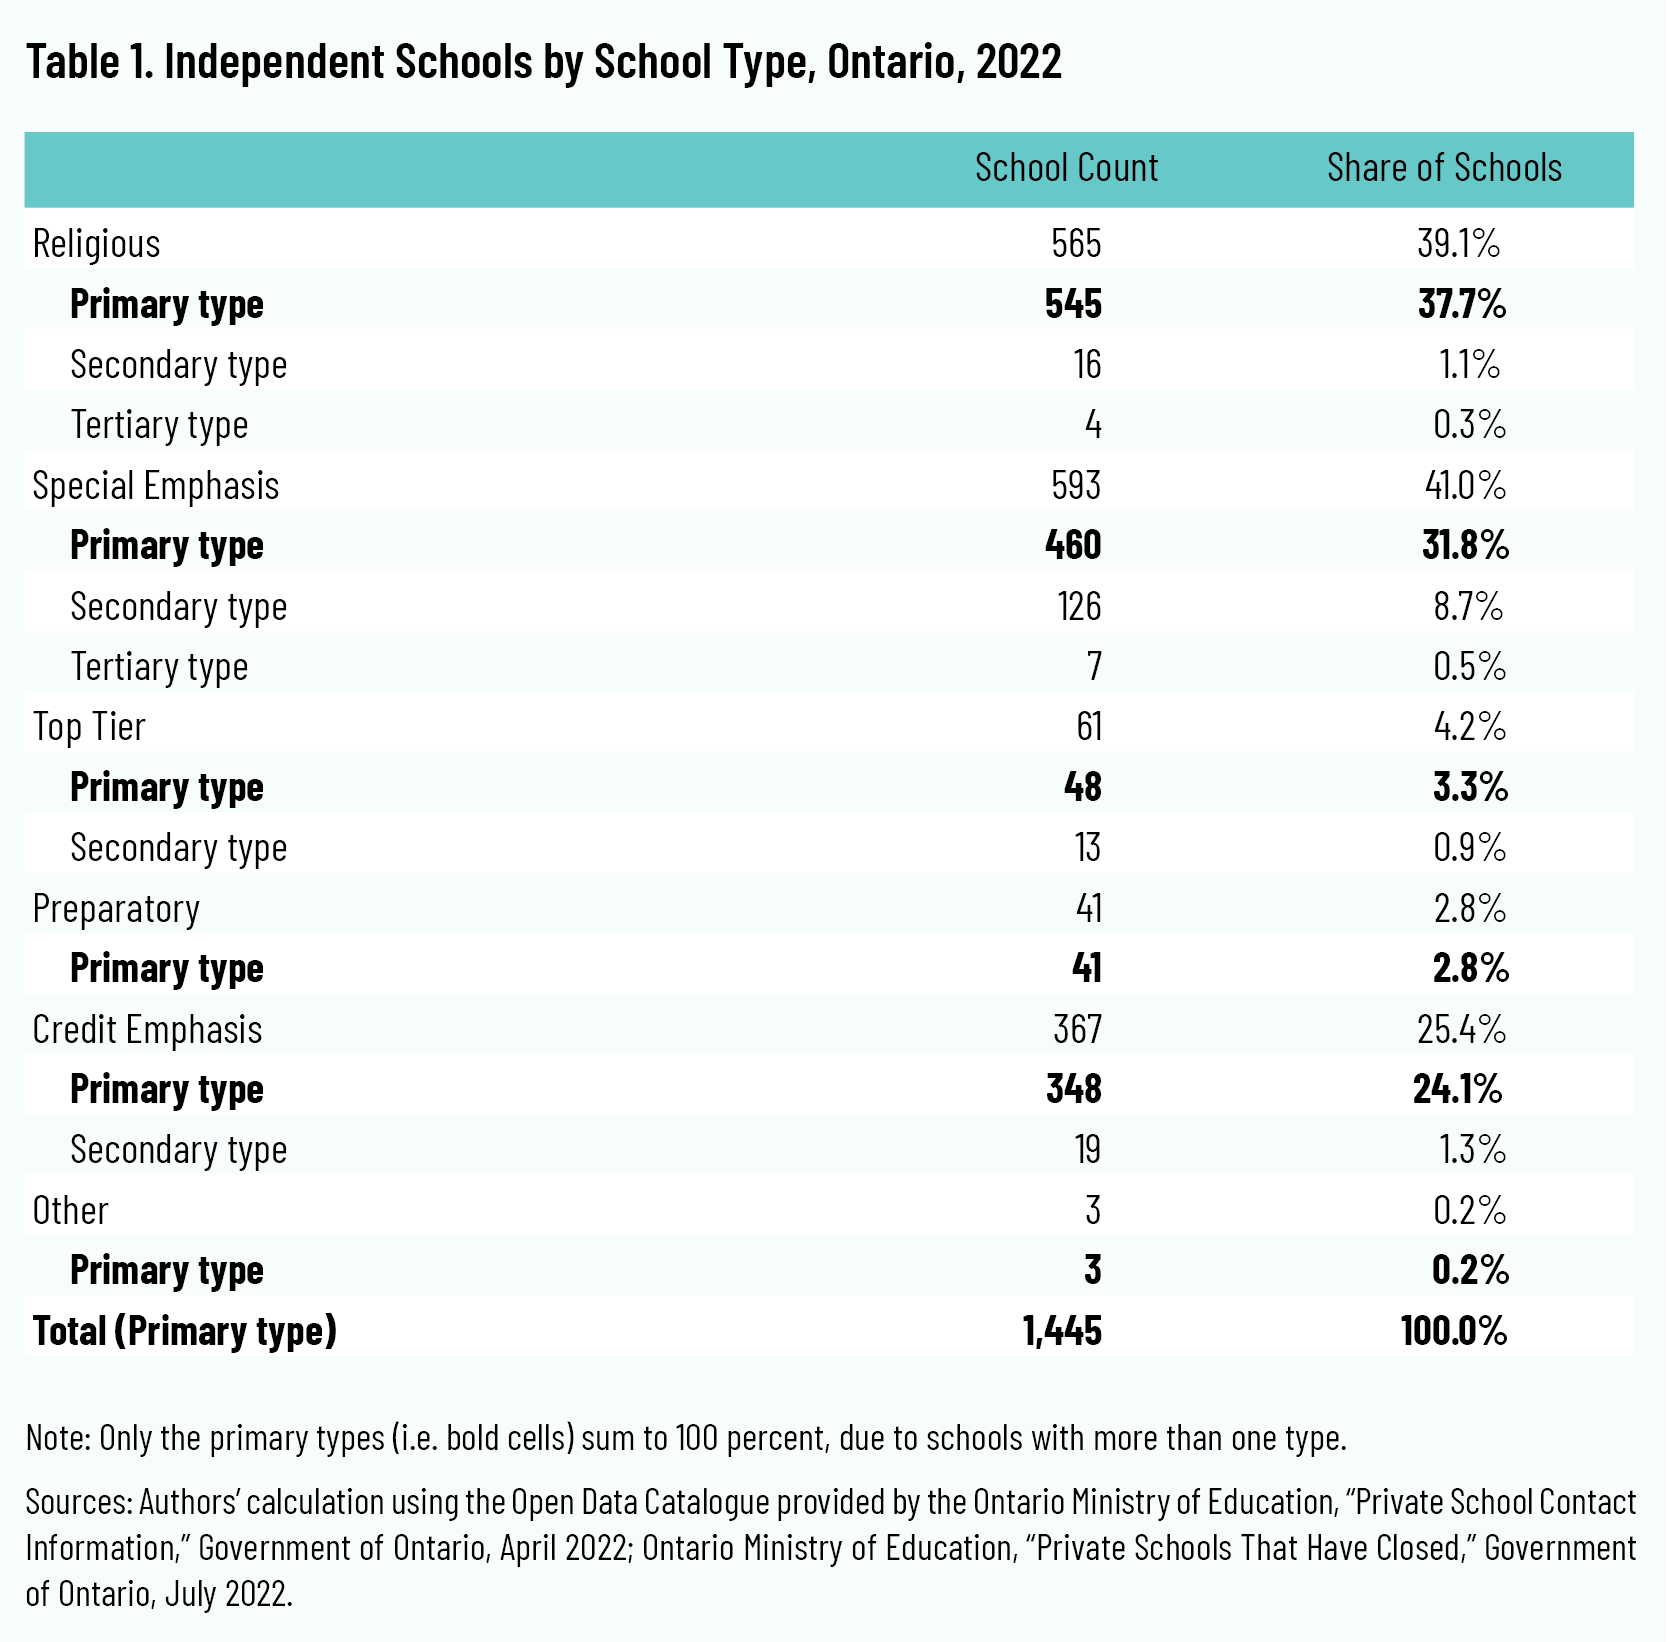
Of these 1,445 under analysis, 593 have a special program emphasis, 565 have a religious affiliation, 367 emphasize OSSD credits, 61 are Top Tier, 41 are Preparatory, and 3 are unconventional independent schools (i.e. Other). In all, 174 schools fit multiple types, while 1,271 are of just one type. Table 1 presents these 1,445 schools by primary, secondary, and tertiary type (by largest to smallest primary type).
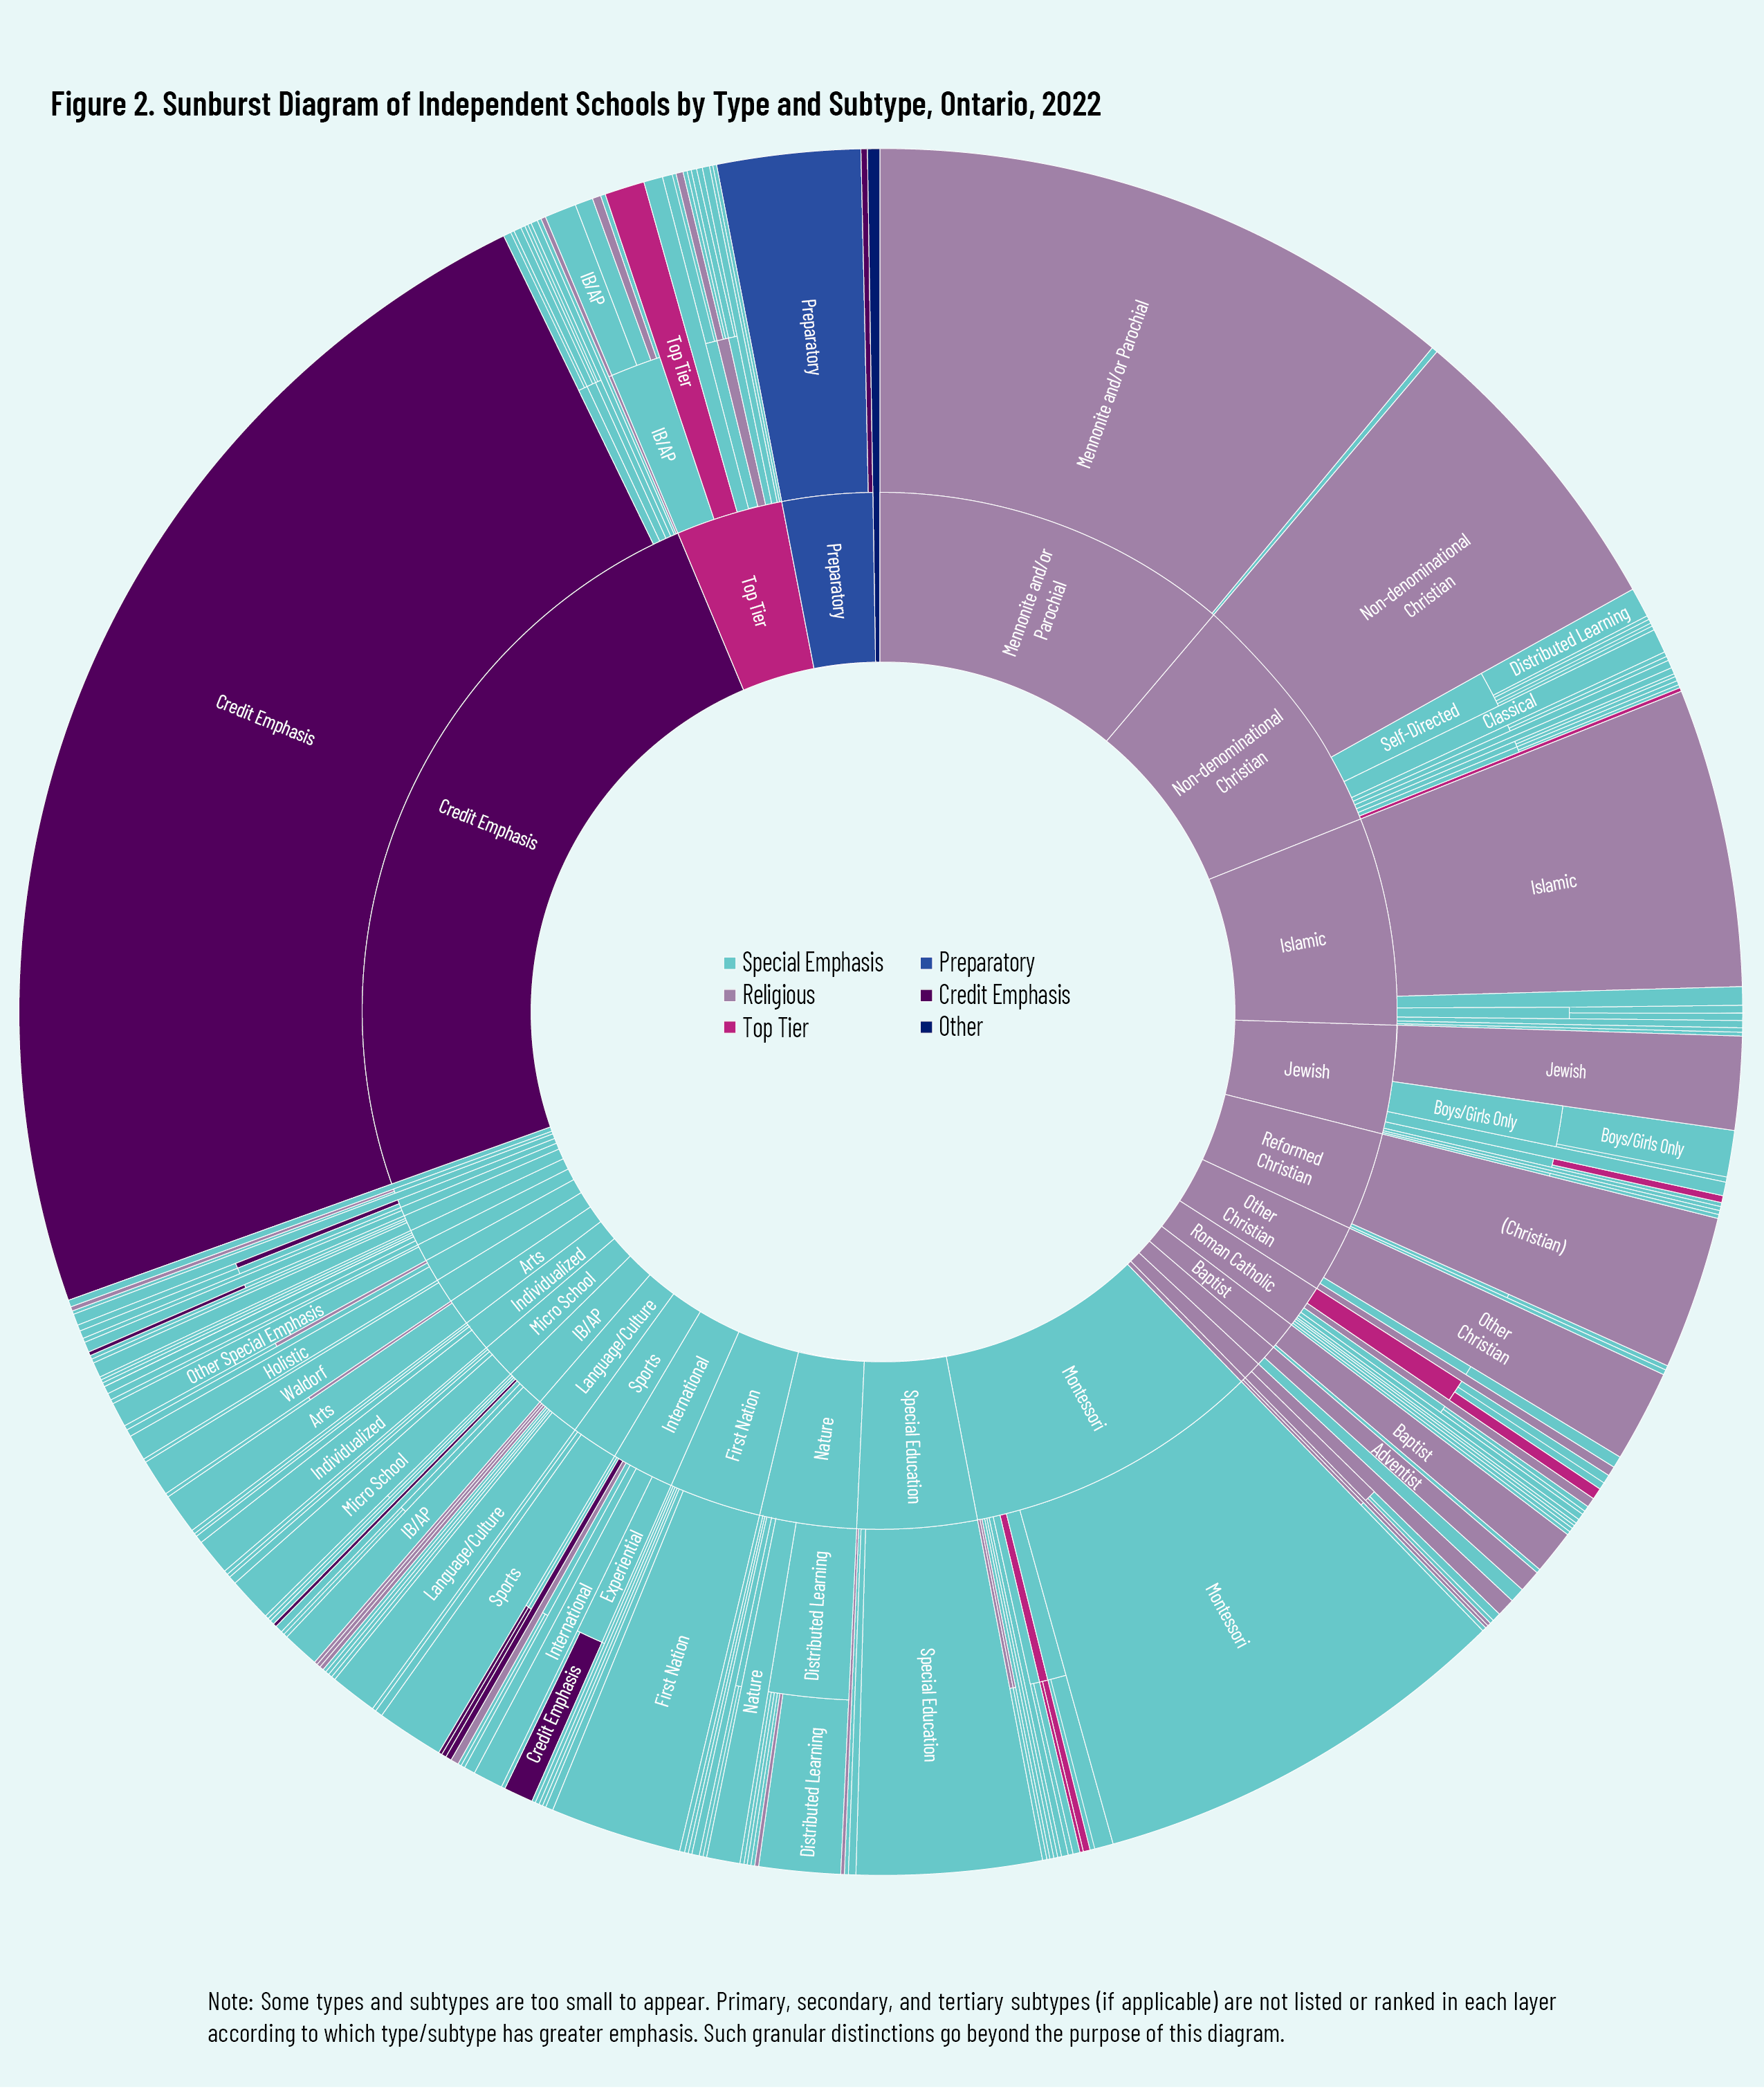
The sunburst diagram in figure 2 visually presents the typing of these 1,445 schools. The first layer (innermost ring) reveals the sector’s primary-type school distribution by subtype (if applicable). The second layer (outermost ring) presents the sector’s school distribution by secondary type or subtype, tertiary type or subtype, and, where applicable, using subtypes instead of types. Importantly, rather than navigate the minute details of each school, the purpose of this sunburst is to give an overall snapshot of the sector’s remarkable diversity.
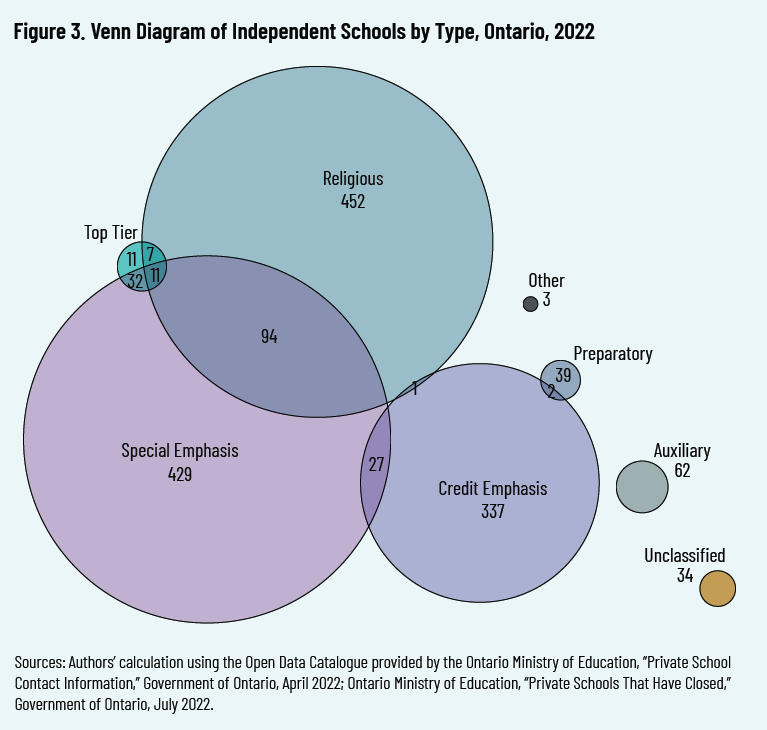
Whereas figure 2 reveals subtypes and tertiary types through a hierarchical stratification of the sector, figure 3 uses a Venn diagram to visualize the “overlap” of types (i.e., distribution of multi-type schools) and the share of each type in the sector. (Figure 3 includes schools we typed as Auxiliary and Unclassified, to visualize the volume and distribution of the full list of 1,541 schools.
Enrolment
The most recent publicly available data of enrolment in the sector is for the 2019–20 school year, as of October 31, 2019. 40 40 Ontario Ministry of Education, “Private School Enrolment by Gender,” Government of Ontario, April 2022, https://data.ontario.ca/en/dataset/private-school-enrolment-by-gender. The Open Data Catalogue at that date, due to its lag, included only 1,286 schools—of which 81 are permanently closed as of July 2022. Subtracting Auxiliary and Unclassified schools, we have a total of 1,155 schools for which we have enrolment data.
Table 2 presents the typing and 2019–20 enrolment data for these 1,155 schools. As of 2019–20, Special Emphasis and Religious schools are essentially tied for highest enrolment, at 70,220 (48 percent) and 69,220 (47 percent), respectively. However, schools whose primary type is Special Emphasis make up less than 27 percent of primary-type enrolment, while nearly 44 percent of primary-type enrolment is at Religious schools. Although Top Tier schools are a very small share of schools, these are, on average, the largest-enrolment schools and thus make up nearly 16 percent of primary-type and 19 percent of total enrolment in the sector. Conversely, Credit Emphasis schools are plentiful in number but have below-average enrolment levels, thus constituting just 10 percent of primary-type and 14.4 percent of total sector enrolment.

We began this report with the observation that the sector has been growing, and this is worth noting in more detail. Consider the following schools for which we do not have any enrolment data, as they opened in the time between the writing of this report and the most recent publicly accessible headcount. Between October 2019 and July 2022, after accounting for the few dozen independent schools that permanently close each year, a net 240 independent schools have opened. Of these, 141 have a Credit Emphasis (62 percent increase), 131 have a Special Emphasis (28 percent increase), 32 have a Religious affiliation (6 percent increase), three are Preparatory (8 percent increase), and one is typed Top Tier. 41 41 This sum exceeds 240, due to multiple-type schools.
In other words, the significant growth of independent schools is not attributable to Top Tier schools. We see this when comparing 2019–20 to 2013–14 enrolment data. While total enrolment in the sector grew by 29,531 new students (25.3 percent) in that period, CAIS enrolment increased by 1,794 students (9 percent). Moreover, expanding the definition of Top Tier schools beyond CAIS to include all five elite associations only marginally increased their share of schools and enrolment. CAIS schools were 3.9 percent of the sector’s schools and 17.1 percent of enrolment in 2013–14, and Top Tier schools were 5.2 percent of the schools and 18.9 percent of enrolment in 2019–20. As of July 2022, Top Tier schools are 4.2 percent of independent schools in Ontario.
Distribution by School Size
The sector shows a considerable gap between the mean and the median enrolment for each type and subtype. This reflects the fact that there are a few very large independent schools, which skews the mean rightward. Of the 1,155 schools for which we have 2019–20 enrolment data, figure 4 shows that three out of four schools (872) had fewer than 150 students enrolled, and 90 percent (1,042 schools) had fewer than 300 students. For context, the largest and second-largest independent schools in Ontario had 4,635 and 3,005 students in 2019–20, respectively.
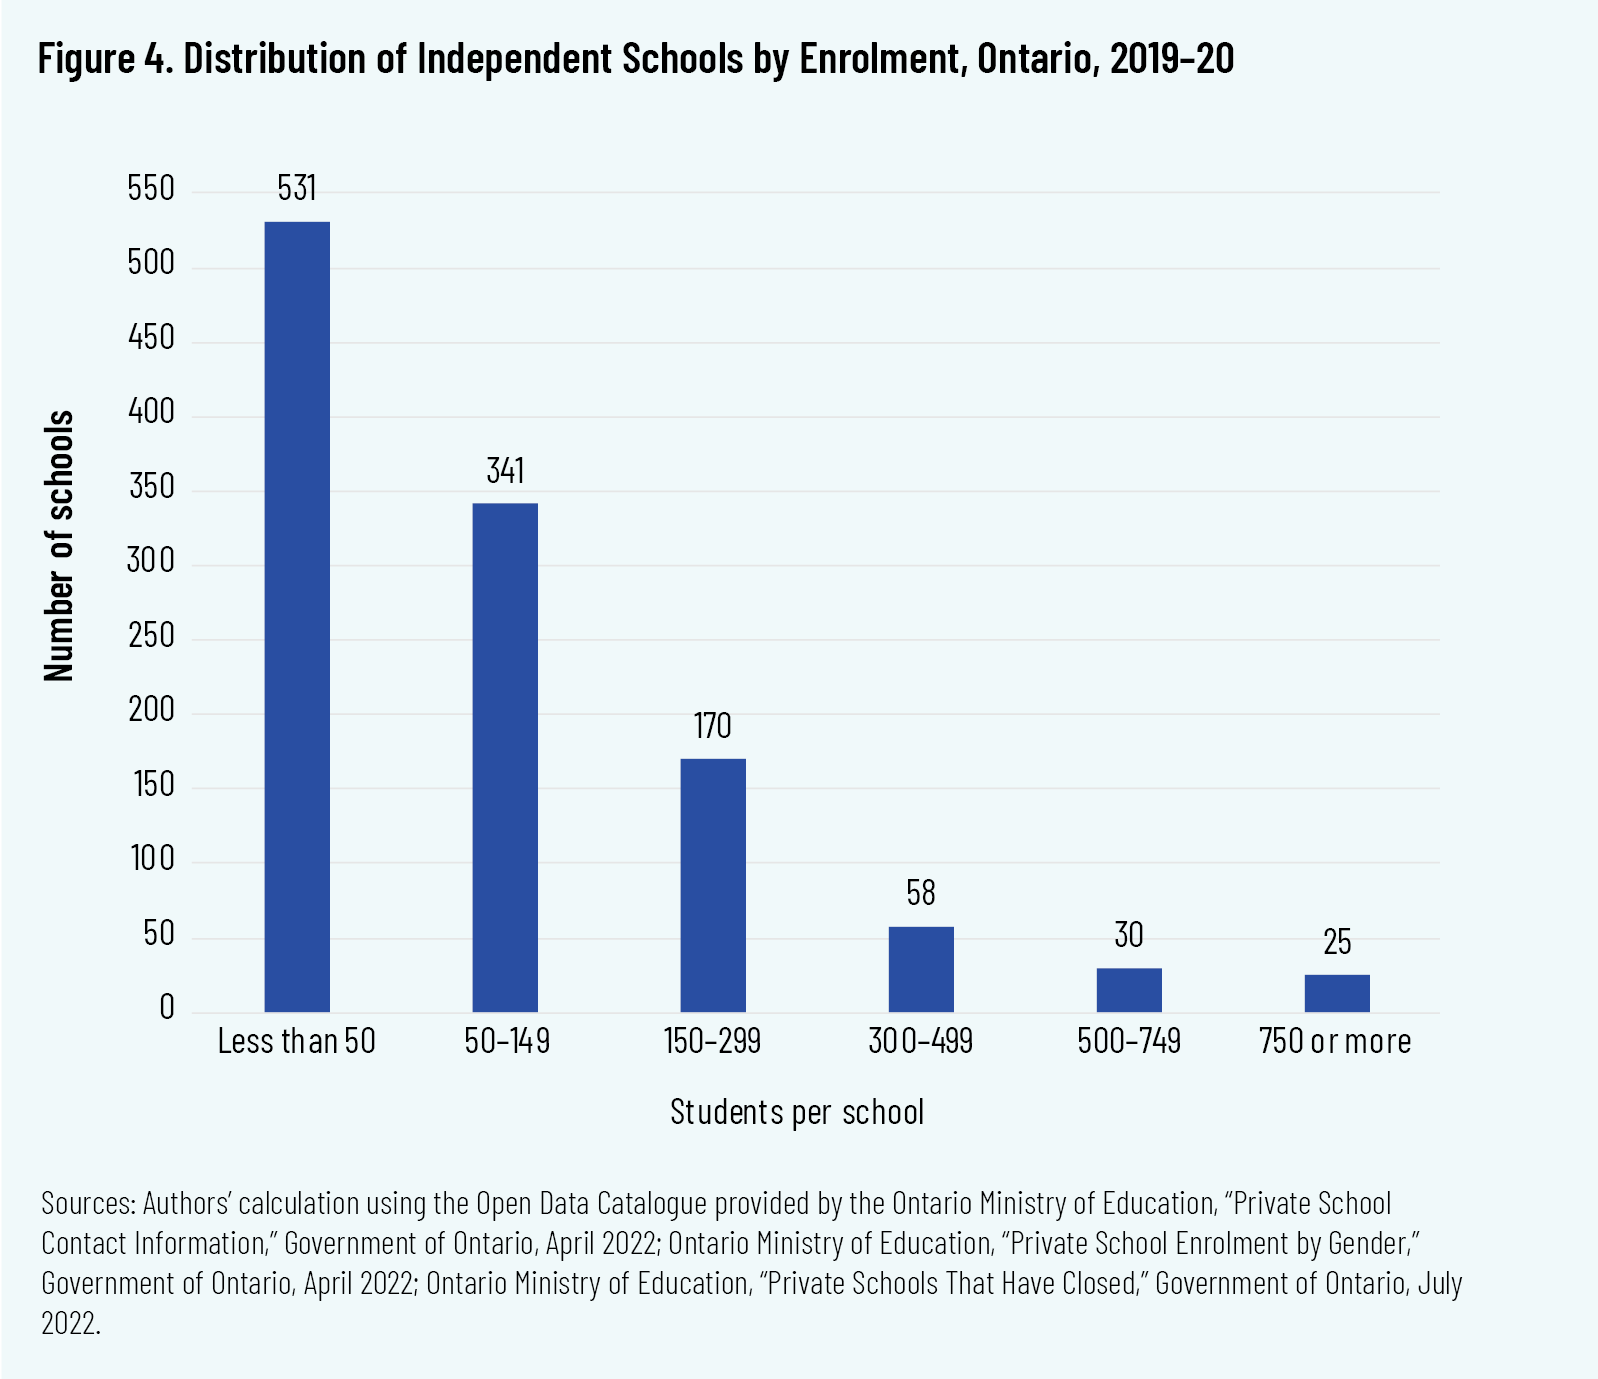
The high number of small schools within the Ontario independent landscape is not surprising, given the community orientation of many Special Emphasis and Religious schools, as well as the rural location of many of the schools. Indeed, the small, local, intimate community school is typical of the sector.
Table 3 shows Ontario’s independent schools by per-school enrolment, in increments designed for comparison with the 2013–14 data. The fastest-growing segment, in terms of both school count and enrolment, is schools with 150 to 299 students. Religious schools constitute 51.5 percent of independent schools in this size category. Interestingly, this is the student-body size that Paul Bennett identifies as optimal for achieving economies of scale while maintaining schooling on a “human scale.” 42 42 P.W. Bennett, The State of the System: A Reality Check on Canada’s Schools (Montreal and Kingston: McGill-Queen’s University Press, 2020), 230–1. The smallest schools form the largest share of schools, at 531 independent schools (46 percent) enrolling fewer than 50 students in 2019–20. Conversely, 2 percent of independent schools have 750 or more students.
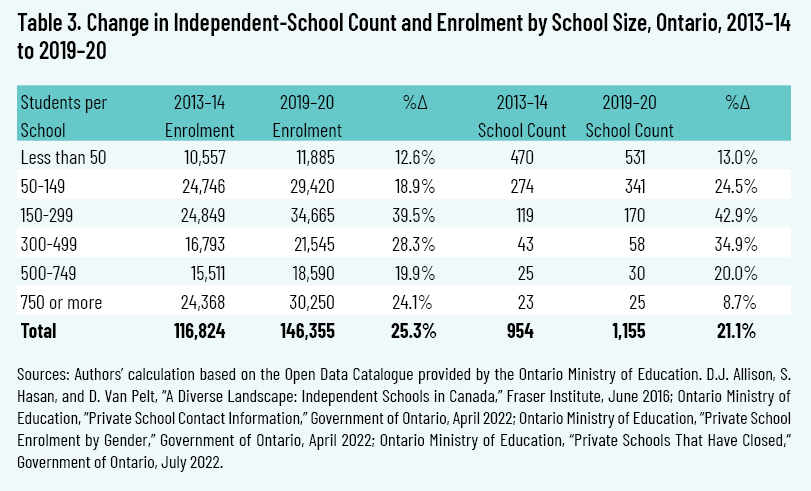
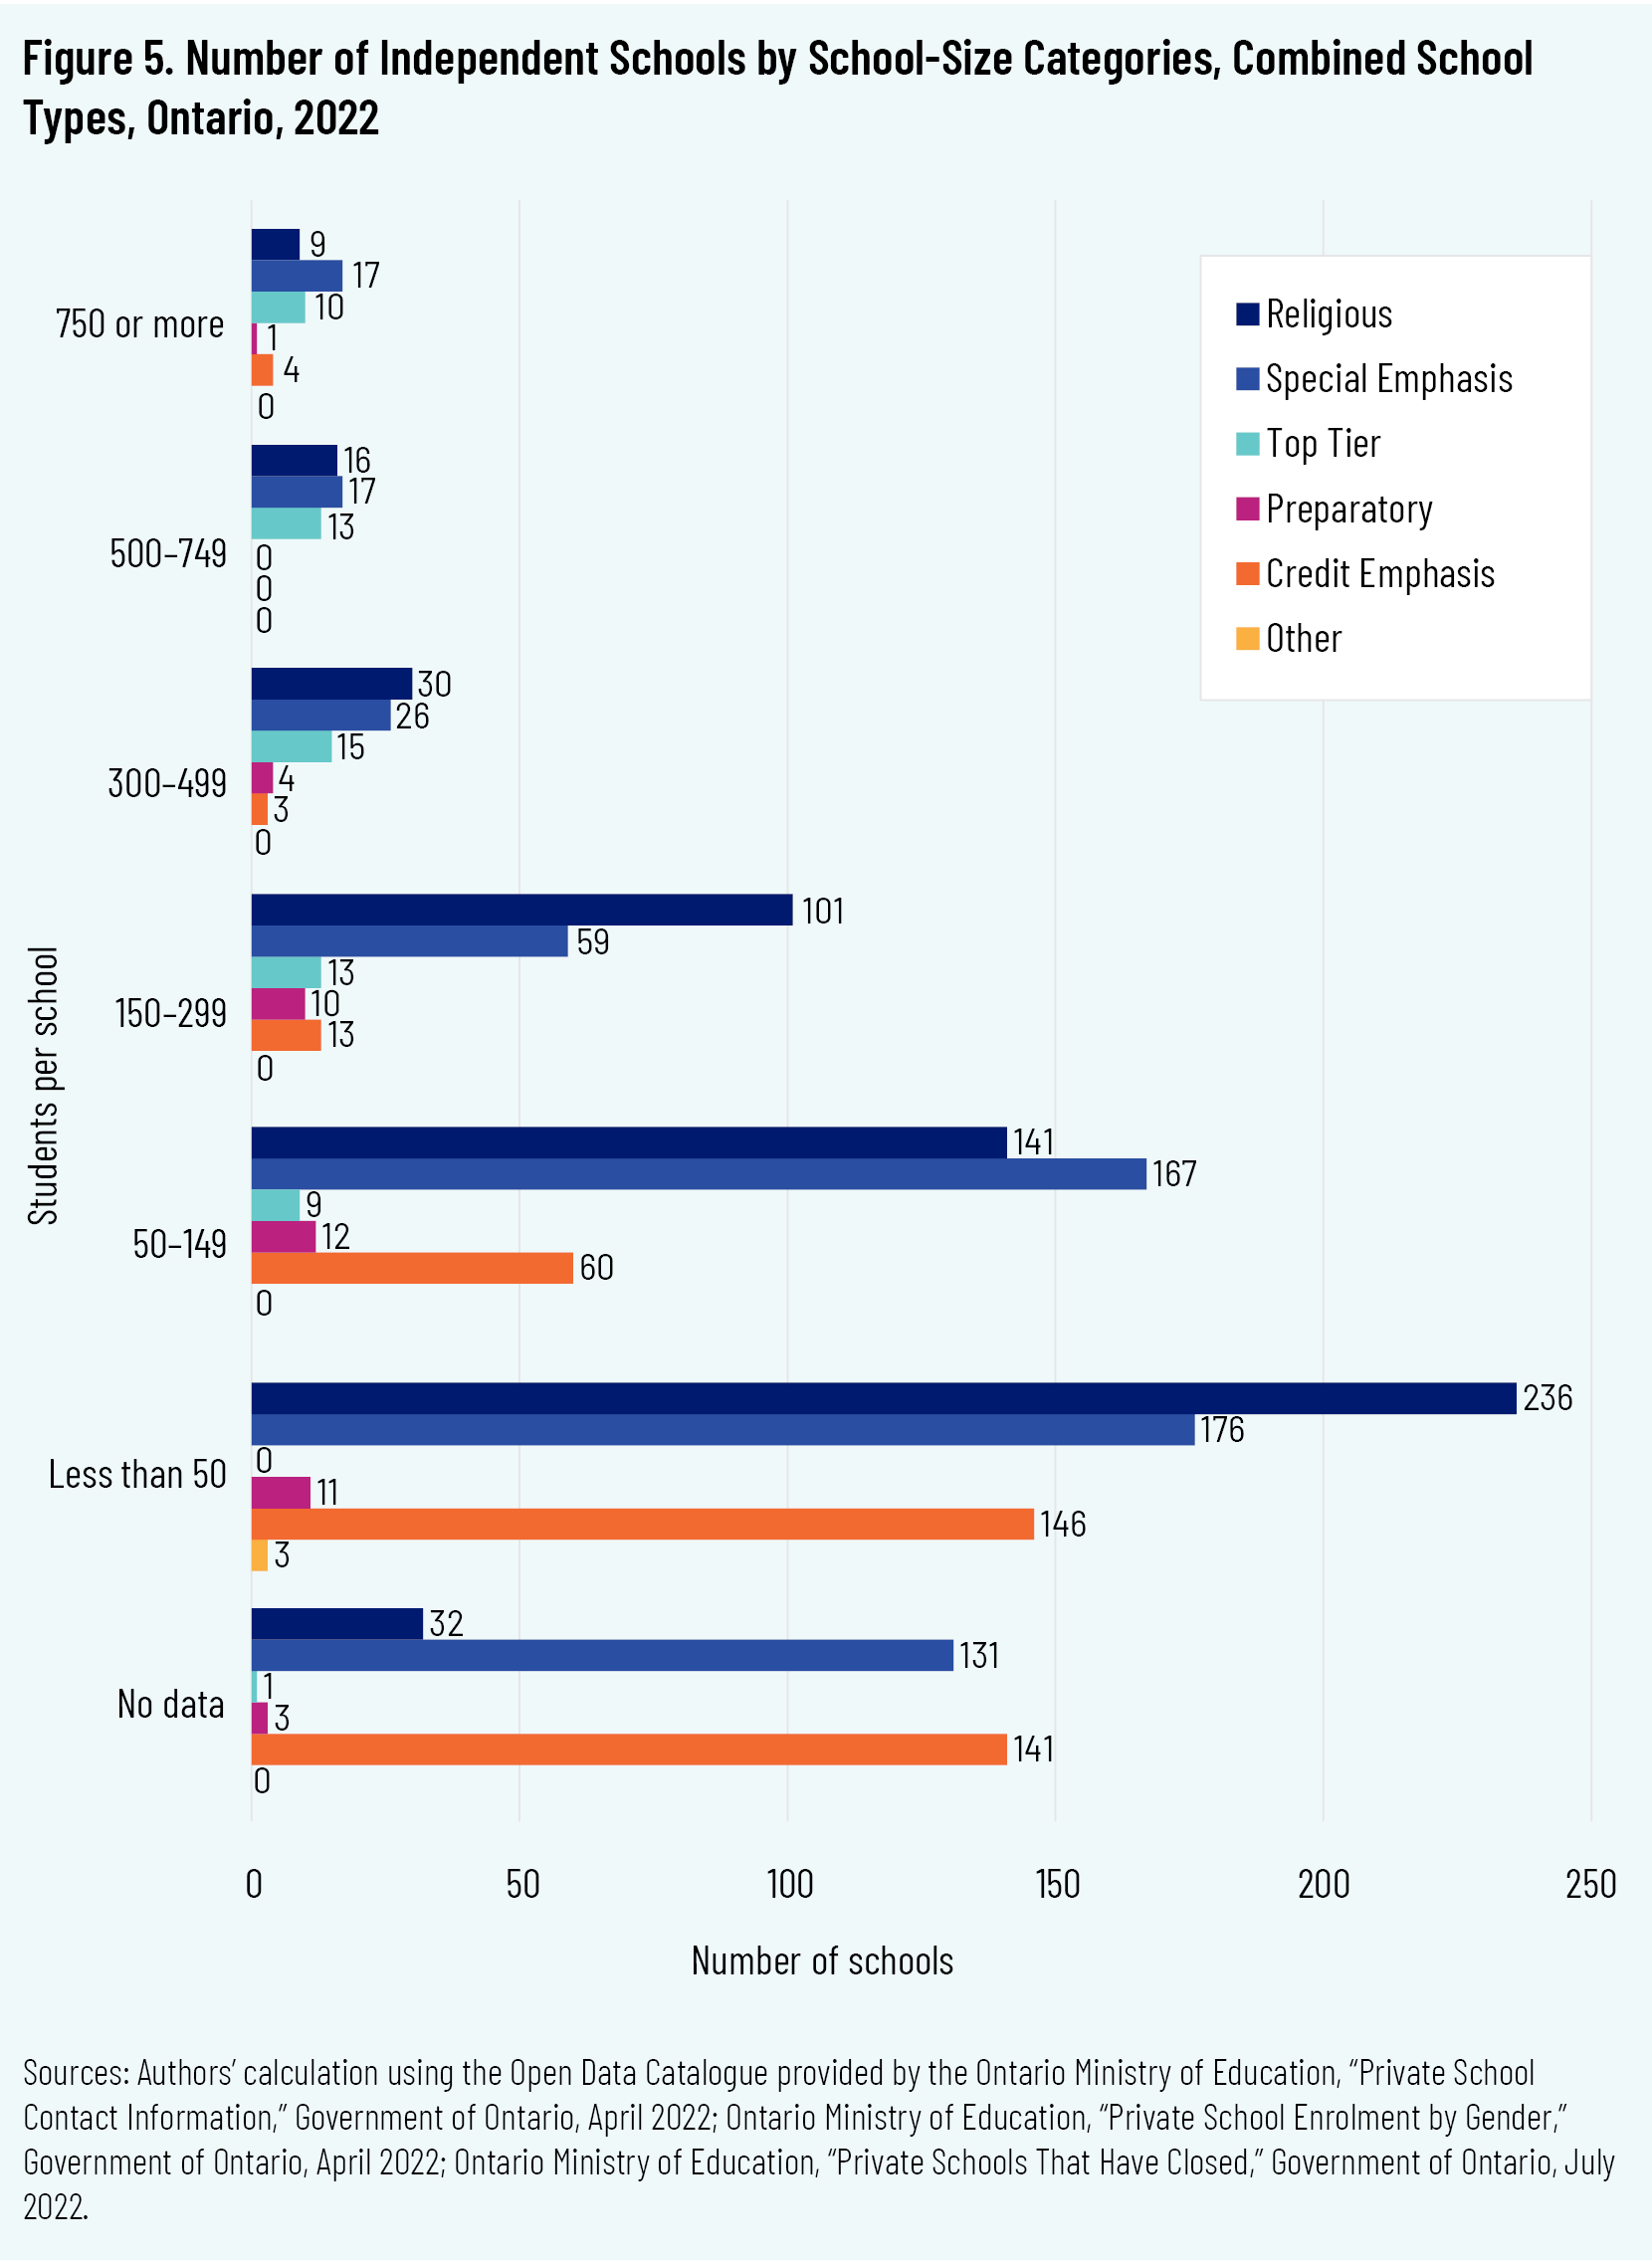
Figure 5 identifies the type of school according to school size. Noteworthy here is that 63 percent of Top Tier schools (for which we have enrolment data) are in the largest three size categories, with 300 or more students. On the other hand, 87 percent of Preparatory schools (for which we have enrolment data) are in the smallest three size categories, with fewer than 300 students. Nearly three out of four Special Emphasis schools and 71 percent of Religious schools (for which we have enrolment data) have fewer than 150 students—in fact, nearly half (44 percent) of Religious schools (for which we have enrolment data) have fewer than 50 students. Sixty-five percent of Credit Emphasis schools (for which we have enrolment data) also have fewer than 50 students; enrolment data is not available for 38.4 percent of Credit Emphasis schools. Likewise, we do not have enrolment data for one out of five Special Emphasis schools, due to new schools emerging since 2019–20.
Distribution by Program Type
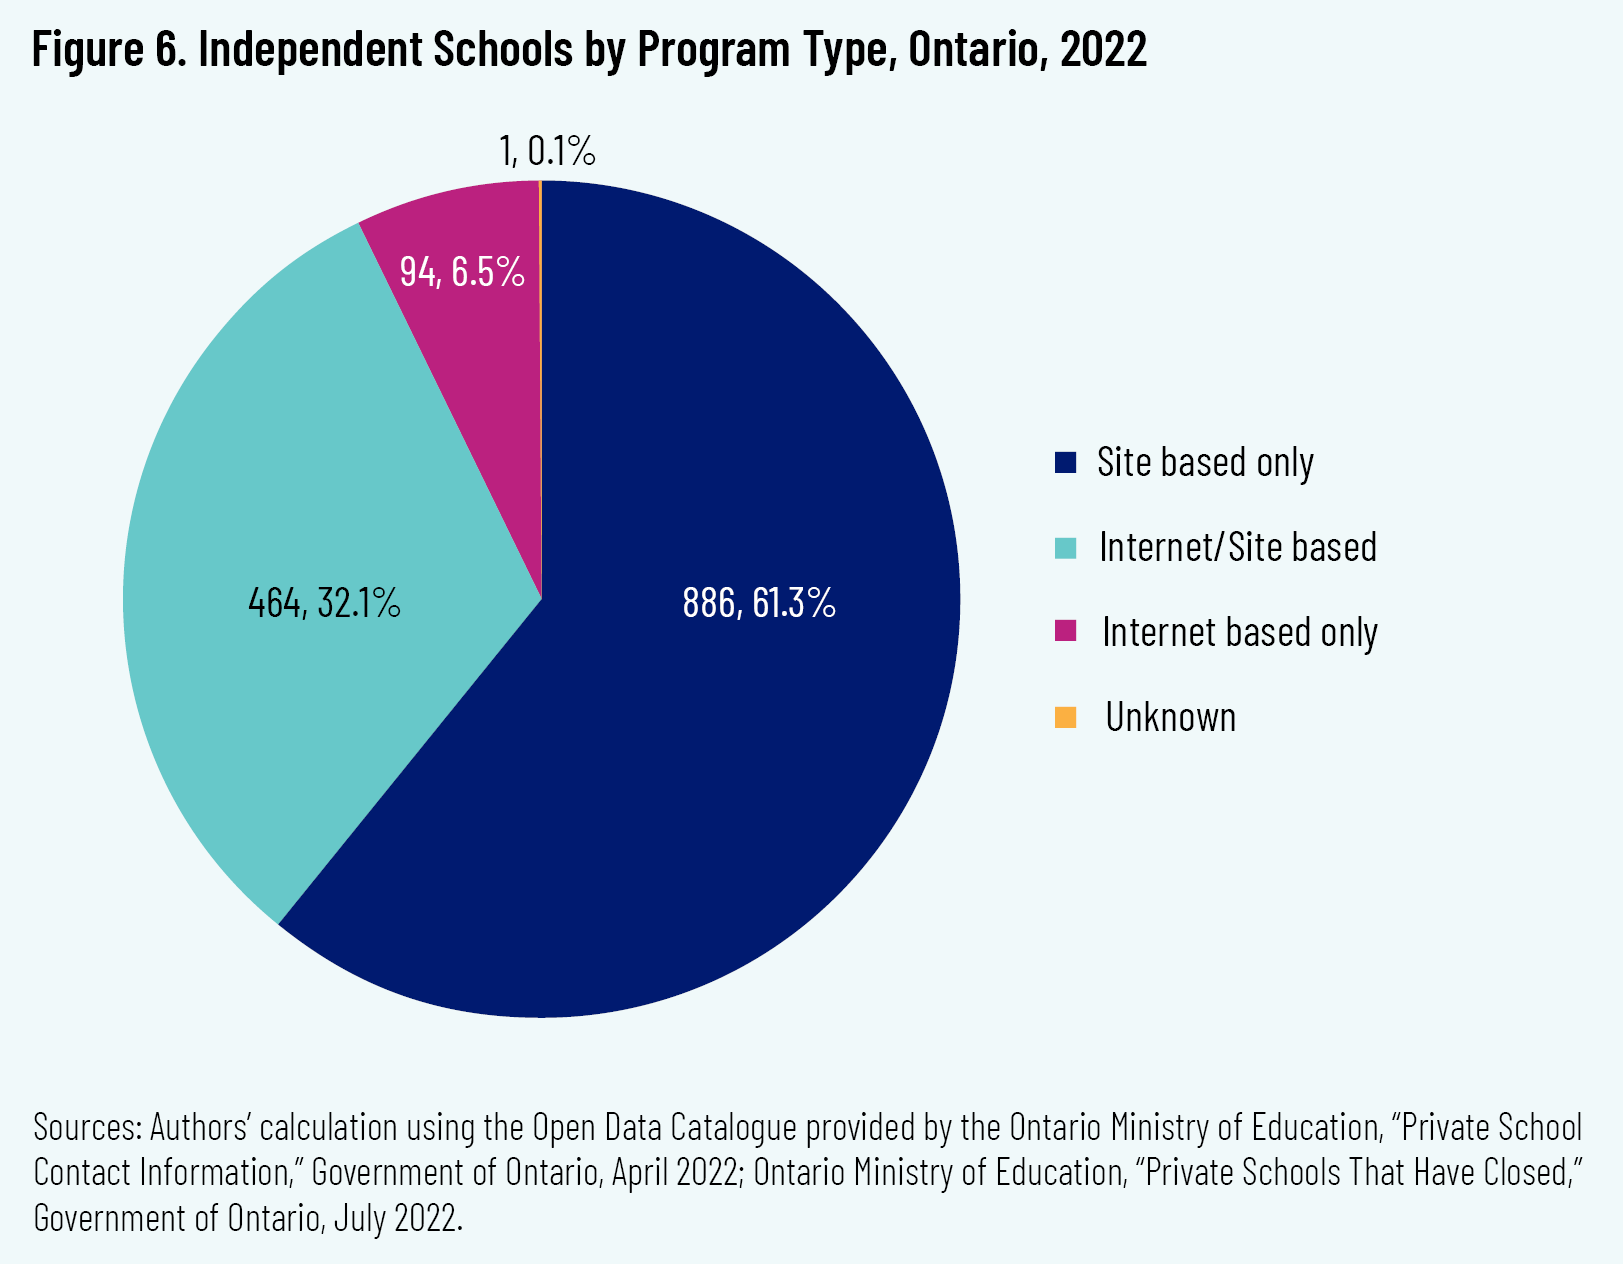
The Ontario Ministry of Education requests that schools report the education delivery that they provide: in-person mode of delivery at a physical location, digitally via the internet, or through a blend of the two. Prior to the COVID-19 pandemic, the type of program was often a reflection of the school’s educational purpose or philosophy. For example, fully online schools typically served international students or Canadians studying abroad. 43 43 Government of Canada, “Canada’s International Education Strategy, 2014–2019,” 9, https://www.international.gc.ca/education/assets/pdfs/overview-apercu-eng.pdf. But Ontario’s several and prolonged shutdowns of in-person schooling over the past two years have forced a technological revolution on K–12 schooling. The data we present here cannot be divorced from this context. It remains to be seen whether all, or just some, schools that are currently blended remain this way long past the pandemic.
Apart from emergency remote learning, 61 percent of the schools are entirely in-person, as shown in figure 6. Another 32 percent are blended schools. Seven percent of schools are entirely online. Thus nearly two out of five offer at least part of their schooling online.
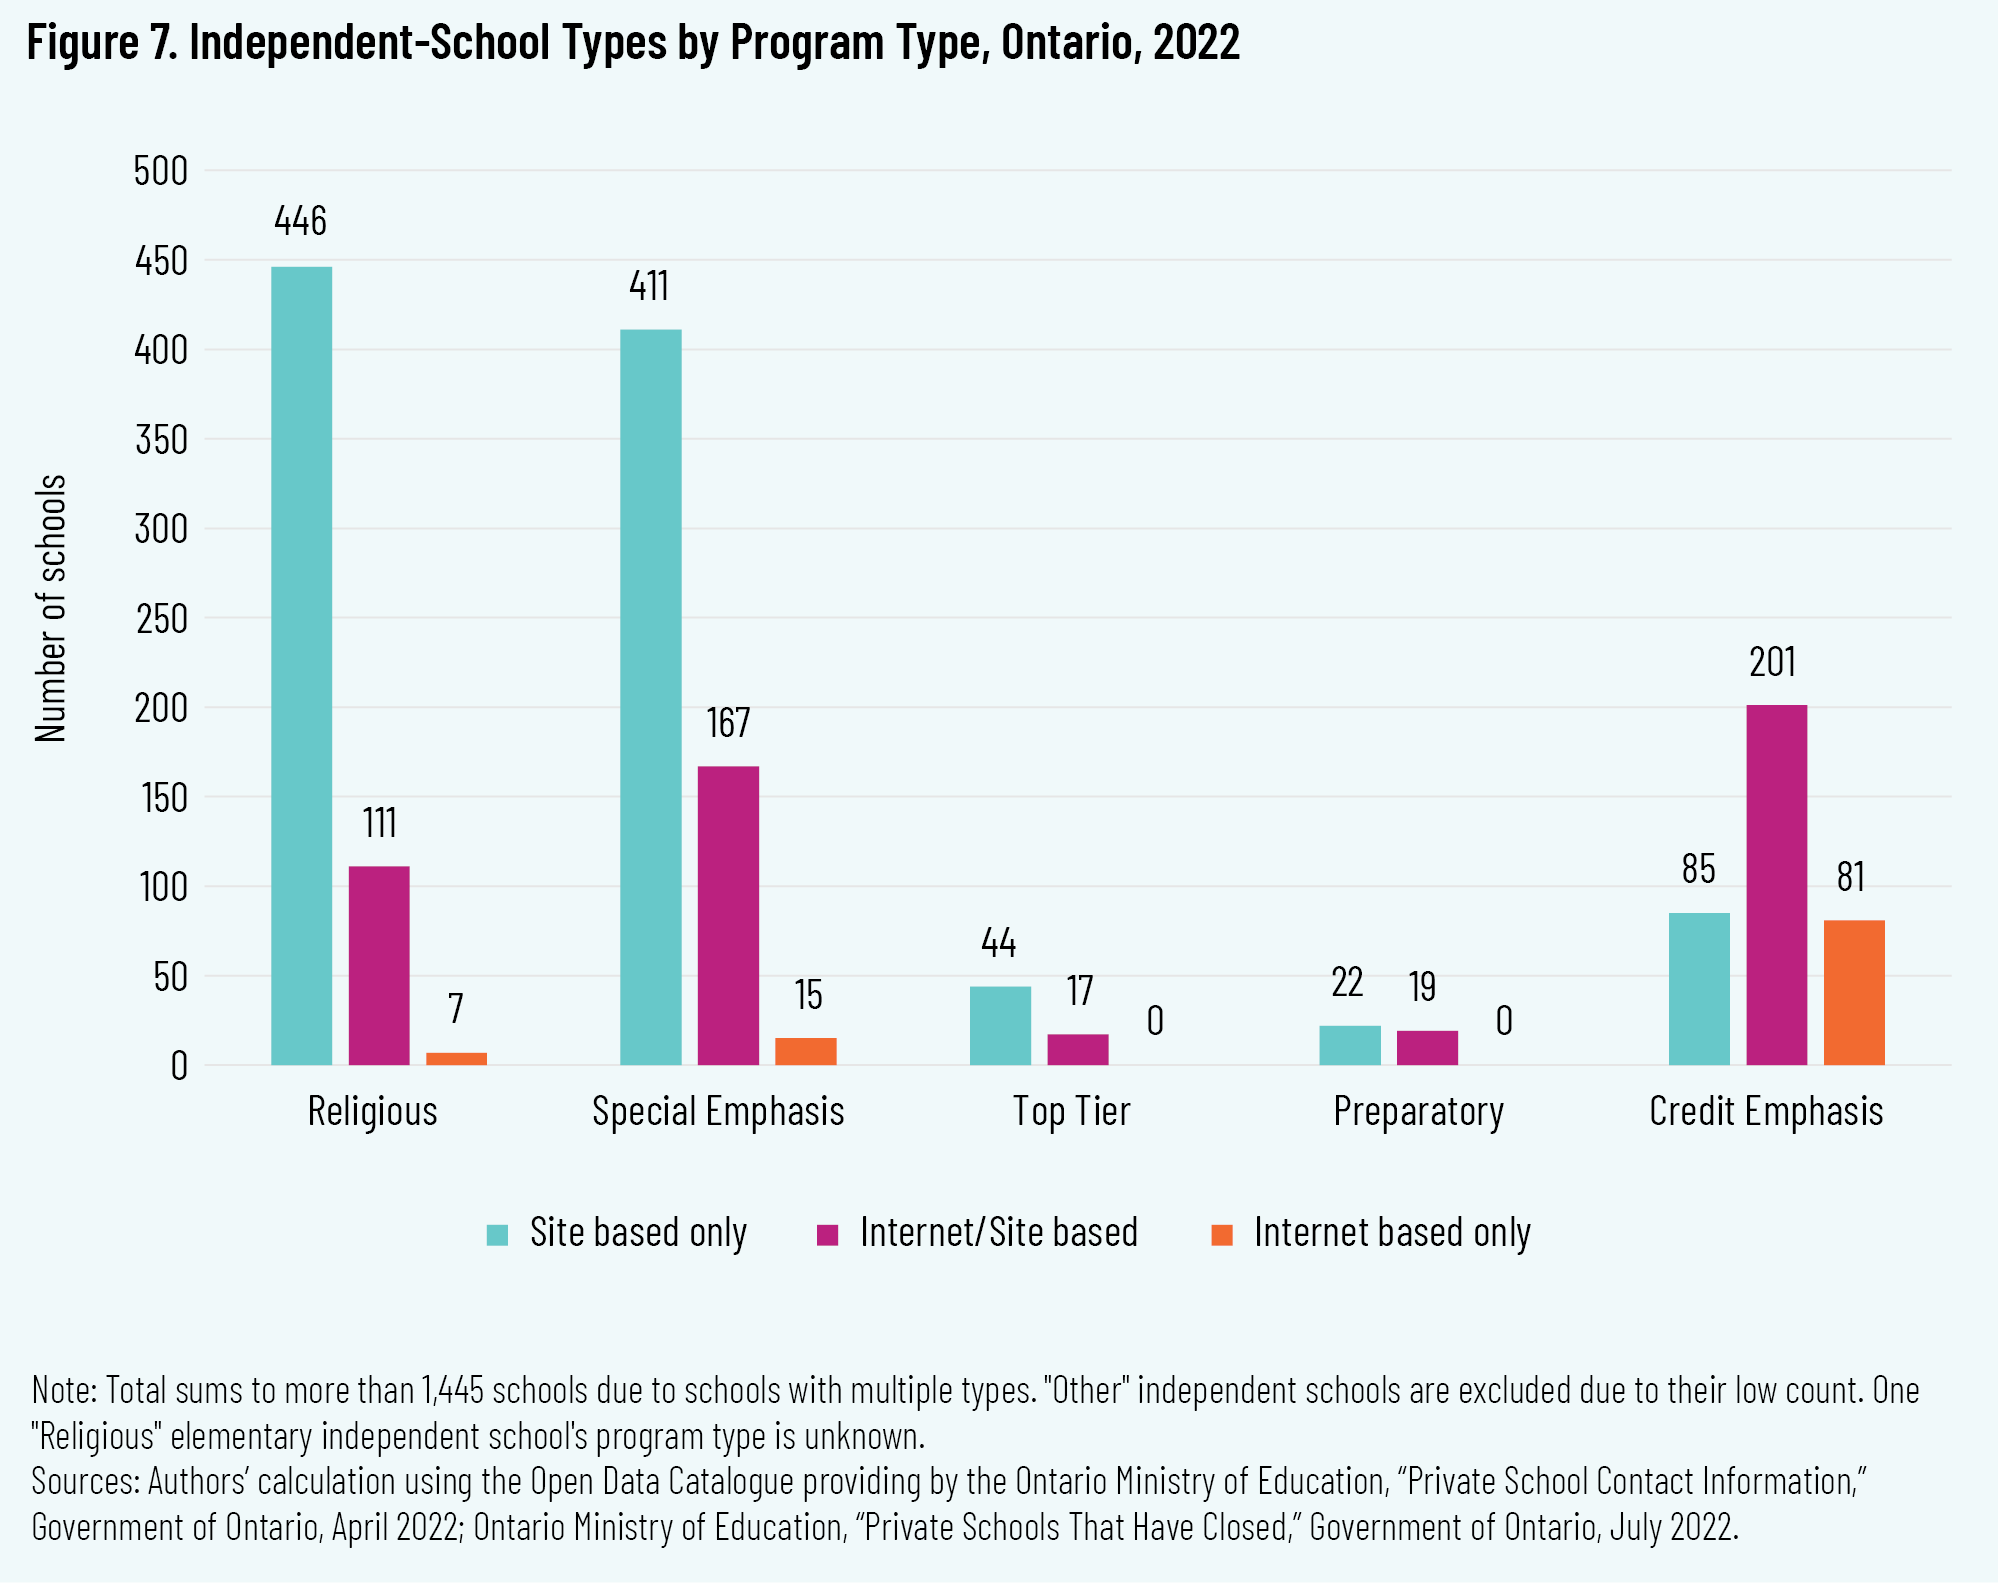
When cross-tabulating program type by school type, some important distinctions emerge, as shown in figure 7. One in five Religious schools are blended, and just 1 percent are online only. Fully 28 percent of both Special Emphasis and Top Tier schools have blended learning options. No Top Tier or Preparatory school is fully online, but interestingly, almost half—46 percent—of Preparatory are blended schools. Less than one in four Credit Emphasis schools are in-person only, and more than one in five are entirely online. Of all online-only schools, nearly four out of five (79 percent) are Credit Emphasis.
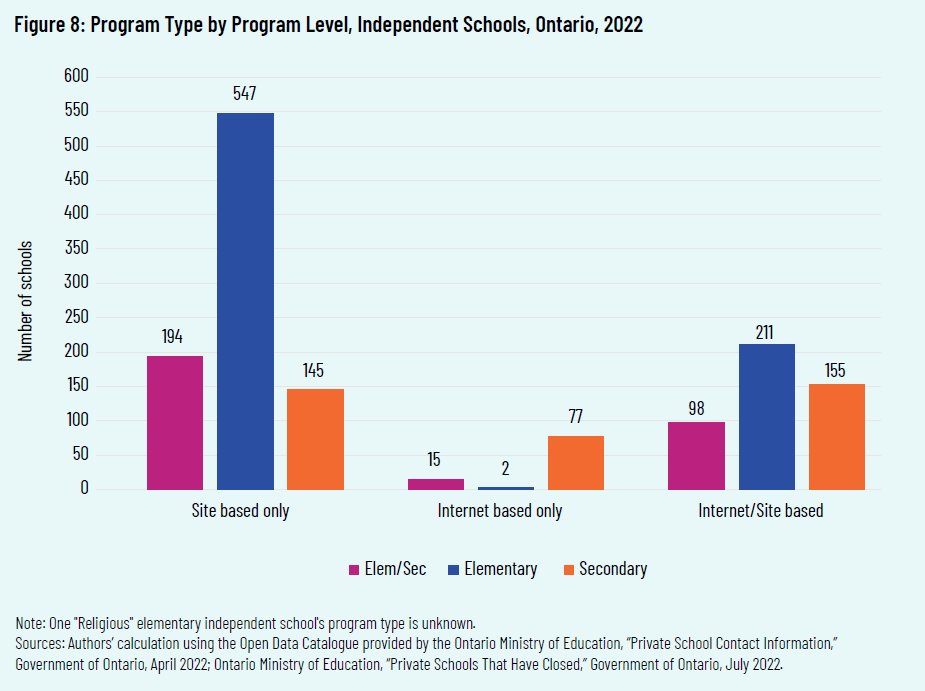
Four out of every five internet-only schools are also secondary-only. As figure 8 presents, just one in every three secondary-only schools offers only in-person instruction. Flexible learning options are prevalent in the sector. Fully 42.6 percent of elementary/secondary schools offer both in-person and online options. Even 15.4 percent of elementary-only schools offer options other than just in-person schooling.
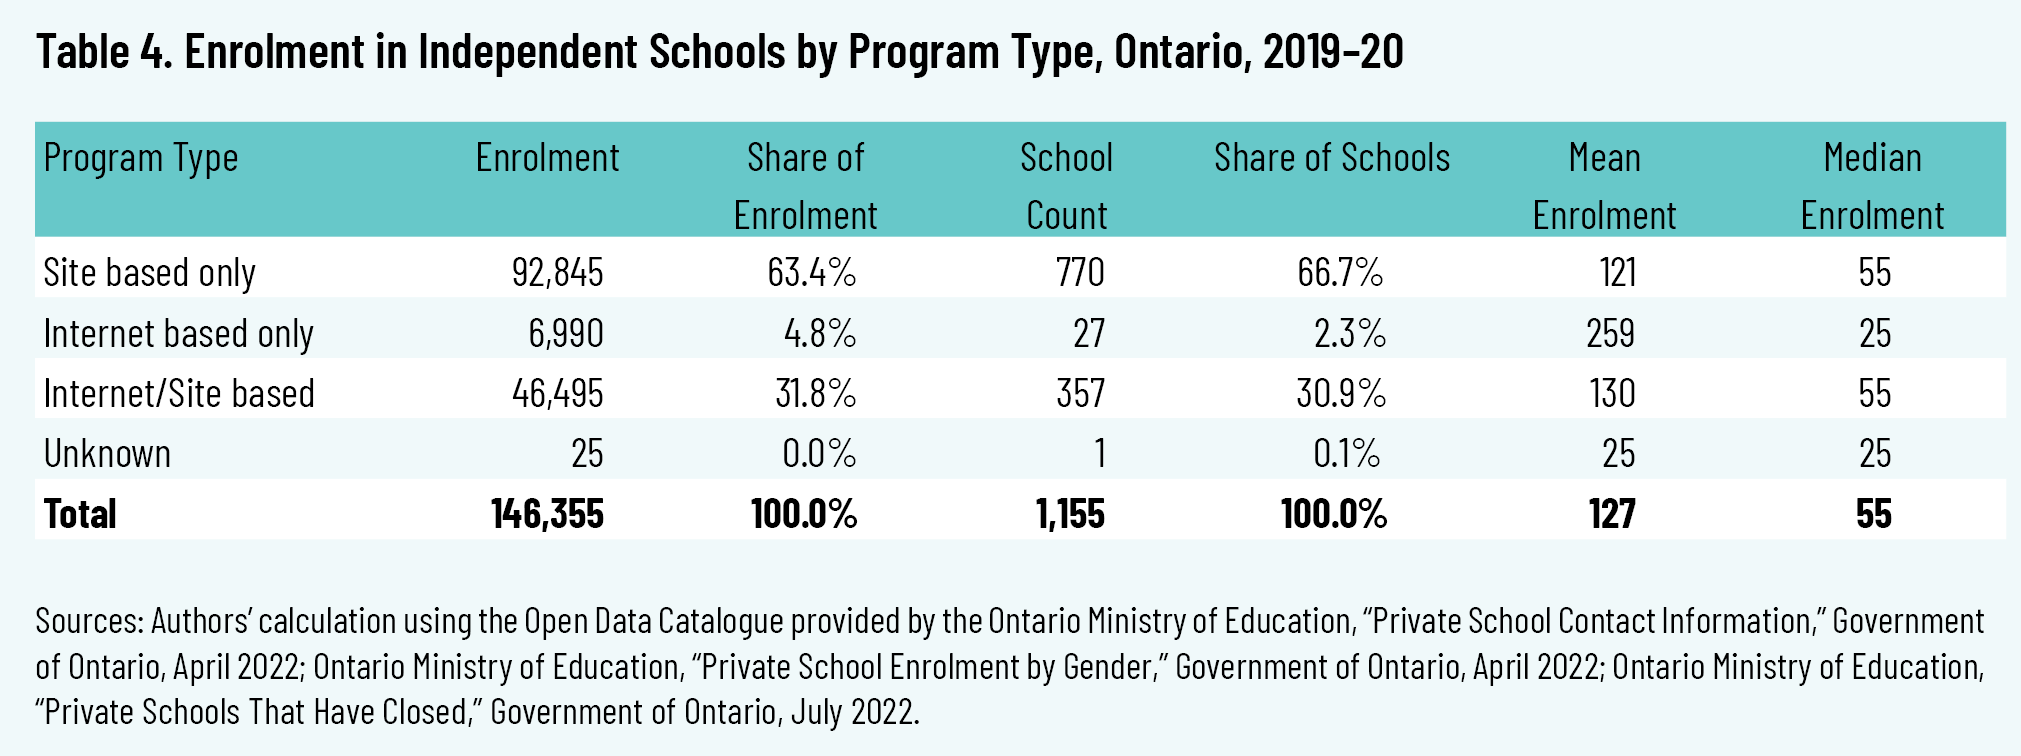
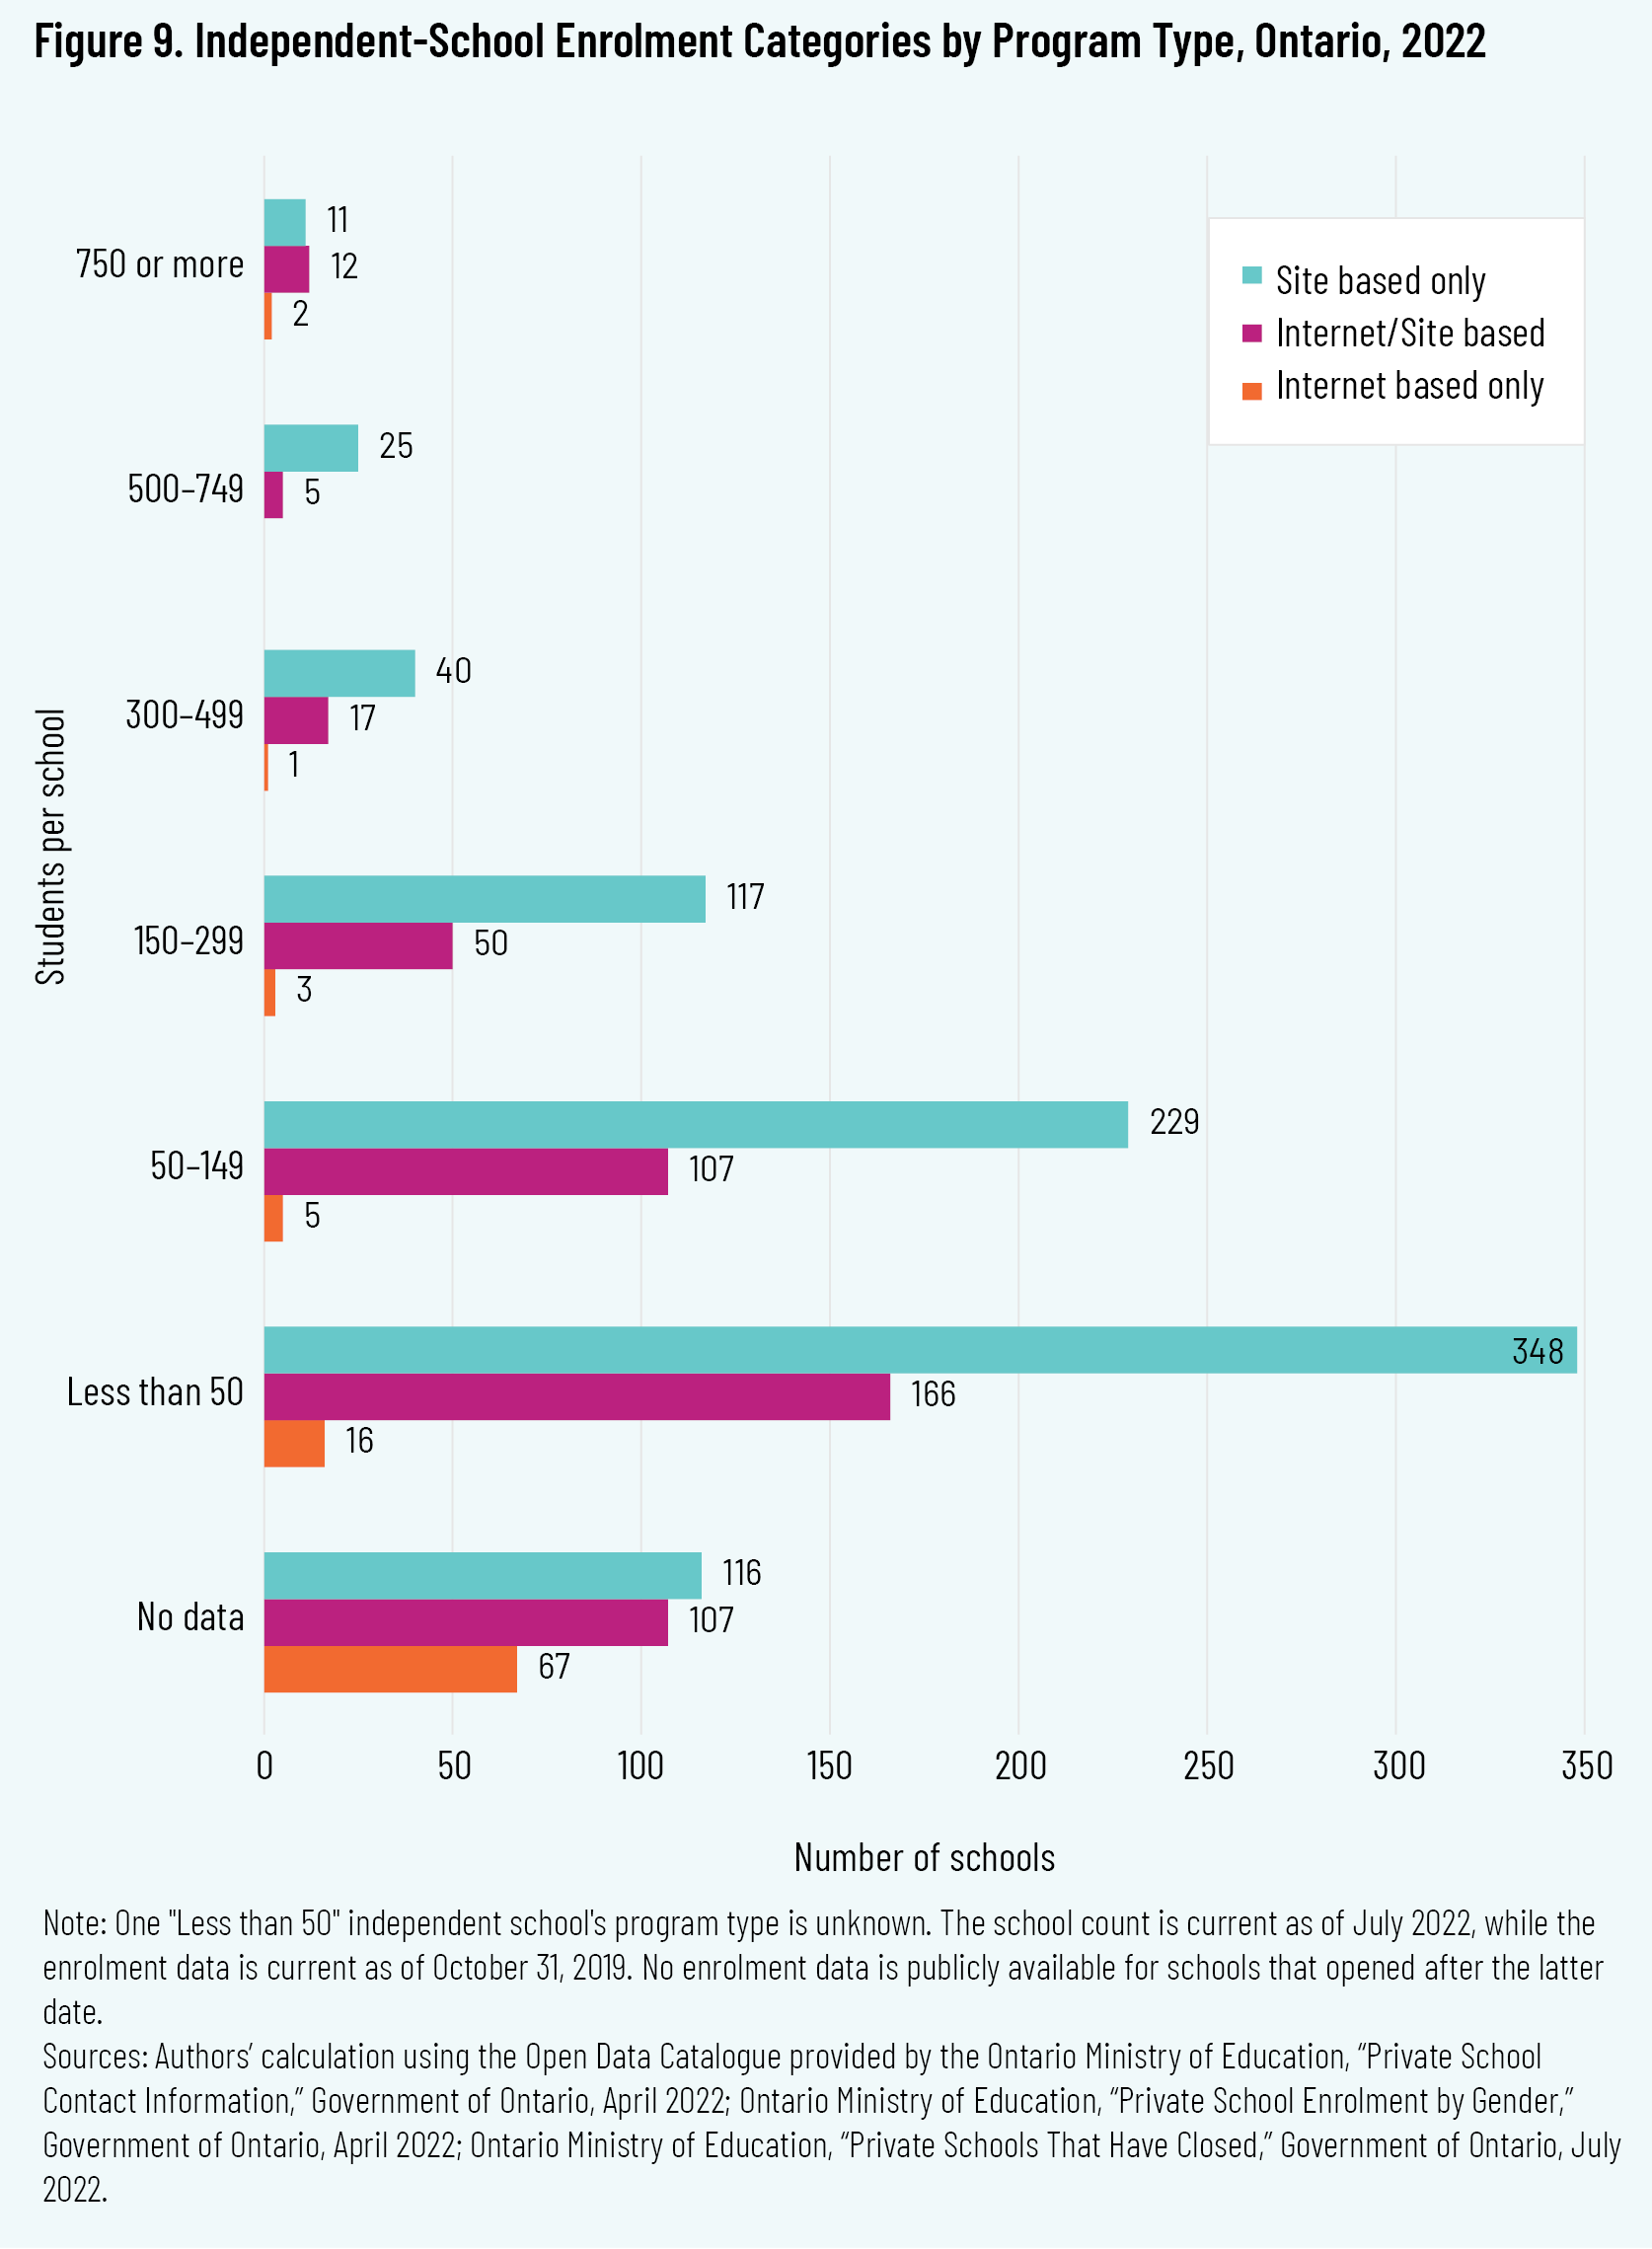
In 2019–20, nearly two-thirds of enrolment in the sector was schools offering only in-person instruction, as shown in table 4. However, due to the considerable growth in the sector, we do not have enrolment data for one in five schools, as presented in figure 9—in other words, we do not have enrolment data for 71 percent of the schools that offer only online instruction. 44 44 The 290 schools for which there is no enrolment data consist of 50 schools from the 2019–20 Open Data Catalogue list and 240 net new schools launched after its release.
Distribution by Program Level
The Ministry requests that schools identify as either elementary (junior kindergarten to grade 8), secondary (grades 9–12), or both (grades JK–12). The province regulates and oversees elementary schools differently from secondary schools. Elementary-level programs are free to set their own curriculum and, under normal circumstances, are not subject to inspection or regulation by the Ministry. 45 45 Ontario Ministry of Education, “Private Schools: Policies and Procedures Manual,” 2013, https://files.ontario.ca/edu-private-schools-policy-procedures-manual-2013-en-2021-11-25.pdf. However, secondary-level programs offering credits toward the OSSD undergo inspections every two years and must follow set curriculum guidelines.
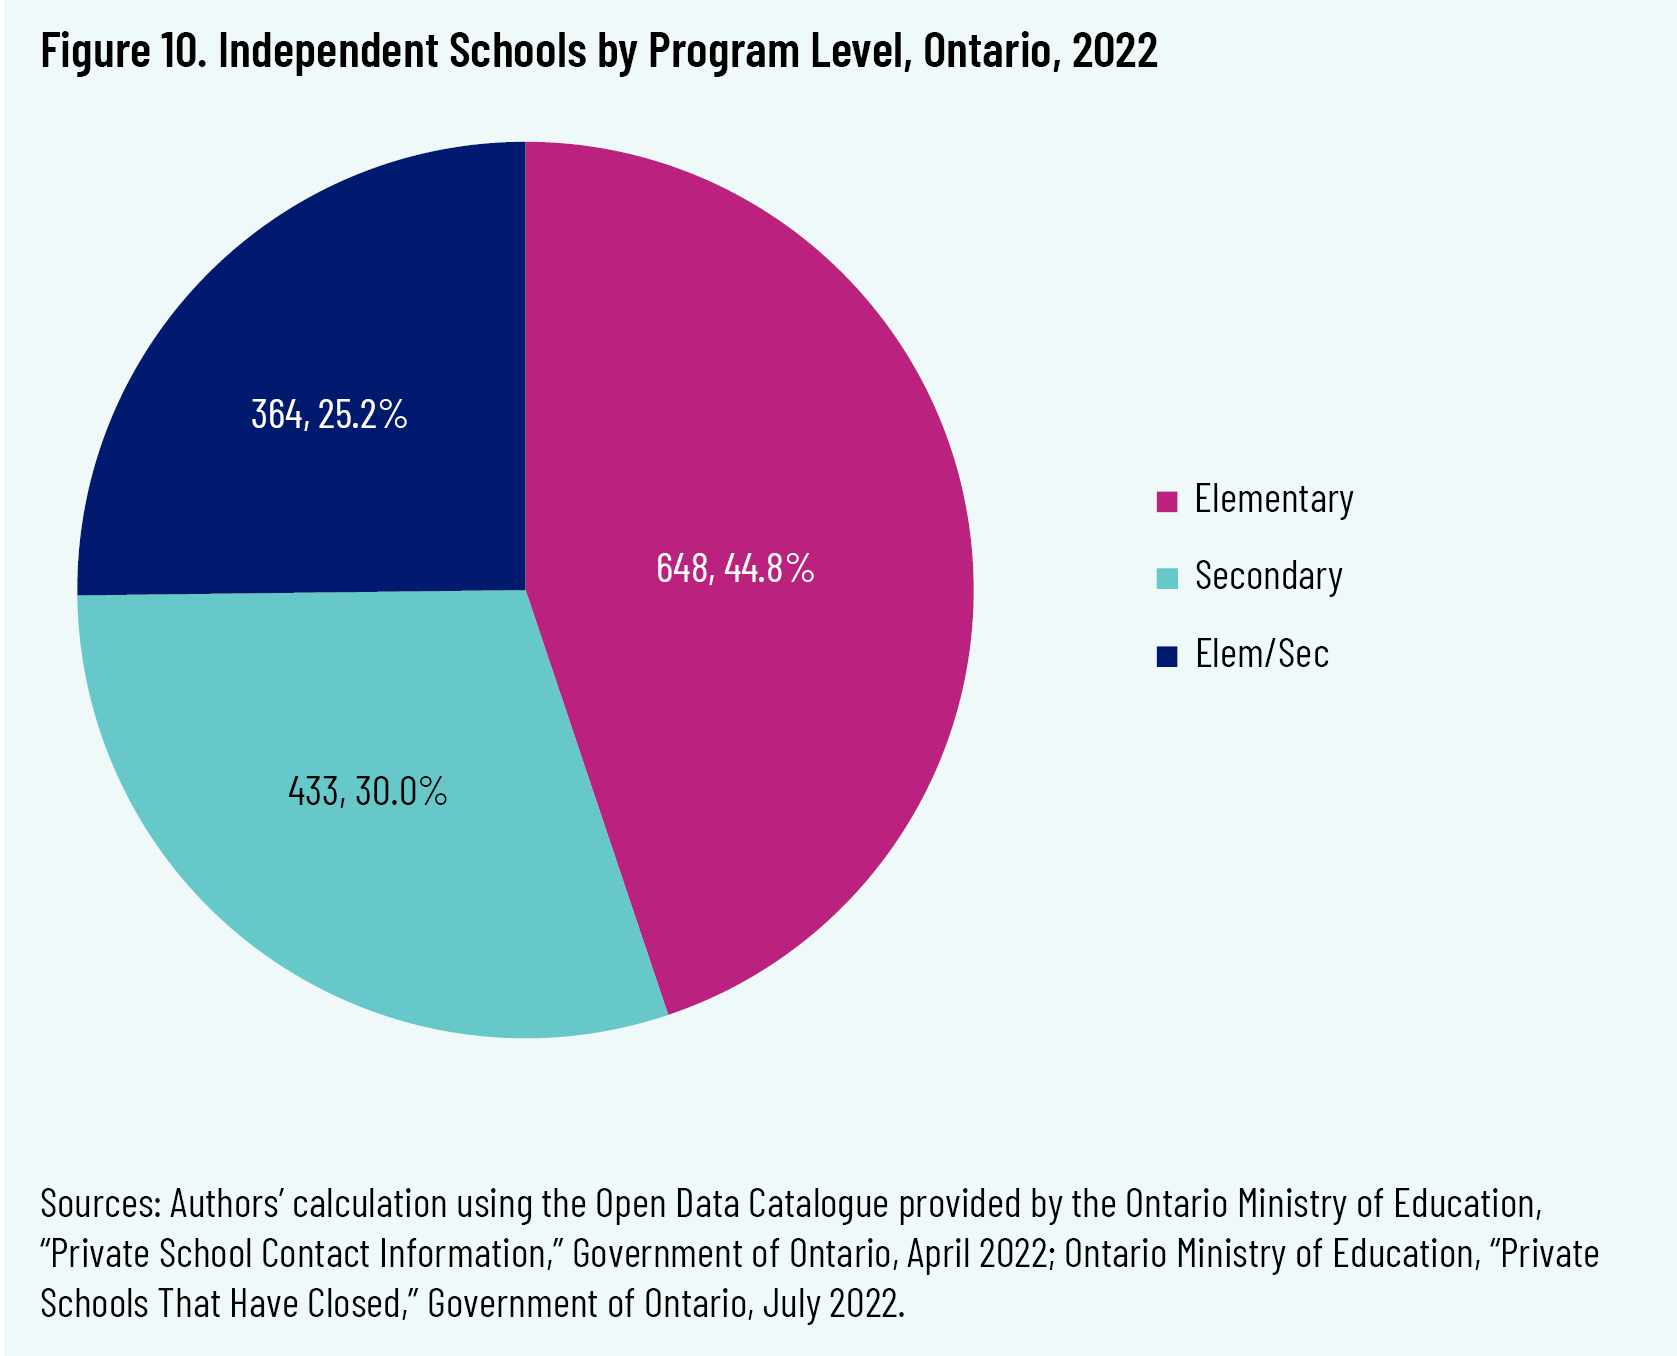
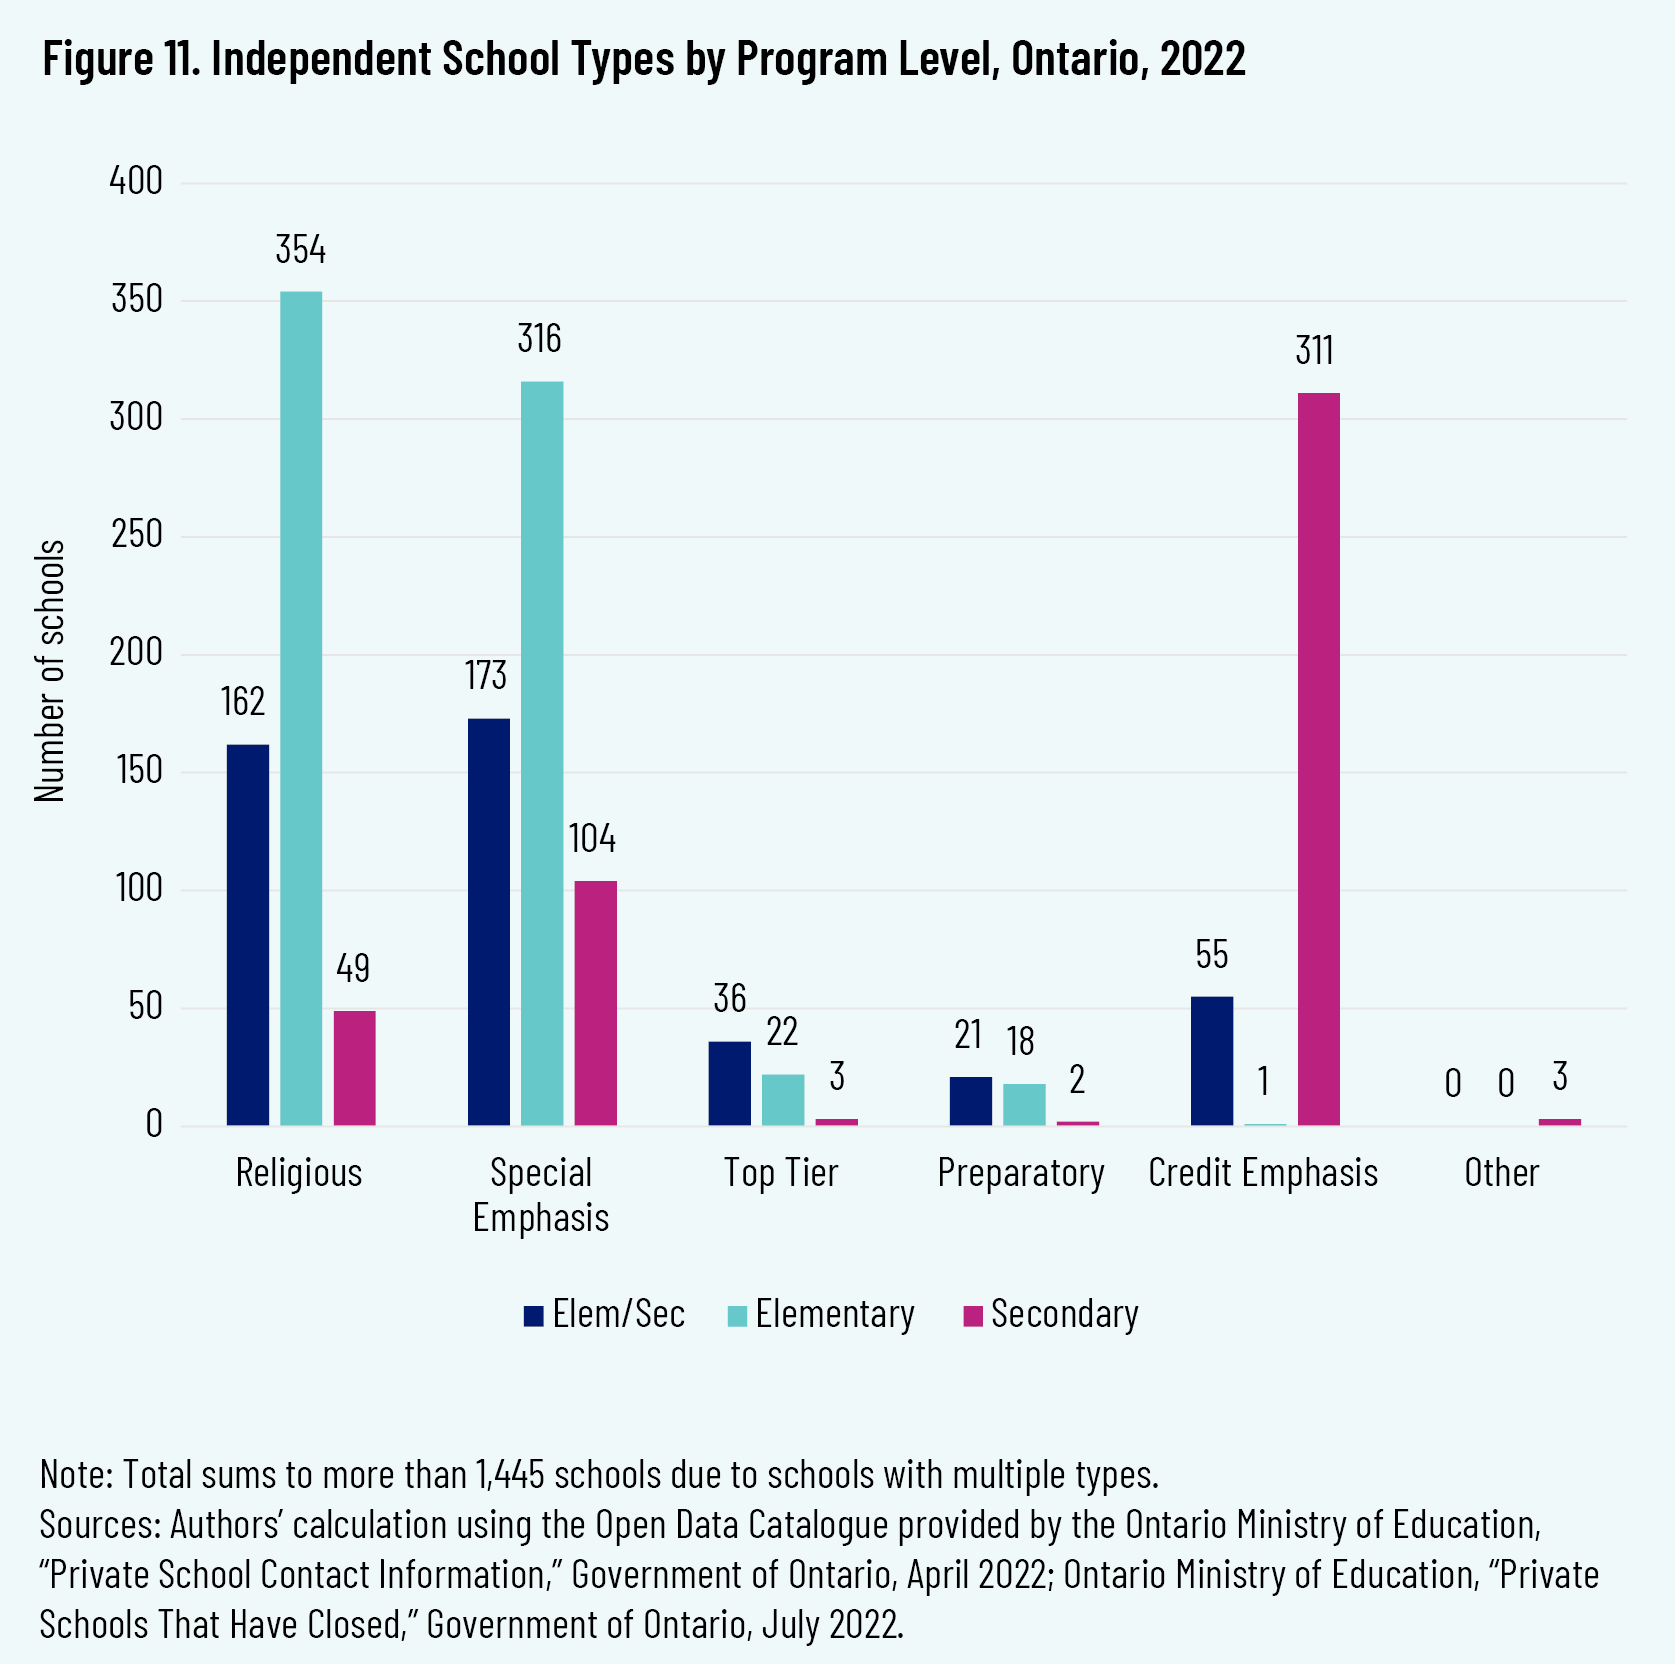
Figure 10 shows that the most numerous program level is elementary-only. Fully 70 percent of Ontario independent schools offer courses at the elementary level: nearly half (45 percent) of the sector is elementary-only, and 25 percent offer both elementary and secondary grades. Combining elementary and secondary levels on one campus in one school is a rare feature of district schools but common in independent schools, as shown in figure 11.
It is noteworthy that a combined program does not necessarily mean that a school offers every grade across the full K–12 range. For example, some schools do not offer the final years of secondary school because their specialized curriculum is difficult to accommodate within the requirements of OSSD credits. Conversely, a Top Tier program may be secondary-level-oriented but begin accepting students in the late elementary years and therefore is listed as a combined Elem/Sec program. Table 5 demonstrates the distribution of enrolment across school types, by program level.
Table 6 shows that growth has predominantly been at the secondary level, where the number of schools has grown at twice the pace of other program levels and enrolment has more than doubled from 2013–14 to 2019–20.
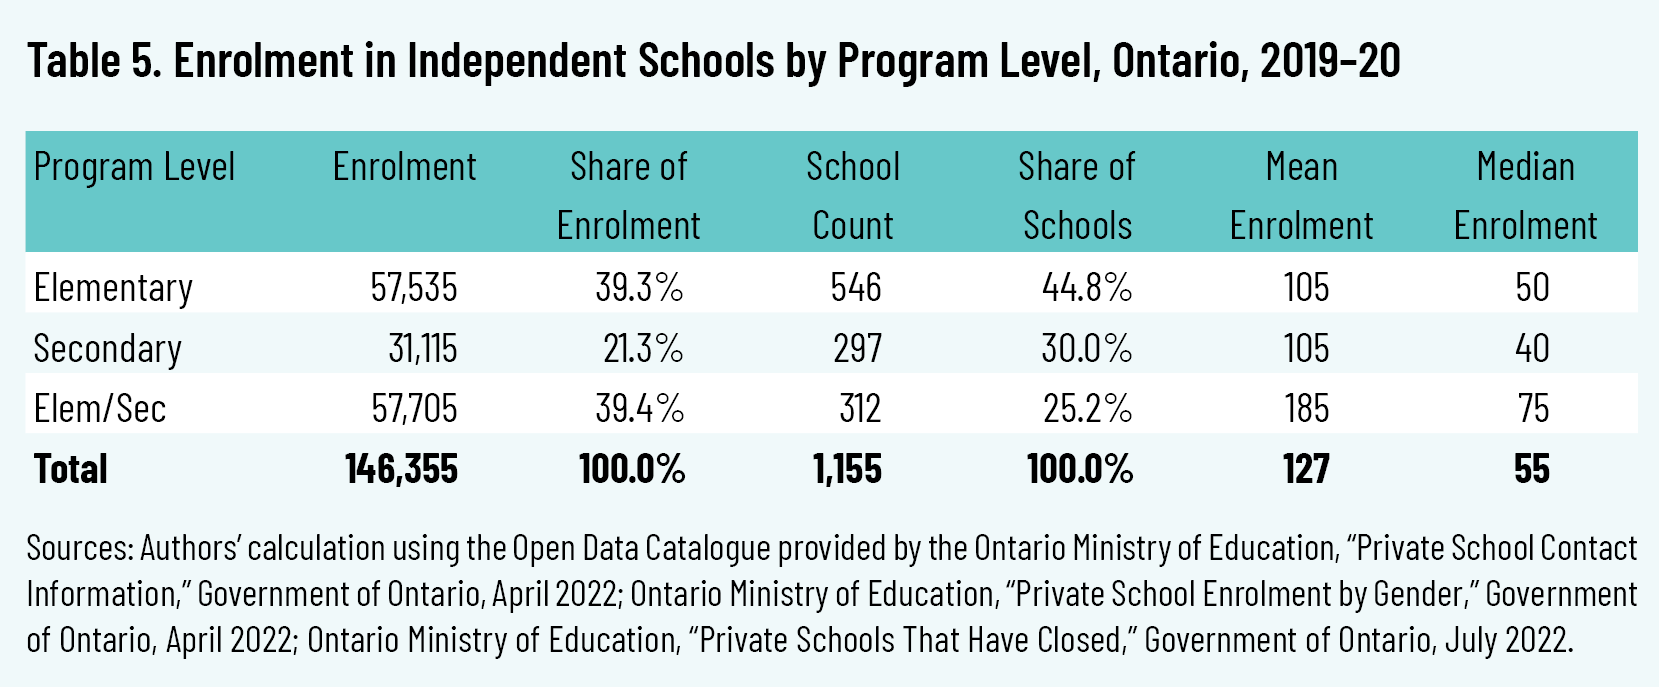
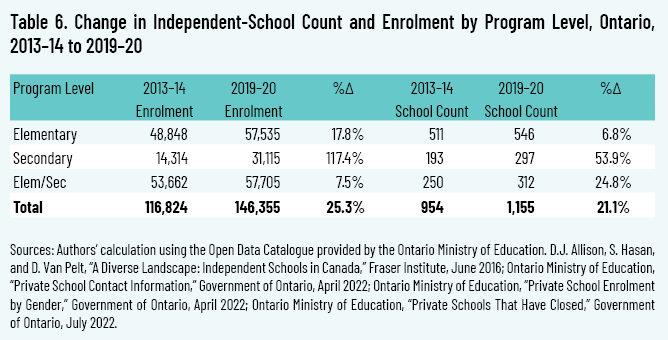
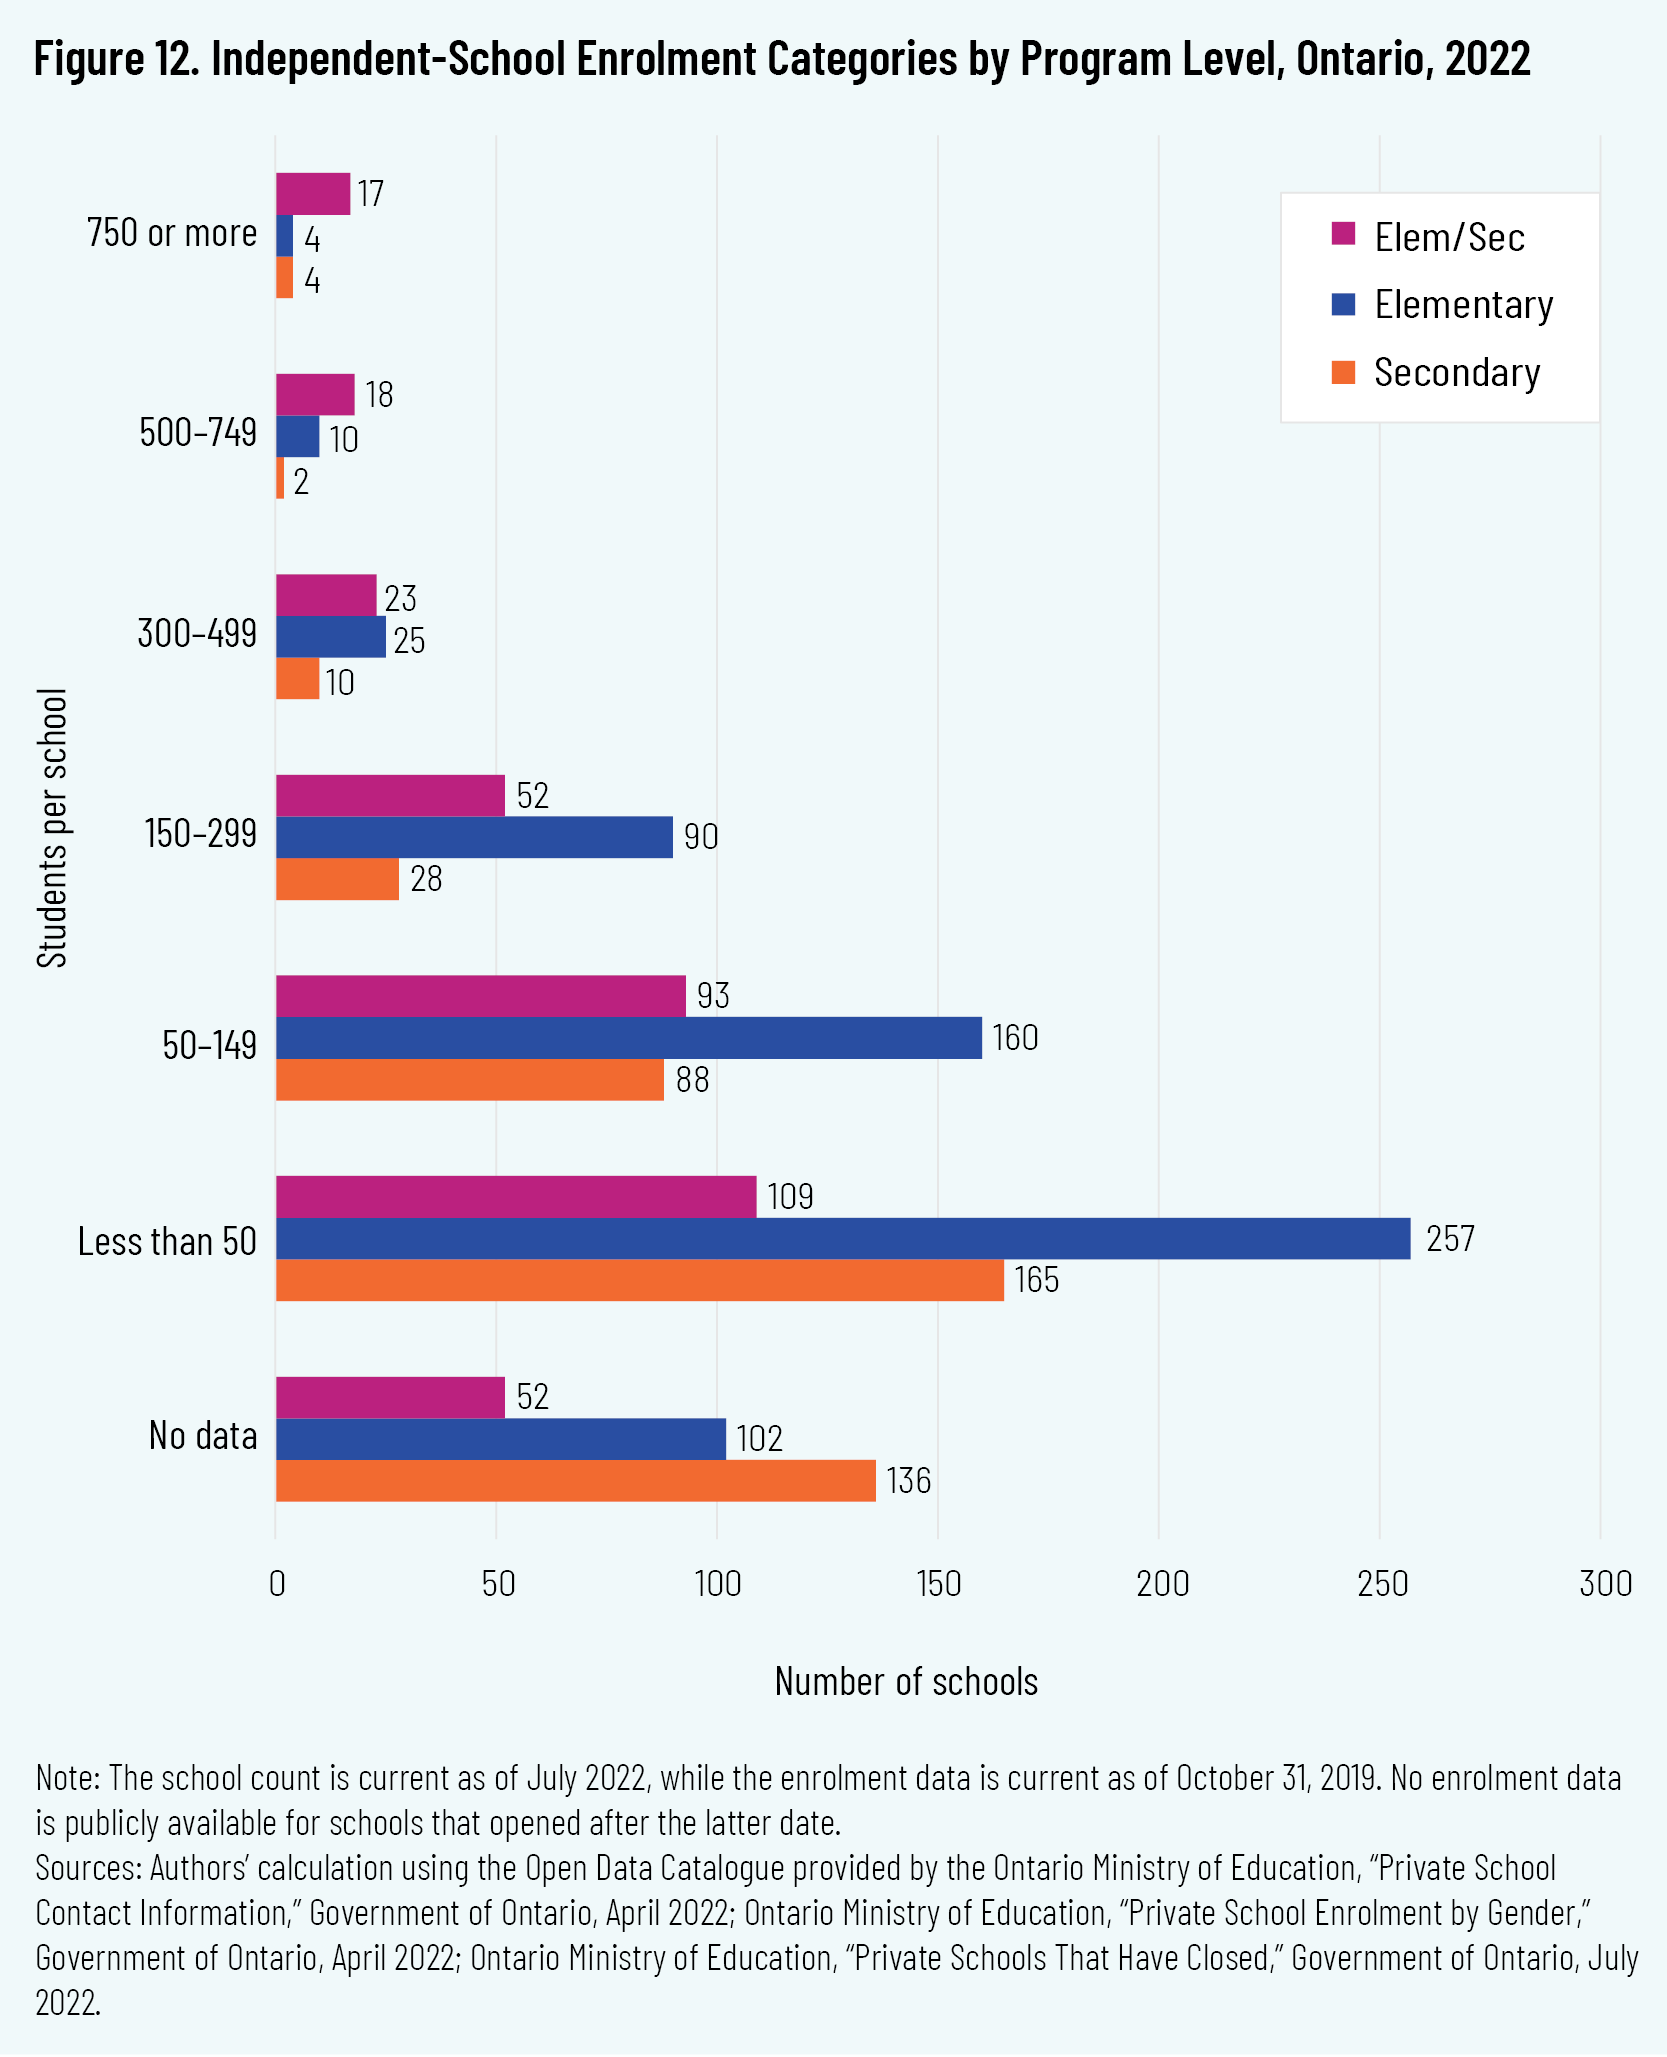
Figure 12 shows that 94.6 percent of secondary-only and 93 percent of elementary-only schools (for which we have enrolment data) have fewer than 300 students. Of the schools with 500 or more students, 63.6 percent are combined Elem/Sec programs.
Distribution by School Subtypes
For two school types, Religious and Special Emphasis, our typology included subtypes. For both sets of subtypes, we present the current school count (July 2022), followed by the most recent enrolment data (2019–20).
Religious
Religious independent schools are the most common primary type in Ontario, at 545 schools, or 37.7 percent of the independent sector. When including schools for which Religious is a secondary or tertiary type, a total of 565 (39 percent) of the schools are Religious. The breakdown by subtype is presented in figure 13.
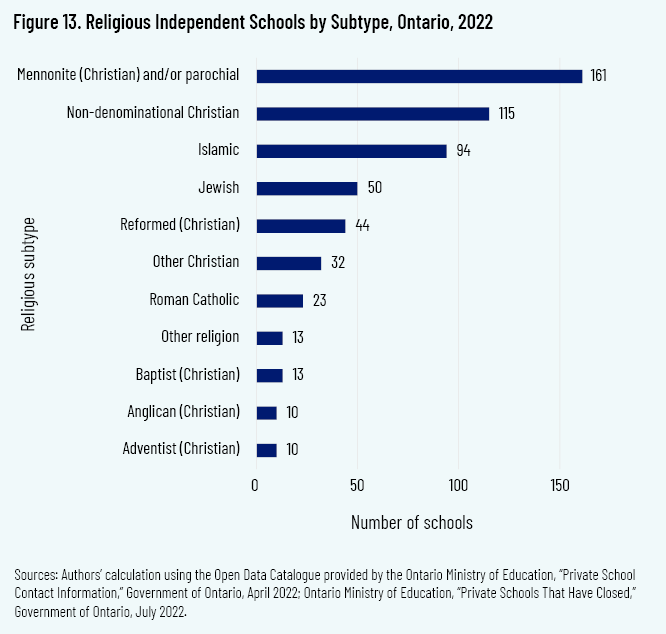
A few findings are important to highlight. The largest group of schools within the Religious type is the 161 Mennonite and/or parochial schools, which make up over one-fourth of all Religious and over one-tenth of the entire Ontario independent-school sector. 46 46 This subtype includes a very small number of non-parochial Mennonite and non-Mennonite parochial schools. For all but one of them, Religious is the primary type. Conversely, just one of the ten Anglican schools is Religious as its primary type; eight are primary-type Top Tier. The Religious subtype with the second-highest school count is Non-denominational Christian, at 115 schools, or one in five Religious schools. It is also noteworthy that even with two taxpayer-funded separate school systems for Roman Catholics (the Anglophone and the Francophone separate systems), there are Roman Catholic schools operating independently in Ontario, which, like all independent schools in Ontario, operate without any public funding. They have increased 53 percent, from 15 schools in 2013–14 to 23 schools in July 2022.
Enrolment data is necessary to further understand the distribution of these schools. For instance, Mennonite schools may have the highest school count, but their student enrolment is only fifth highest. Similarly, the data reveal that while there are nearly twice as many Islamic schools as Jewish schools, total enrolments are similar for both. Table 7 presents the most recent enrolment data for Religious schools by subtype. As this data is from the 2019–20 school year, the school count is different from what is shown in figure 13, since it includes only schools still open and in operation as of July 2022. Of note, as we saw in table 2, Religious schools’ average school size is nearly identical to that of the sector as a whole.
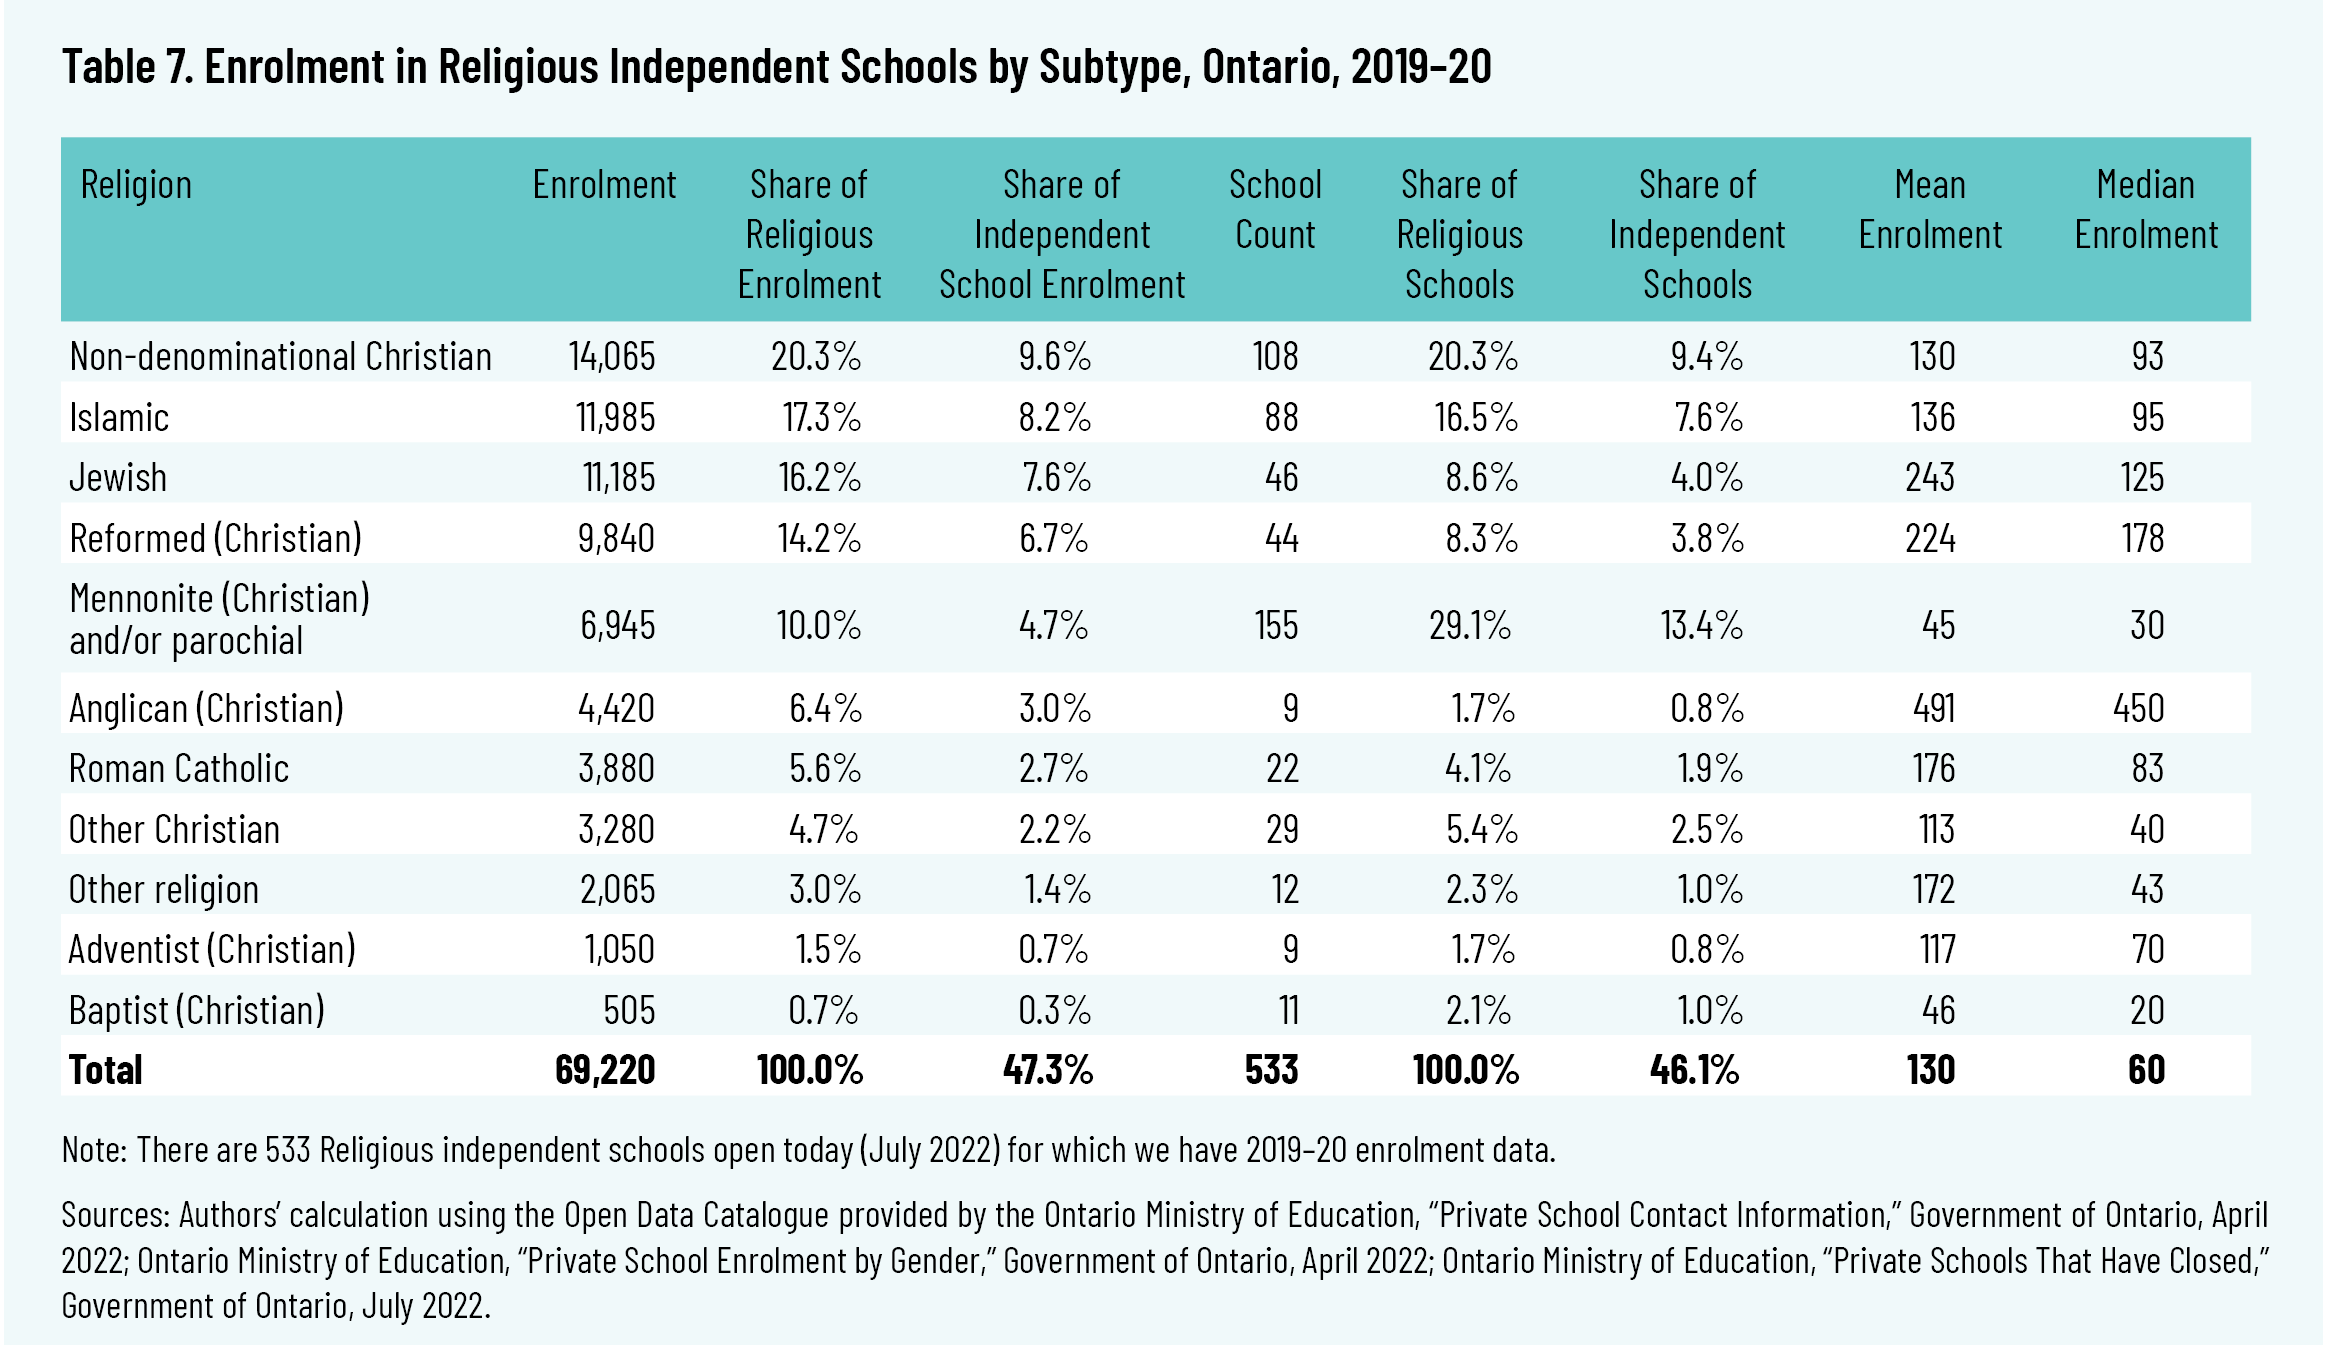
There were 457 Religious schools, with an enrolment of 55,806 students, in 2013–14. As of July 2022, the number of schools has increased by 108 (24 percent). Religious enrolments have increased by 13,414 students (24 percent) between 2013–14 and 2019–20. Compared to the findings of the 2013–14 study, the number of schools has increased for every Religious subtype through 2019–20. Enrolments have increased in every subtype except Jewish, where it has held constant (down less than 1 percent). However, given that our typology applied primary, secondary, and tertiary subtypes, it is possible and even likely that the 16 schools we coded as secondary-level Religious or the four schools we coded as tertiary-level Religious may not have been coded as Religious in the 2013–14 study. If so, then only the 516 primary-level Religious schools for which we have 2019–20 enrolment data are valid for direct comparisons with that earlier research—in which case, the earlier study, in our opinion, understated the presence of Religious independent schools in Ontario. (In this case, Religious schools would have increased by 59 schools, or 13 percent, and 7,939 students, or 14 percent, since 2013–14.)
Special Emphasis
At 593 schools, 41 percent of the sector is classified as Special Emphasis, making this the most prevalent type. For 126 of these schools, however, Special Emphasis is a secondary-level type, and it is a tertiary-level type for 7 schools. Figure 14 ranks by school count the Special Emphasis subtypes that have 10 or more schools. Of note, the list of subtypes is considerably longer than in Allison, Hasan, and Van Pelt’s study, as we believe there is value in identifying a fuller variety of specialty types. This extra level of detail serves to highlight the diversity of the sector. For example, it is worth noting the rise of Nature schools, which frequently have a Distributed Learning component. Such schools were not mentioned in Allison, Hasan, and Van Pelt’s study, and yet there are 46 Nature schools as of July 2022.
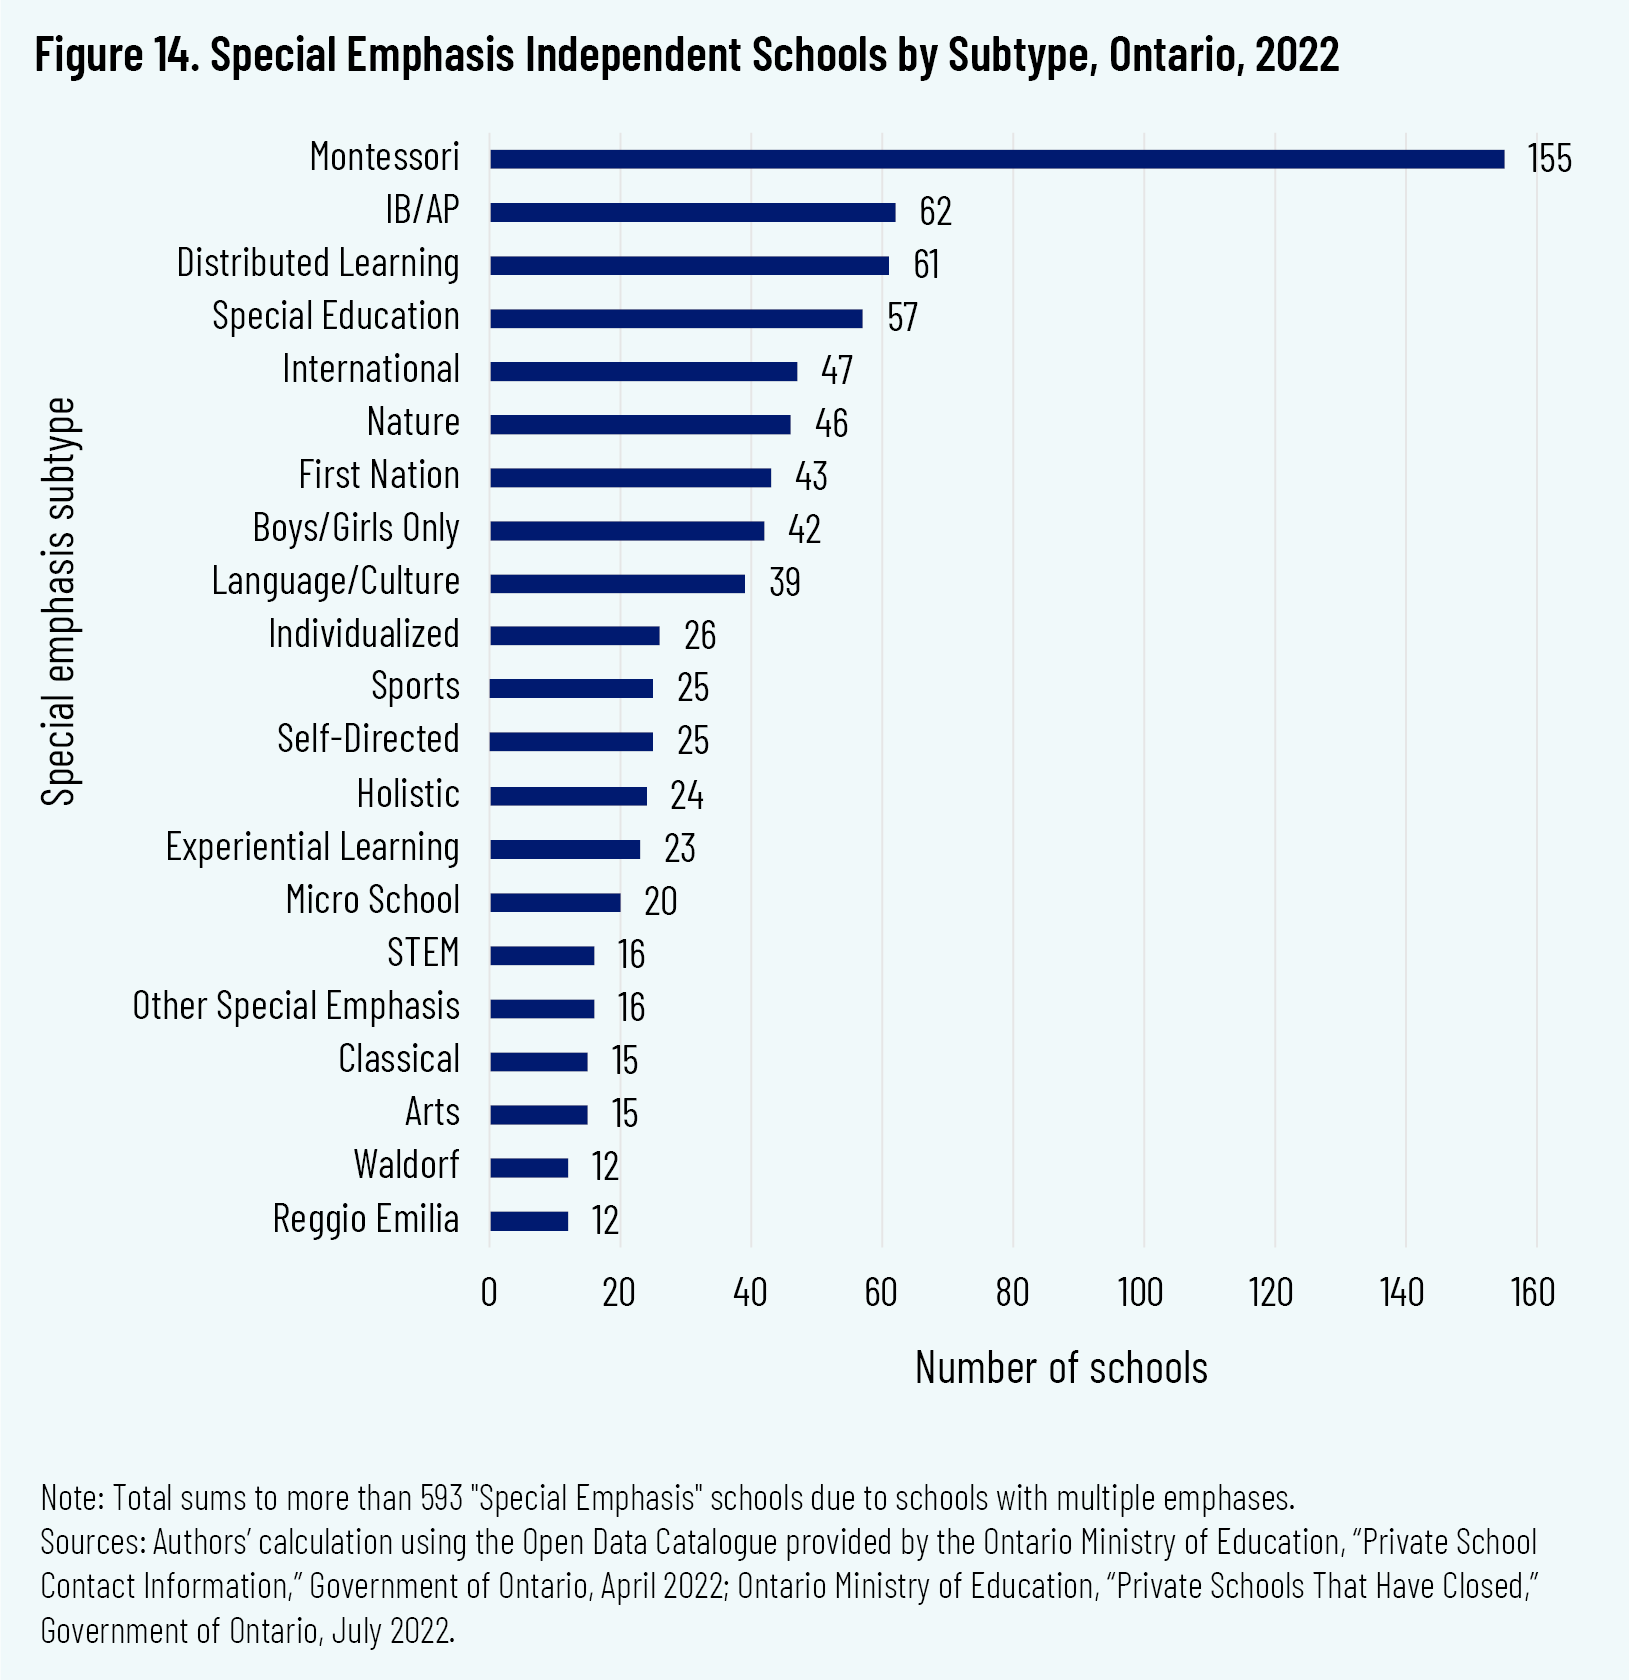
The most common Special Emphasis subtype has long been Montessori schools, which at 155 schools in July 2022 account for one out of four Special Emphasis and one out of ten schools in the entire sector. This is 20 percent growth, or net 26 new schools, since 2013–14. The number of schools with a Special Education emphasis similarly increased, from 45 to 57 (27 percent) in the same period.
It is also unsurprising to see growth in Distributed Learning schools, given North America–wide shifts to blended learning (part online, part in-person) and hybrid schooling (part homeschool, part independent school). What is surprising is the intensity of growth. In 2013–14, there were 11 schools with a Distributed Learning emphasis, and as of July 2022 this subtype has seen 50 new starts, a more than fivefold increase, for a total of 61 schools. This rise is in tandem with the growing popularity of Nature schools, as nearly half the Distributed Learning schools are also Nature schools.
Similarly, the subtype categorized as “Arts, Sports, or STEM” in Allison, Hasan, and Van Pelt has grown over fourfold, from 13 schools in 2013–14 to 56 schools in July 2022. Even Waldorf schools, which increased by just four, experienced 50 percent net growth.
The five aforementioned Special Emphasis subtypes—Montessori, Special Education, Distributed Learning, Arts, Sports, or STEM, and Waldorf—are like-to-like comparisons with Allison, Hasan, and Van Pelt. For these subtypes, the number of schools has increased from 206 in 2013–14 to 332 as of July 2022—a 61 percent increase. But we cannot make like-to-like Special Emphasis comparisons beyond these five subtypes, as we do not know which schools were included in the earlier study under “Other special emphasis” and “Mixed specialty.” Moreover, beyond the five comparable subtypes, our primary-secondary-tertiary approach results in a more generous Special Emphasis count, as without using this approach the Special Emphasis type is underrepresented (as we believe was likely the case in Allison, Hasan, and Van Pelt). Even after controlling for these factors, if we compare only primary-type Special Emphasis subtypes to the combined 2013–14 Other and Mixed categories, the increase in the number of Special Emphasis schools still outpaces the growth of Religious schools.
One subtype that is likely underreported is Special Education, due to major innovations in this category. For example, Cardus’s pandemic-schooling studies have found that special education offerings increased at Edvance schools during the pandemic; these, however, were not “Special Education” schools but various Christian schools that also had special education programs that expanded during this time. 47 47 P. Marcus, D. Van Pelt, and T. Boven, “Pandemic Pivot: Christian Independent Schooling During the Initial 2020 Lockdown,” Cardus, June 2021, https://www.cardus.ca/research/education/reports/pandemic-pivot/; P. Marcus et al., “Pandemic Response: How Christian Independent Schools Responded to a Year of COVID-19,” Cardus, August 2021, https://www.cardus.ca/research/education/reports/pandemic-response-how-christian-independent-schools-responded-to-a-year-of-covid-19/. This is likely the case in other independent (and district) schools. How many students are benefiting from these student support services at independent schools whose primary emphasis is not special education? Such an investigation is beyond our present study, and further research is needed. Additionally, we have observed that the language of “neurodiversity” is increasingly being adopted in place of “special education.” Individualized education programs, for example, are built into strengths-based structures of collective education programs to help students thrive because of their neurodiversity and not despite it. We expect that this is the new norm and not the exception, but further research is needed to understand the shifts in this category.
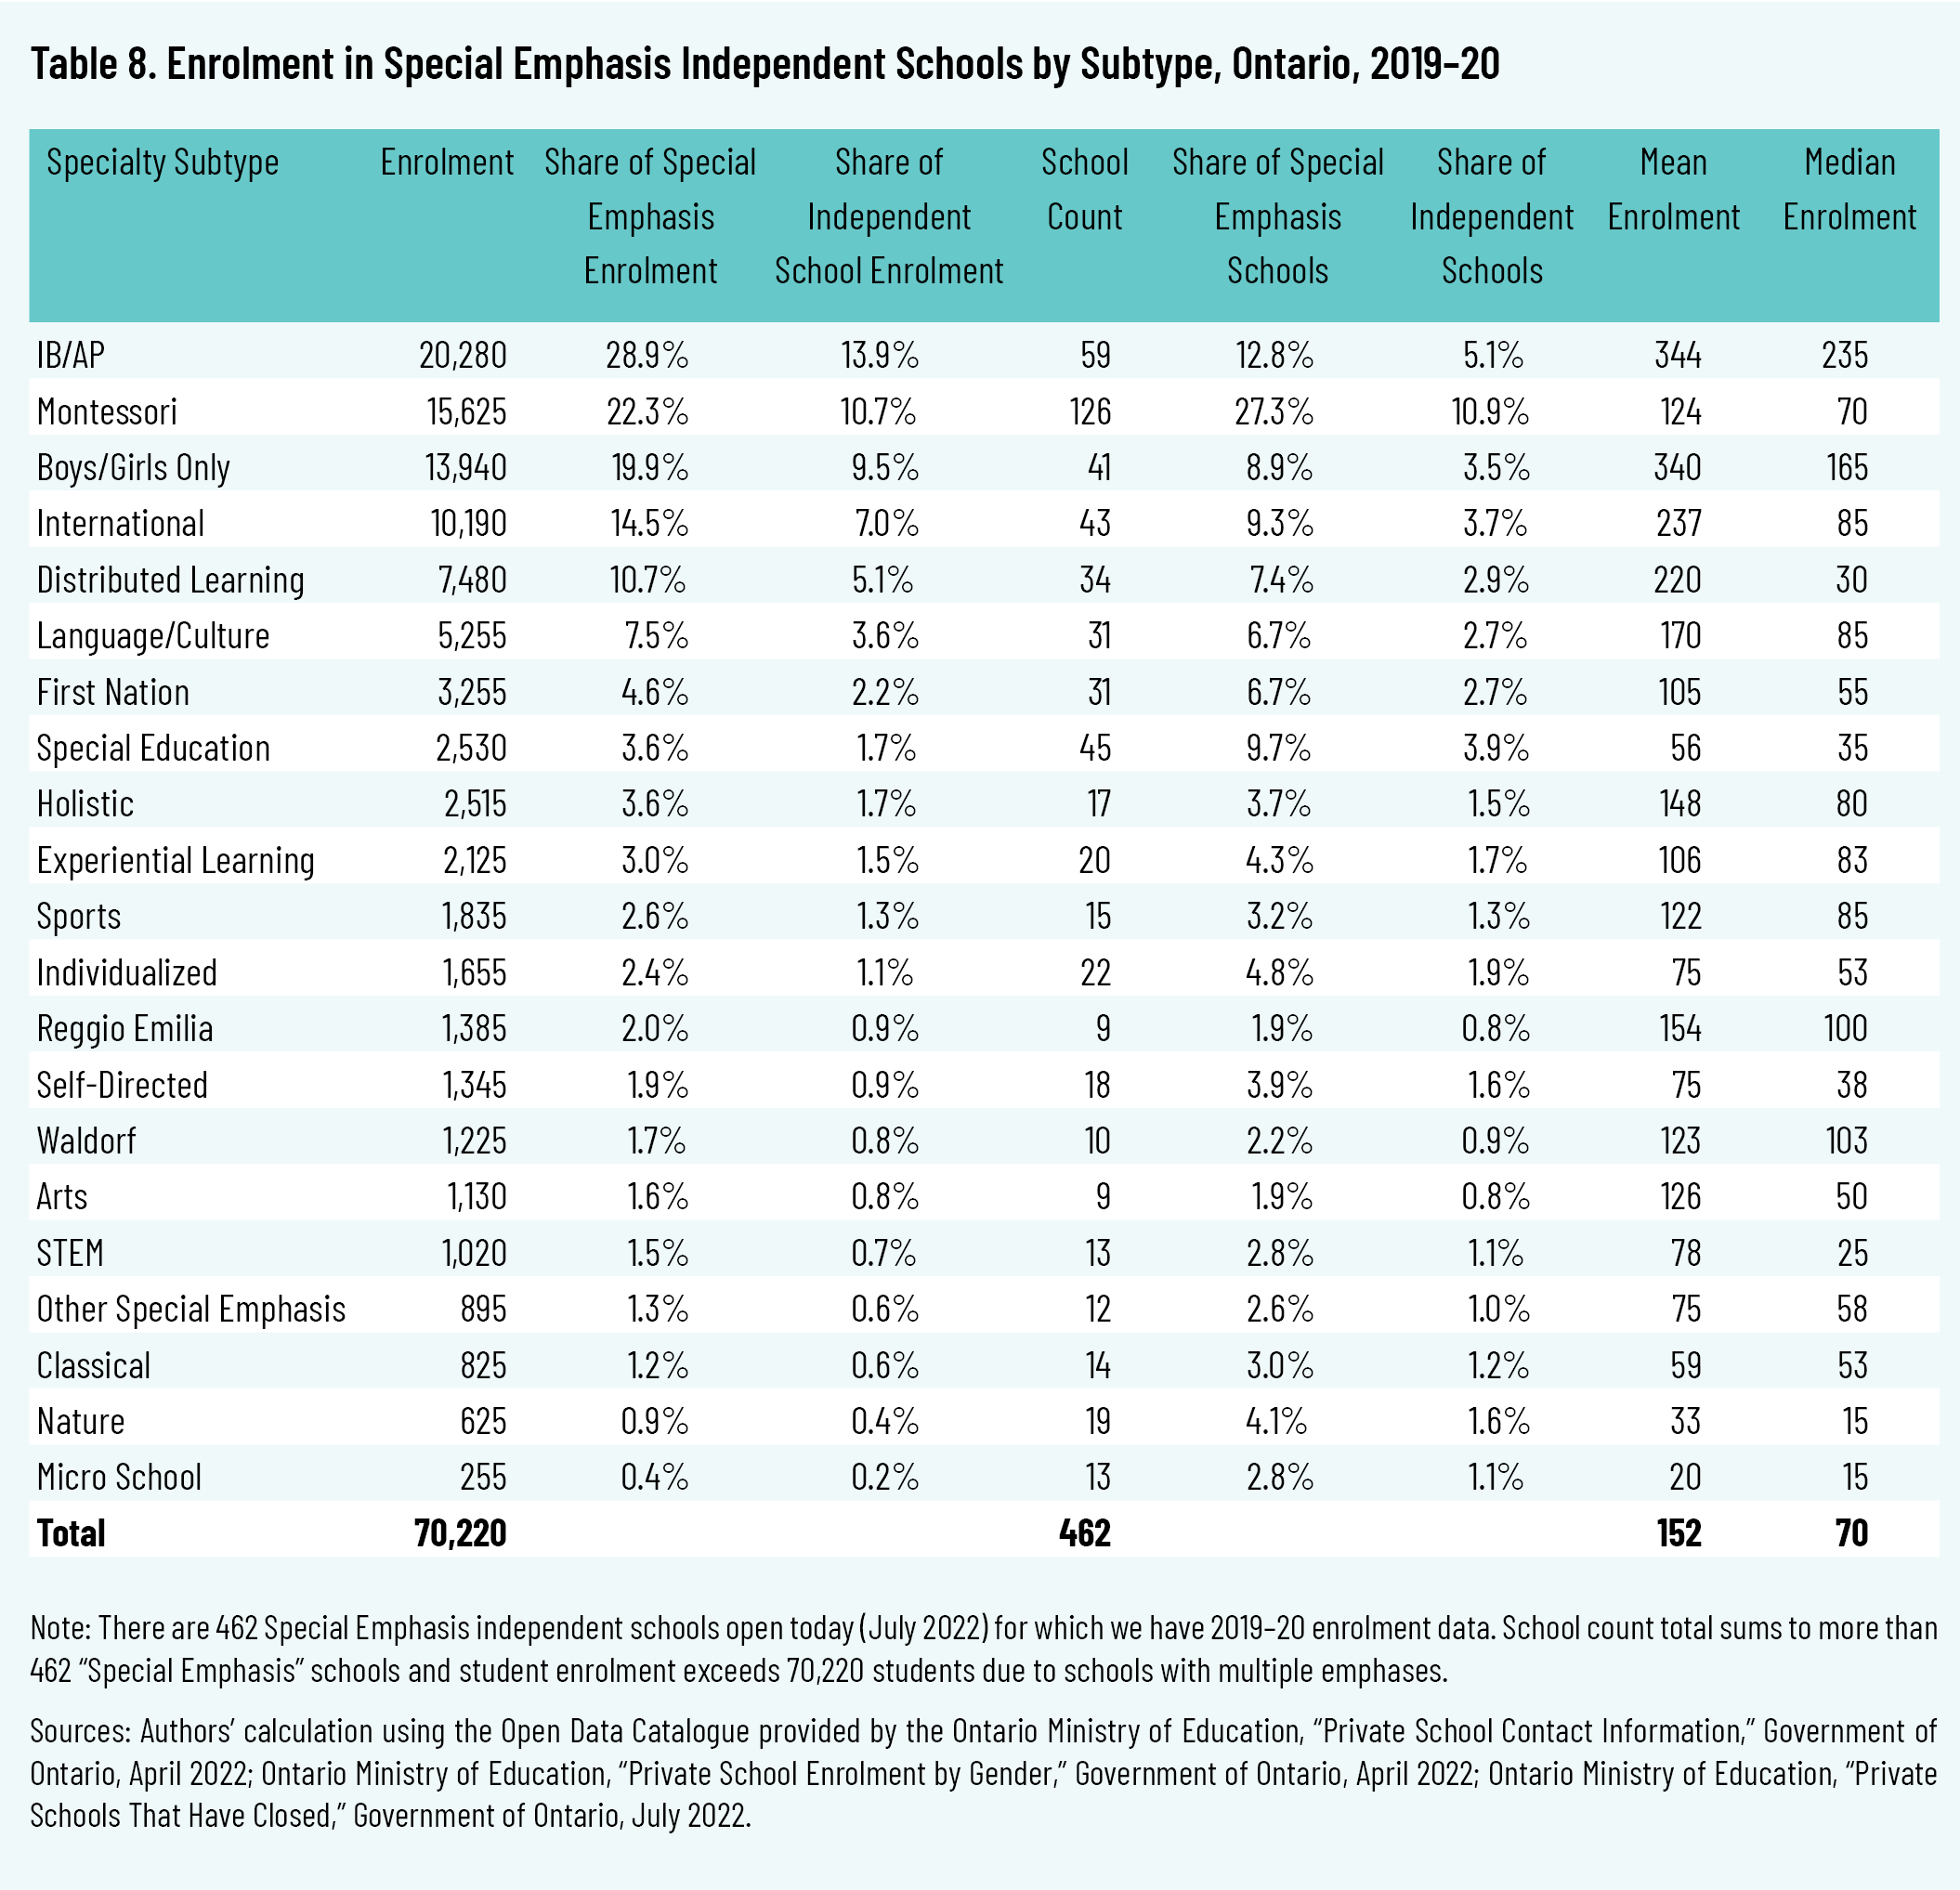
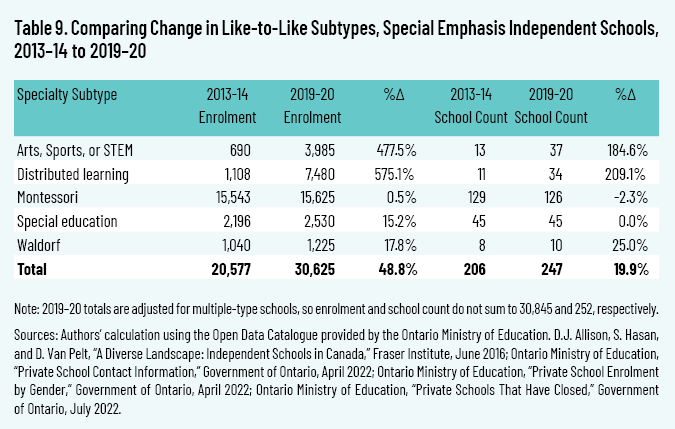
Additional insights can be found by looking at enrolment. Table 8 presents the most recent enrolment data, with the adjusted school counts for 2019–20. Table 9 compares the adjusted 2019–20 data with 2013–14. Special Emphasis enrolment is growing at more than twice the rate of the net school count. Thus, not only is the number of Special Emphasis schools increasing, but these schools are also seeing their enrolments swell. Importantly, this increase in enrolment is likely at an increasing rate. Consider that all of the student enrolment data are pre-pandemic (as of October 31, 2019) and the school count data accounts for all school closures up to July 2022. In other words, half the net new Distributed Learning schools, nearly half of the net new Arts/Sport/STEM schools, and all the net new Montessori and Special Education schools have emerged since November 2019—and likely since March 2020, presumably in response to COVID schooling.
Distribution by Residence
We coded 65 schools that stated that they were boarding schools—that is, providing on-site residences. They constitute 4.5 percent of the sector. Many schools also offer international homestay options; however, these were excluded by our criteria. Nearly half of these boarding schools (30 schools, or 46 percent) are the Credit Emphasis type (27 primary-type, 3 secondary-type). Similarly, 15 primary-type and 16 secondary-type Special Emphasis schools have residences for boarding. Perhaps surprisingly, only 23 percent of Top Tier schools are boarding schools (and all are primary-type Top Tier). Twelve Religious schools (6 primary-type, 3 secondary-type, 3 tertiary-type) and three Preparatory schools (all primary-type) are also in this category.
When further research is conducted on Credit Emphasis and International schools, consideration should be given to exploring the nature of boarding schools and international homestay programs in Ontario.
Distribution by Accreditation and Memberships
Credit Granting
The Ontario Secondary School Diploma, or OSSD, is the certificate that the province grants upon high school graduation. Universities in Canada, the US, and elsewhere recognize the OSSD, and thus it is perceived as a valuable credential for students seeking university entrance (however, top-ranked universities do not require OSSD credits). Independent schools that desire to offer credits toward an OSSD must apply for government approval and maintain this approval through inspections every two years. Extensive compliance with Ministry policy, procedures, and curriculum is required. As figure 15 presents, 636 schools (44 percent) offer credits toward the OSSD, 14 schools (1 percent) have an application pending, and 795 schools (55 percent) do not offer OSSD credits. Fully 92 percent of secondary-only schools offer OSSD credits, as do 63 percent of combined elementary/secondary schools, as shown in figure 16.
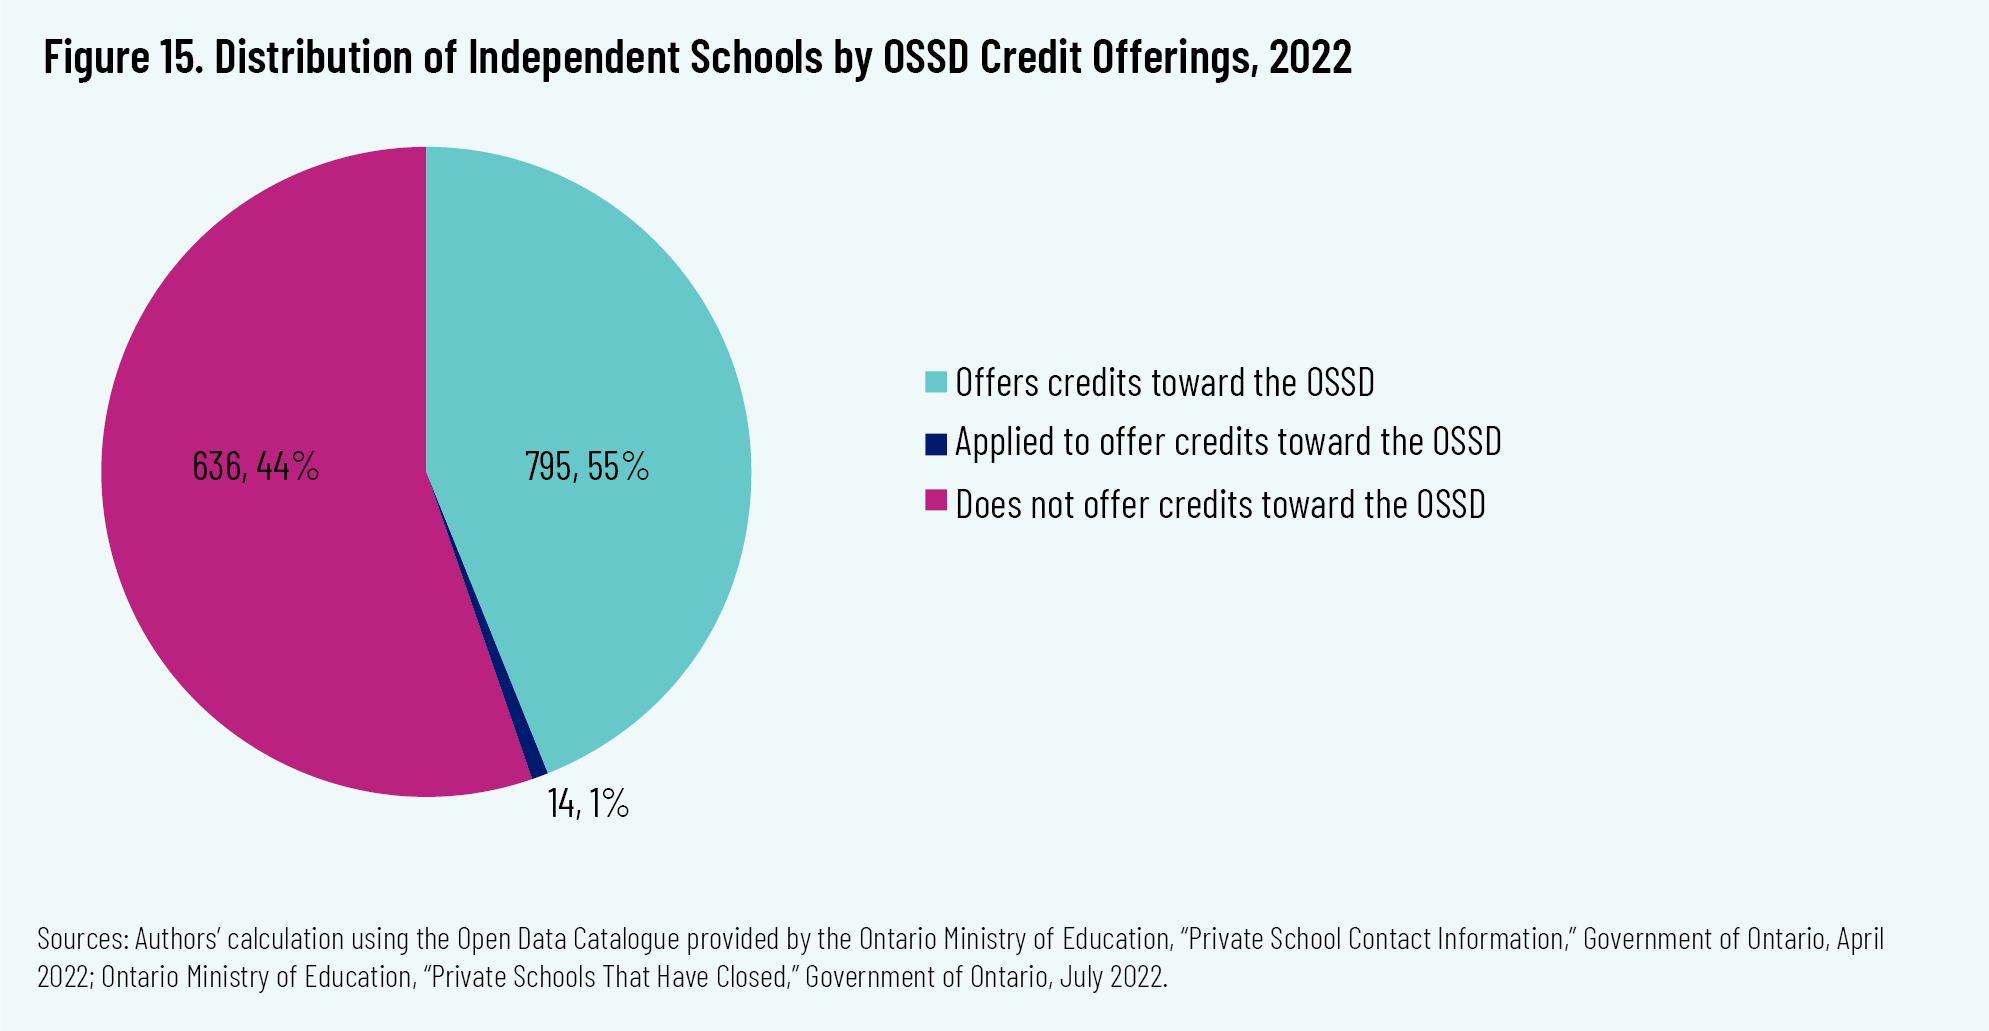
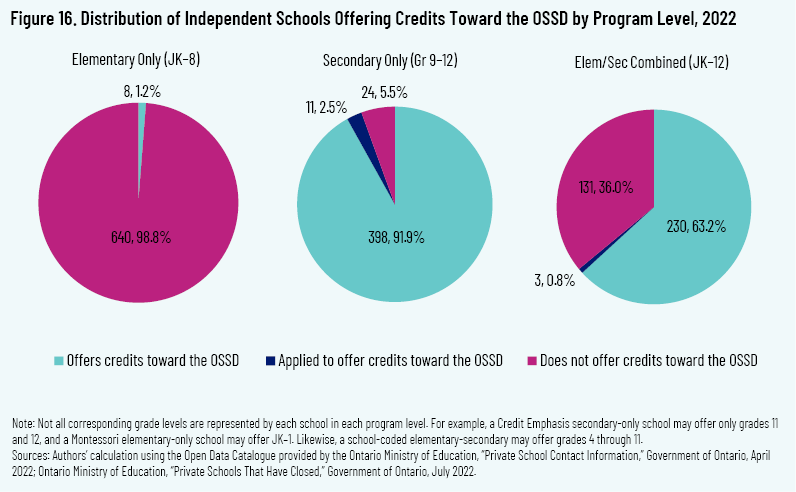
Figure 17 presents credit granting by program type. Fully 81 percent of online-only schools offer credits toward the OSSD, while only 27 percent of in-person-only schools do (as most site-based-only schools are elementary schools, and hence, are much less likely to offer OSSD credits, per figures 8 and 16). Just 12 percent of OSSD-offering schools are online-only, and half of the schools that offer OSSD credits are blended schools.
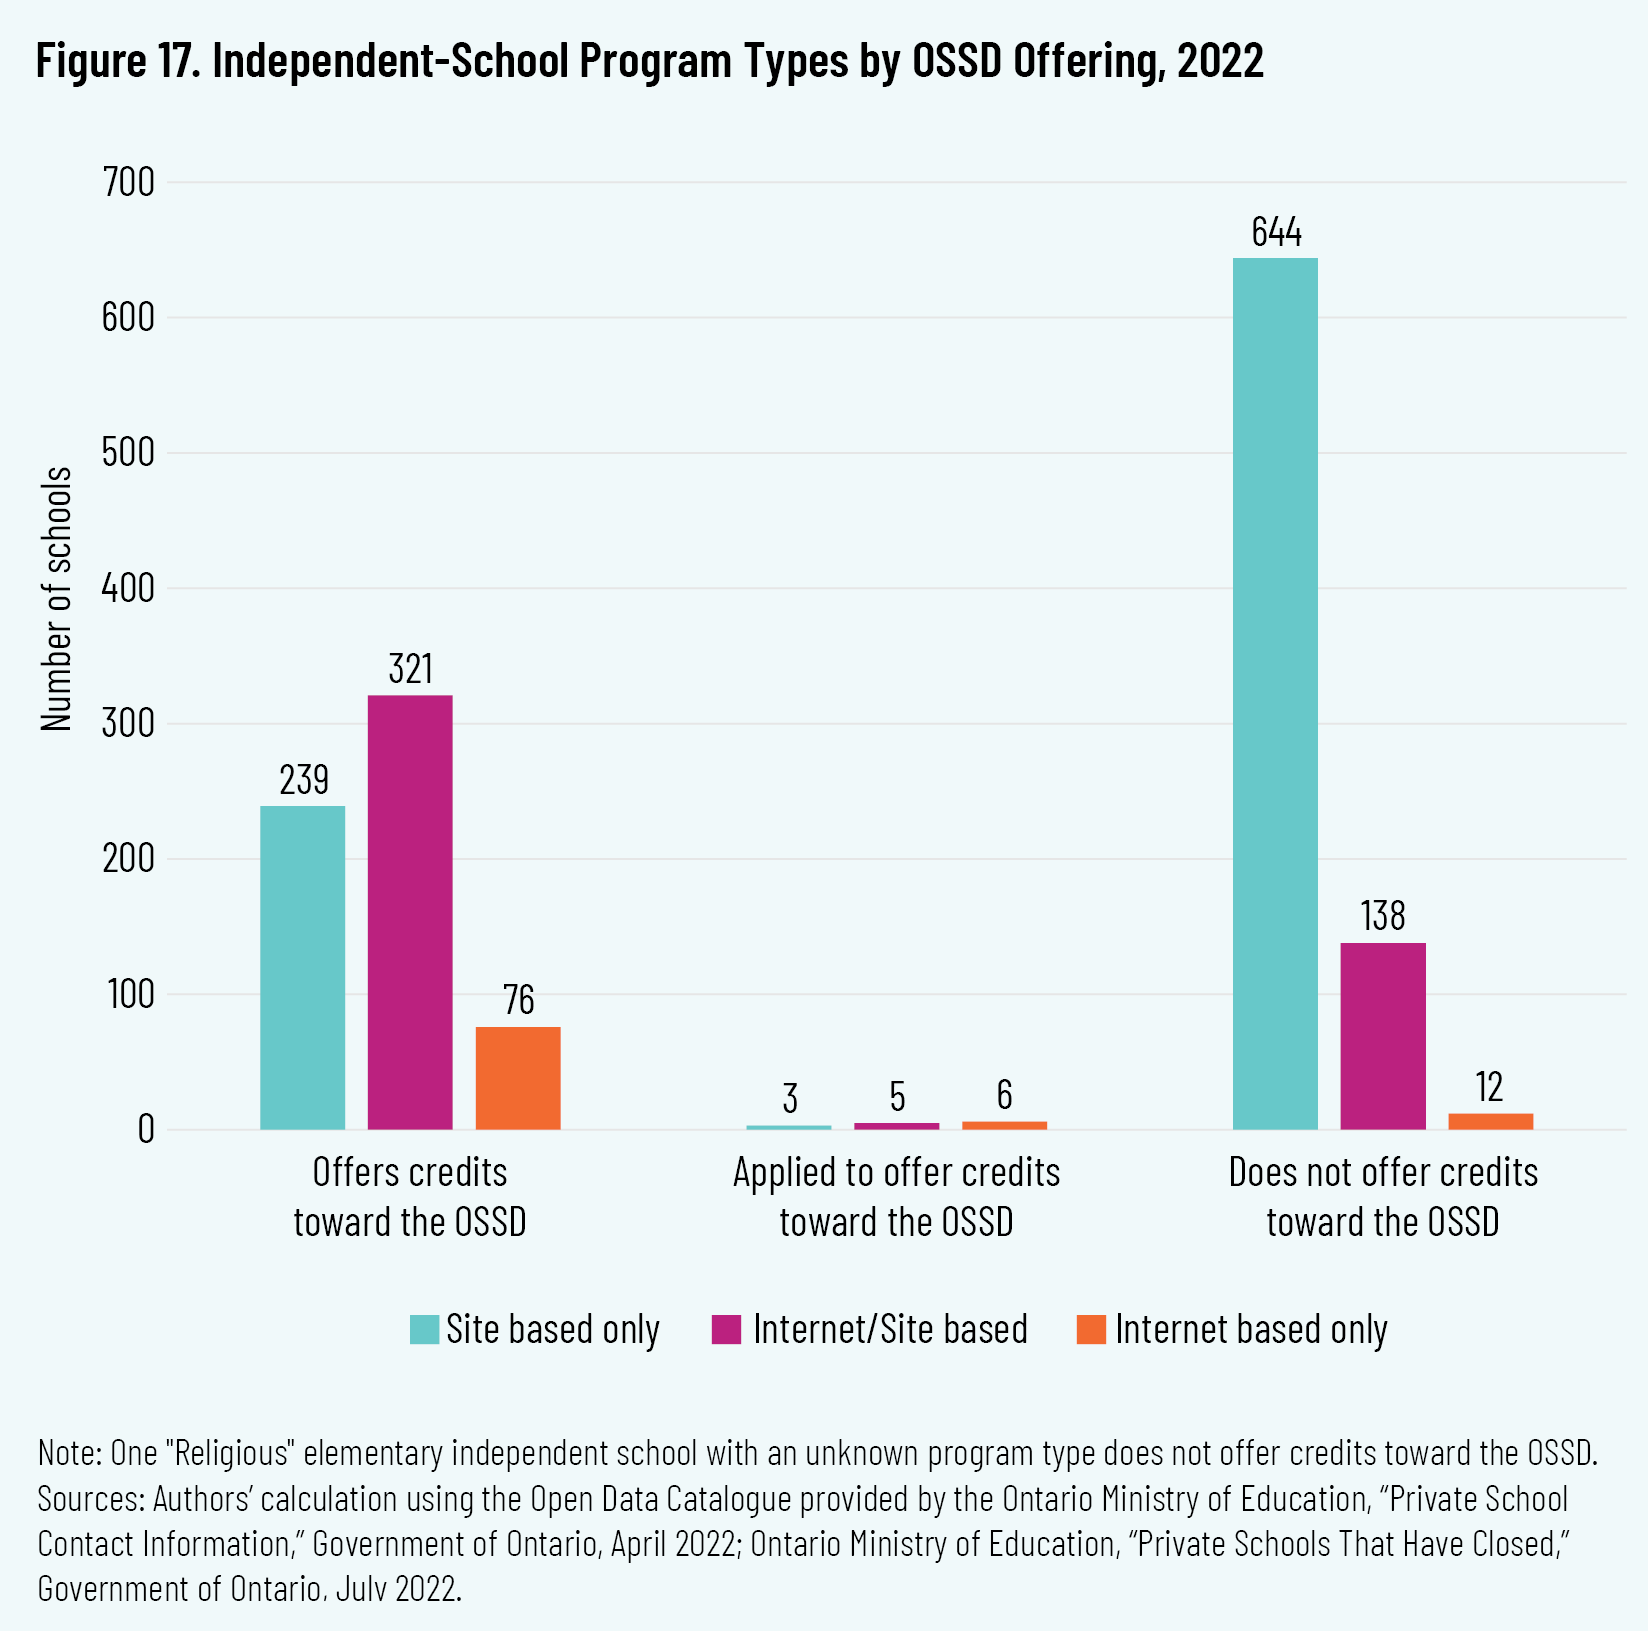
Figure 18 shows the distribution of OSSD-offering versus non-OSSD-offering schools by school type. Four out of five Religious schools do not offer credits toward the OSSD; nearly two-thirds of Religious schools are elementary-only institutions (figure 11). Similarly, nearly two-thirds of Special Emphasis schools do not offer OSSD credits; however, 53 percent of Special Emphasis schools are elementary-only (figure 11). By contrast, 63.9 percent of Top Tier and 63.4 percent of Preparatory schools offer OSSD credits; many of these are K–12 schools.
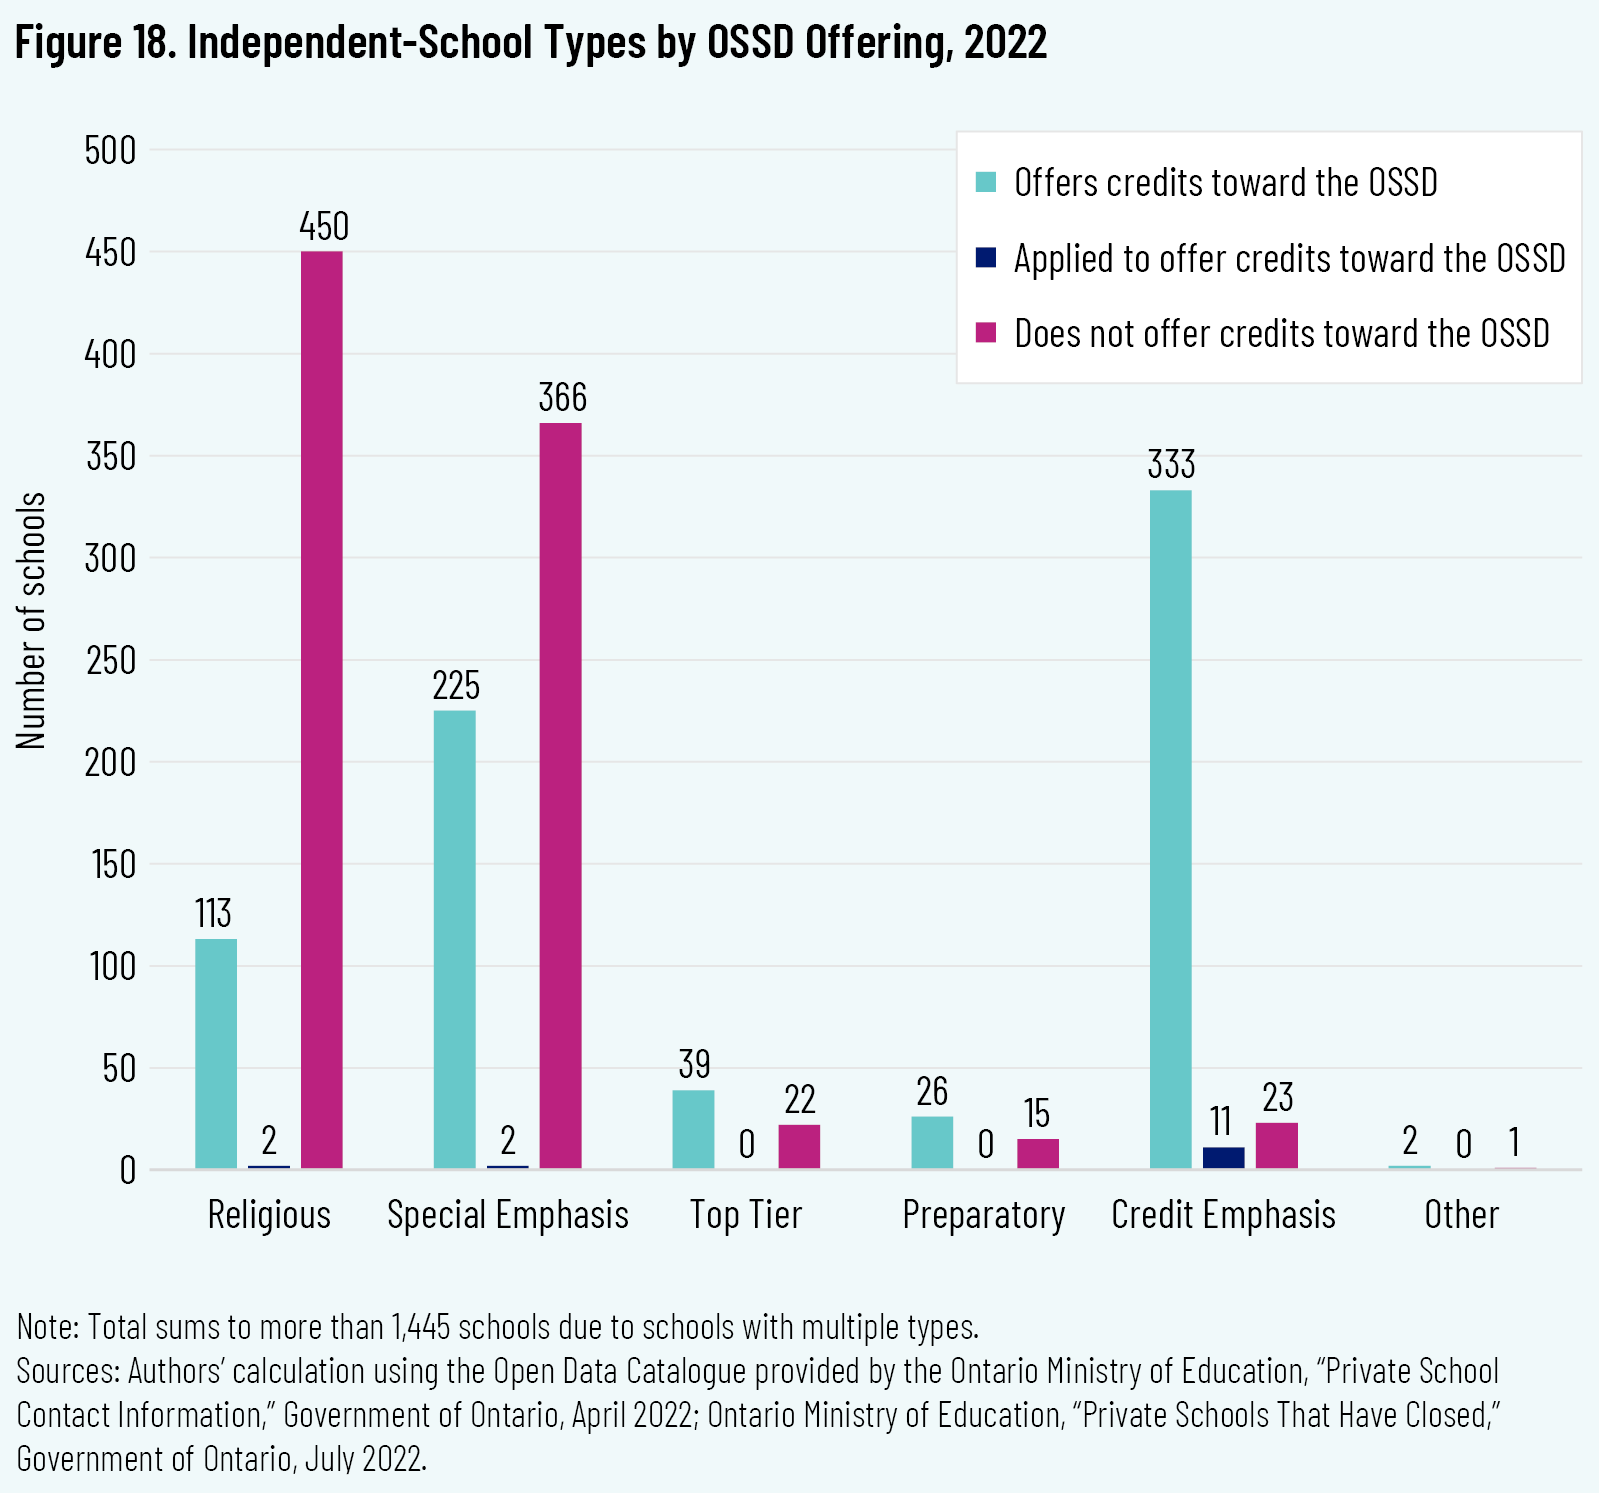
Of the 636 schools that offer credits toward the OSSD, 52.4 percent are Credit Emphasis. Given that this is the majority of credit-granting schools in the sector, we have another imperative to further study the Credit Emphasis type. Also of note, some schools that claim to offer credits toward the OSSD are not listed in the Open Data Catalogue as offering them; hence, 91 percent, rather than 100 percent, of Credit Emphasis schools offer OSSD credits. As stated in the “Typology” section, our analysis suggests that some of these are legitimate schools, but for others, the quality of program and motive for operation may not be in the public’s best interest.
School Associations
Many independent schools share resources and form bodies of accreditation and accountability in order to facilitate stability and growth. There are at least two reasons to categorize by school association. First, such affiliations help reveal shared aspects of identity. Second, examining school communities through the lens of association affiliation reveals an additional layer of oversight, accountability, and independence beyond that of the individual school’s governing board. 48 48 The first study of Canada’s independent-school associations was D. Van Pelt and P.J. Mitchell, “Mapping Independent School Associations in Canada,” Cardus, September 2018, https://www.cardus.ca/research/education/reports/mapping-independent-school-associations-in-canada/. In total, we identified 147 distinct school associations with which at least one independent school in Ontario claimed a relationship. Some of these associations offer more than one level of relationship—“member,” “affiliate,” and so on—each of which has its own definition. Our study did not extend to examining this more granular level of relationship, and this remains an important subject for future research. For the 15 associations that have more than 10 Ontario member or affiliate schools and that operate a website, we verified school membership or affiliation in their web-based directories. Further research is necessary to explore all associations in detail; for the 132 associations (90 percent) with 10 or fewer schools self-reporting affiliation, we did not visit the association website.
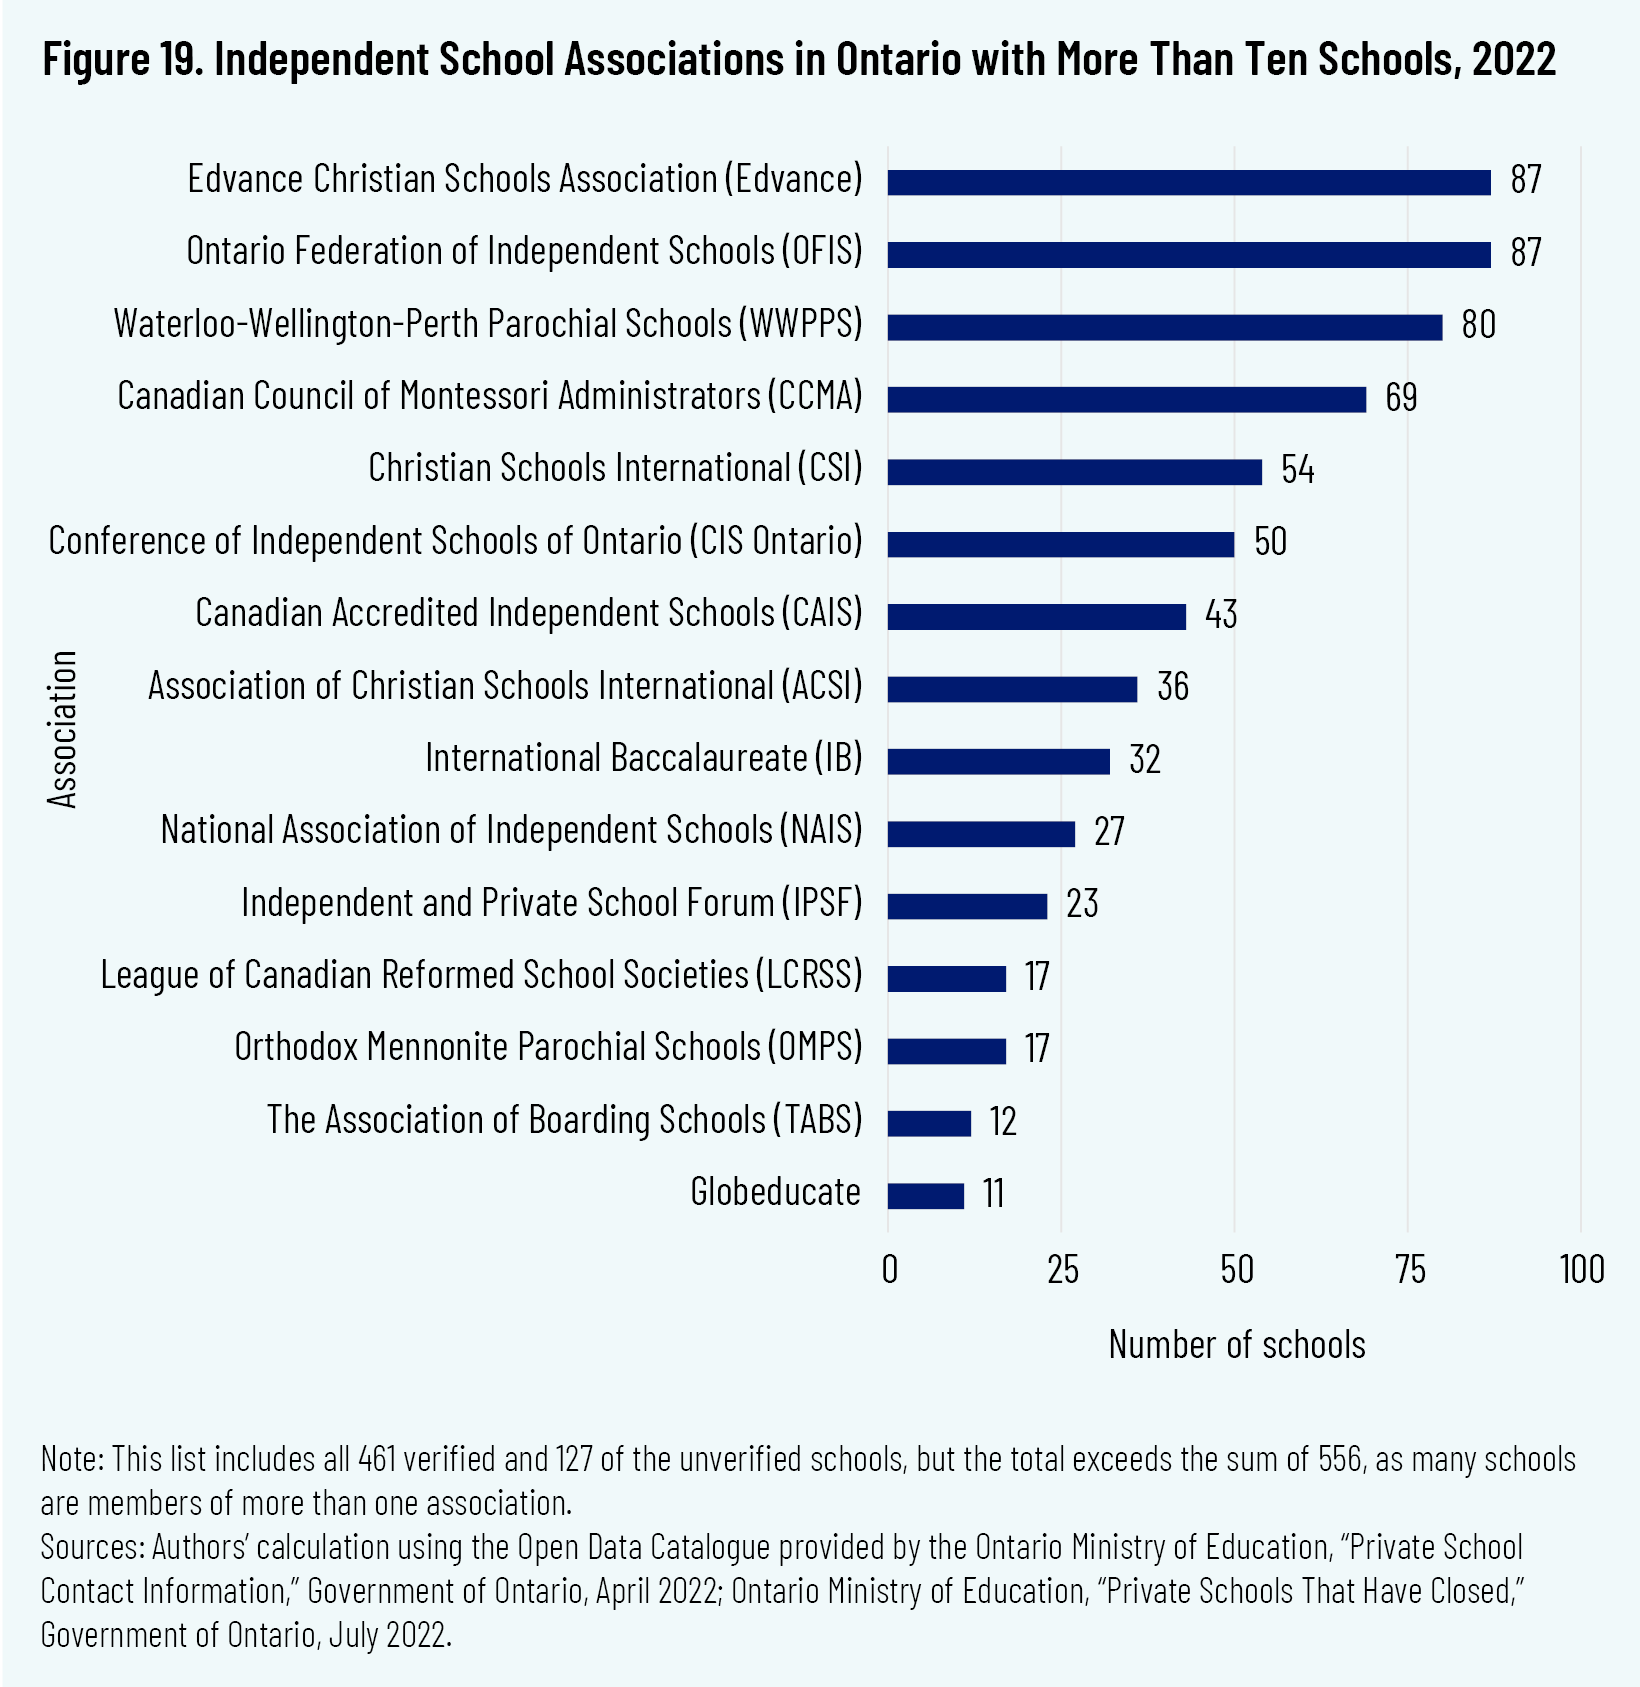
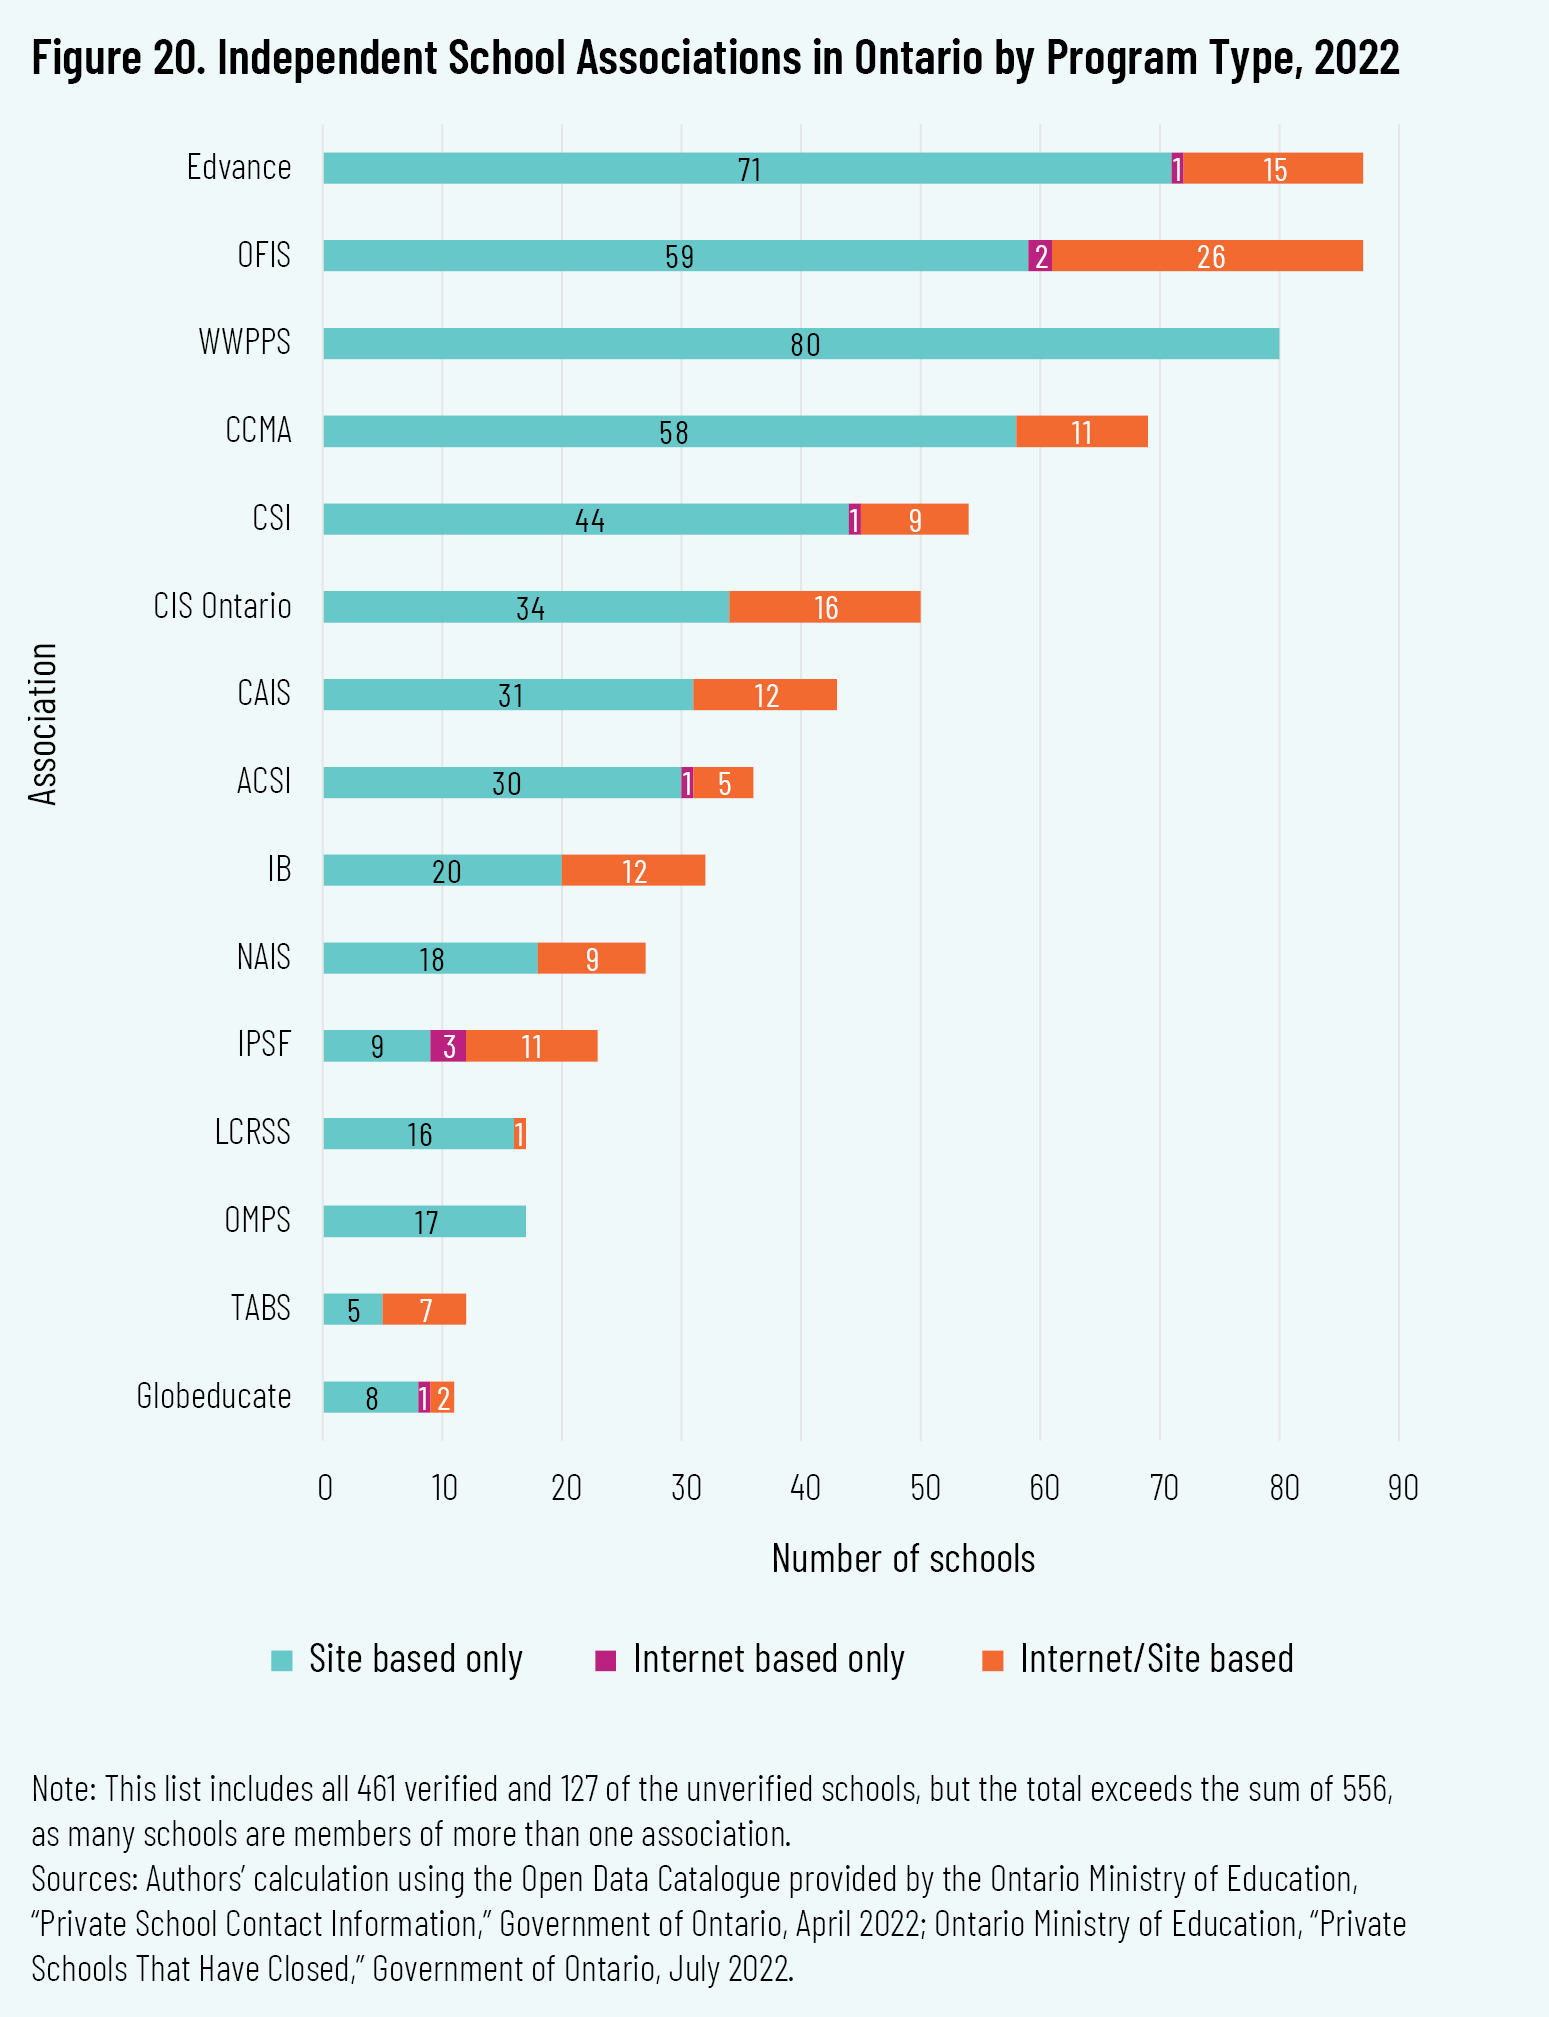
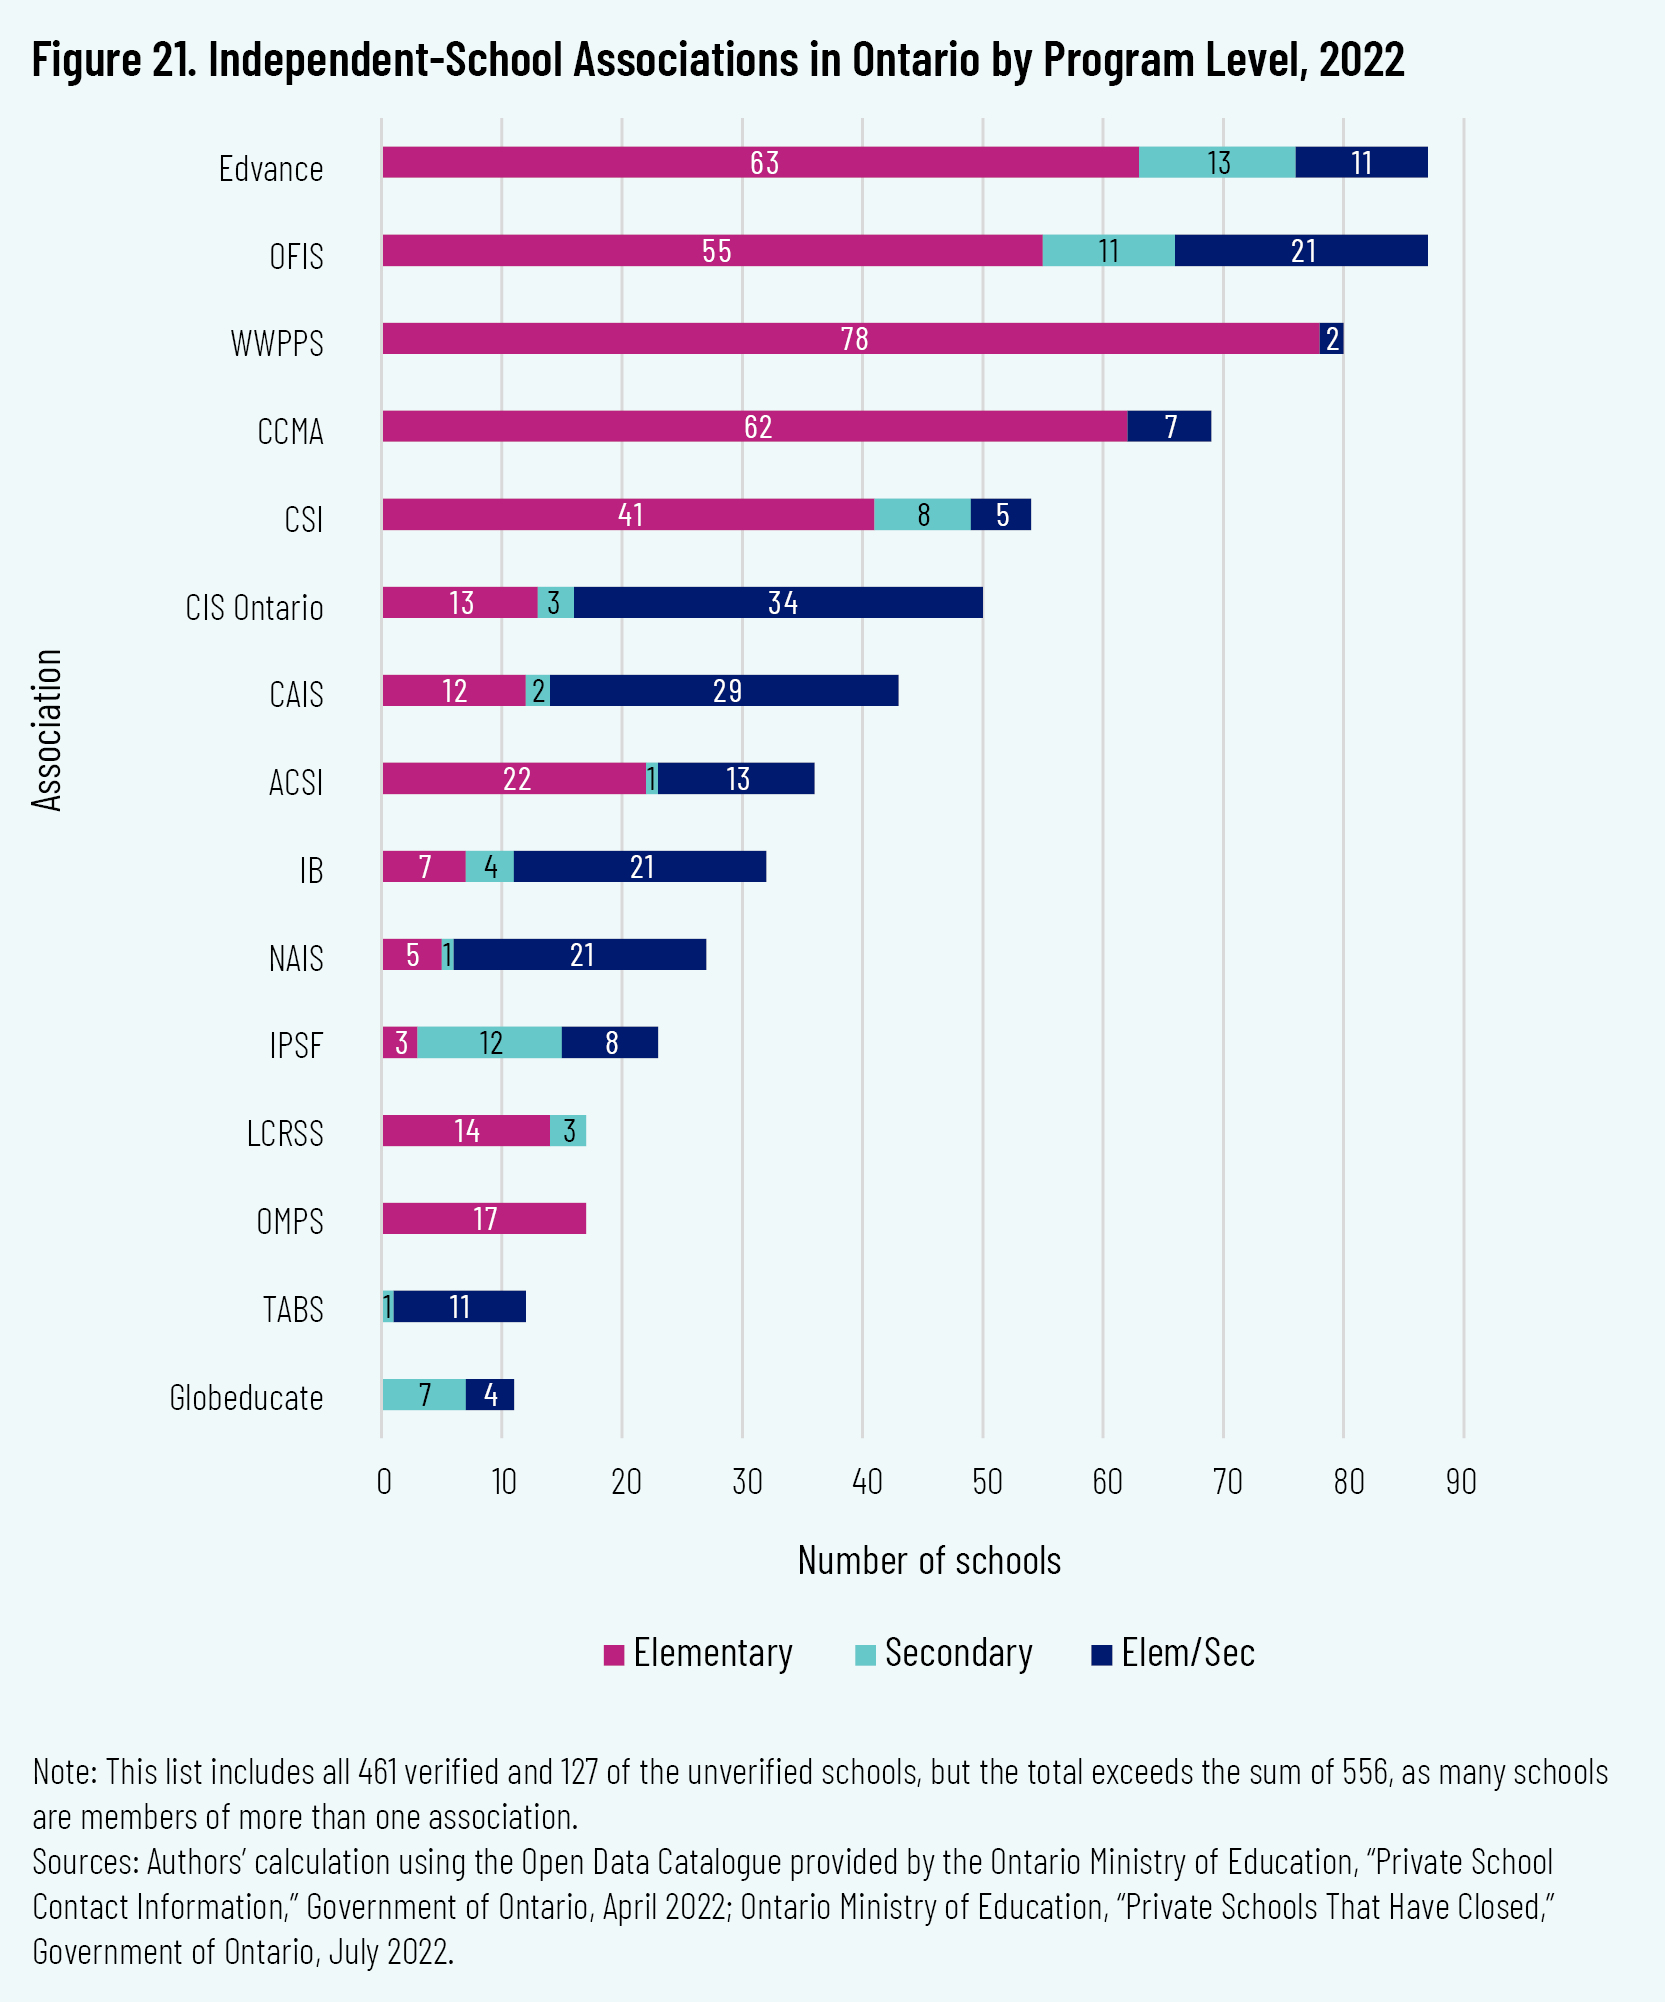
Fully 857 (59 percent) of Ontario independent schools do not have any association affiliation, 461 (32 percent) are verified as belonging to one of the 15 major associations, and the remaining 127 (9 percent) are unverified but self-identify as affiliated with one or more association. (The Open Data Catalogue reveals that most parochial schools report an association affiliation, but the parochial associations do not have an online presence with which to verify membership lists, and thus are coded but unverified here.) Of the 588 combined verified and unverified schools, 390 schools are members or affiliates of one association, and 198 have multiple memberships or affiliations. There is considerable overlap within the 198 multiple-association schools. For example, one Top Tier school is a member of 12 associations, and many Edvance schools are also members of Christian Schools International. With 87 member schools each, Edvance and the Ontario Federation of Independent Schools are tied for the largest number of schools. Figure 19 presents the school count for each of the 15 major associations, and figures 20 and 21 segment each association further, by program type and program level. By school type, six of the associations consist primarily of Religious schools (Edvance, WWPPS, CSI, ACSI, LCRSS, OMPS), four are exclusively Top Tier schools 49 49 Many of the schools who are members of these elite associations are also members of other associations and may be multi-type (i.e., not just Top Tier) schools. (CIS Ontario, CAIS, NAIS, TABS), two are exclusively Special Emphasis 50 50 Many of the schools that are members of these Special Emphasis associations are also members of other associations and may be multi-type (i.e., not just Special Emphasis) schools. (CCMA, IB), and the remaining three major associations have a mix of school types. 51 51 The large majority of OFIS schools are Special Emphasis, but this diverse association covers nearly the full range of independent school types (in order of prevalence): Religious, Preparatory, Credit Emphasis, and Top Tier. IPSF also has considerable diversity with Special Emphasis, Preparatory, and Religious schools; however, the largest share are Credit Emphasis. All Globeducate schools we coded as primarily Special Emphasis (subtype: International) and secondarily Credit Emphasis.
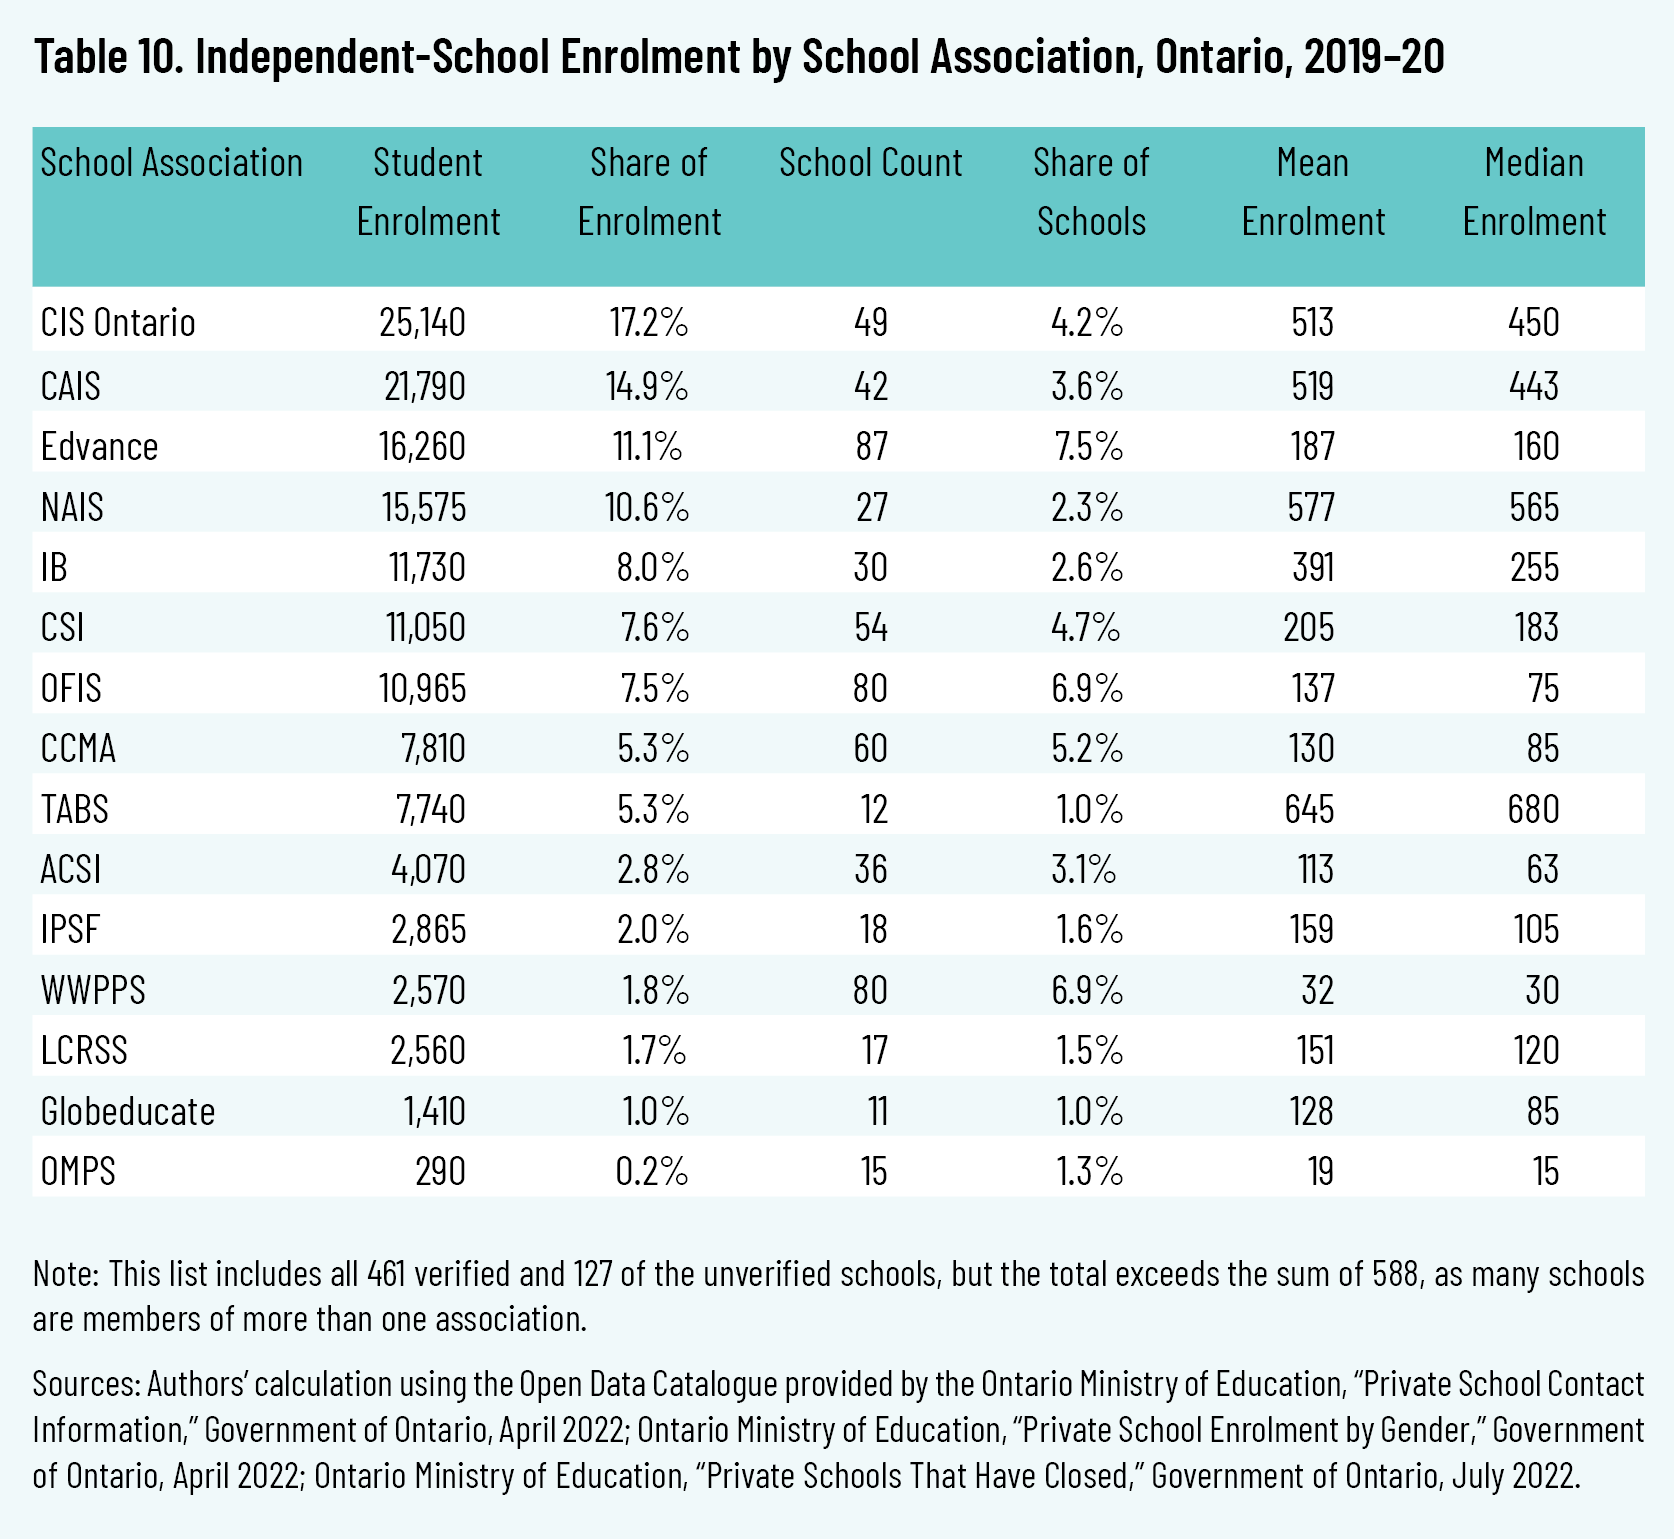
In the 2019–20 year, 89,615 students (61 percent) were enrolled in an independent school with at least one association membership or affiliation. When ranking by 2019–20 enrolment, as shown in table 10, the Conference of Independent Schools serves the most students, with 25,140 students, or 17.2 percent of the sector’s enrolment. For Religious school associations, Edvance’s 16,260 enrolment (11.1 percent) is the largest.
School associations are an important area for future research. Building on the work of Deani Van Pelt and Peter Jon Mitchell, further categorization of various associations by function will offer insight into the purpose and type of services offered. Understanding these associations’ corporate status, scope (e.g., provincial, international), budget, and accreditation and membership processes will also provide insight into the quality of operation and educational ideals of independent schools. Moreover, further discussion is needed about the distinctions between membership, affiliation, and accreditation.
Distribution by Geographic Location
As we noted in the introduction, the stereotype is that independent schools primarily cater to urban, high-income families. There are a number of ways in which we might categorize schools geographically. We use three methods—sub-provincial region, population centre, and urbanicity—in order to make meaningful distinctions and comparisons.
Region
The Ministry of Education segments all field operations, including independent schools, into five regions. The region of each school is given in the Open Data Catalogue. The July 2022 school count by region is shown in figure 22, and the 2019–20 enrolments are in figure 23. The Central region, with 571 schools in July 2022 and 59,935 students in 2019–20, is the largest in terms of school count and enrolment. The North region has the fewest schools and students.
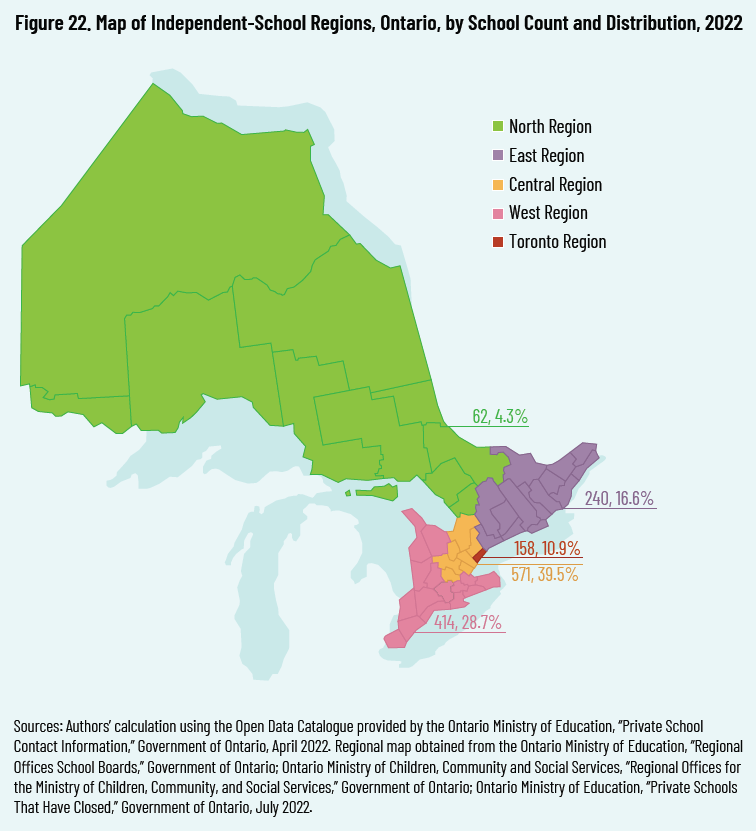
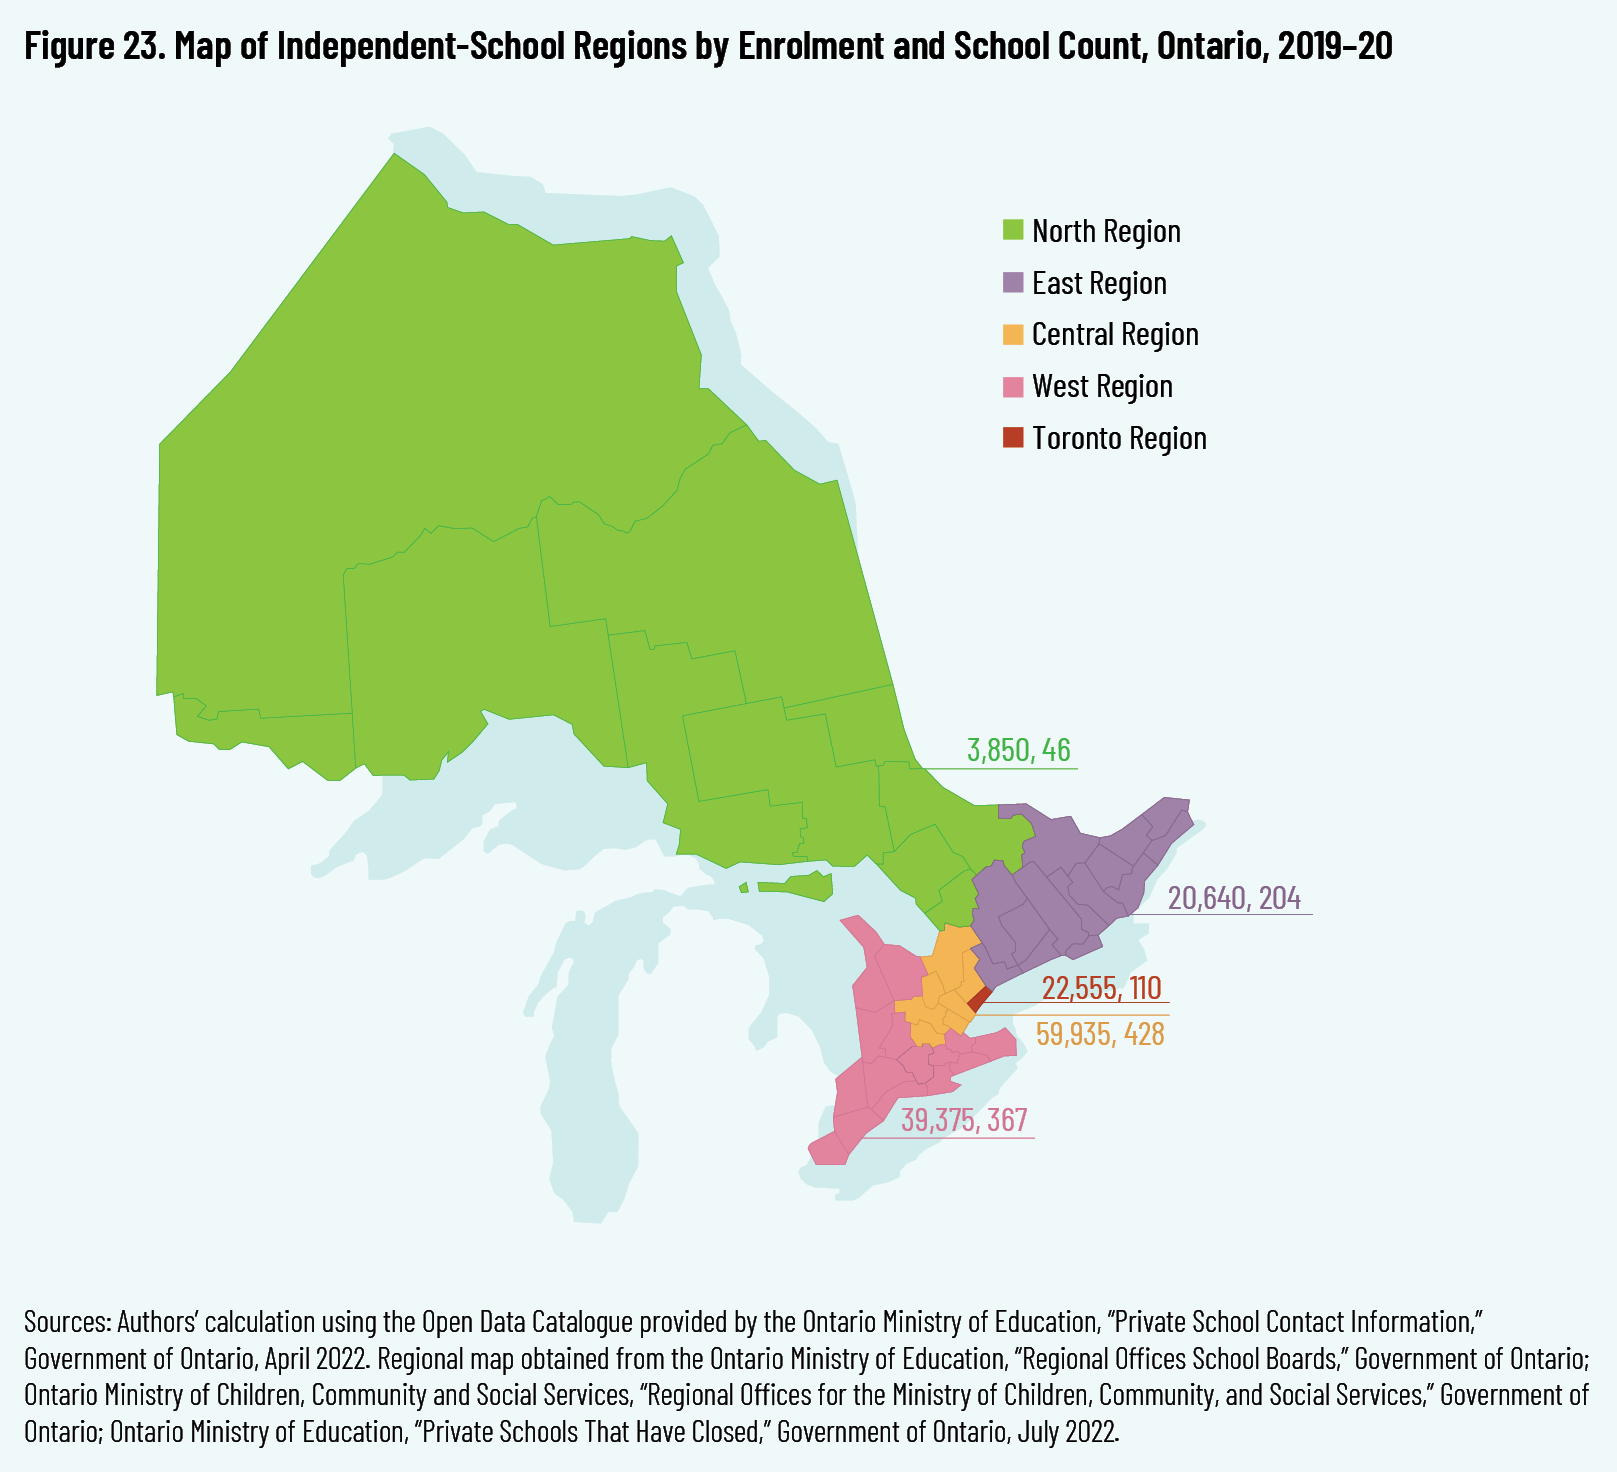
Of note, the Toronto region has the second fewest schools, and by a considerable margin. But the schools in this region have the largest average enrolment, as they are more likely to be Top Tier (figure 23). Nearly three out of four Top Tier schools (figure 24) and four out of five Top Tier students (figure 25) are in either the Toronto or Central region—in other words, roughly the greater Toronto area. Perhaps their overrepresentation where Canada’s major media outlets are concentrated fuels the false stereotype that Top Tier schools are representative of the sector as a whole.
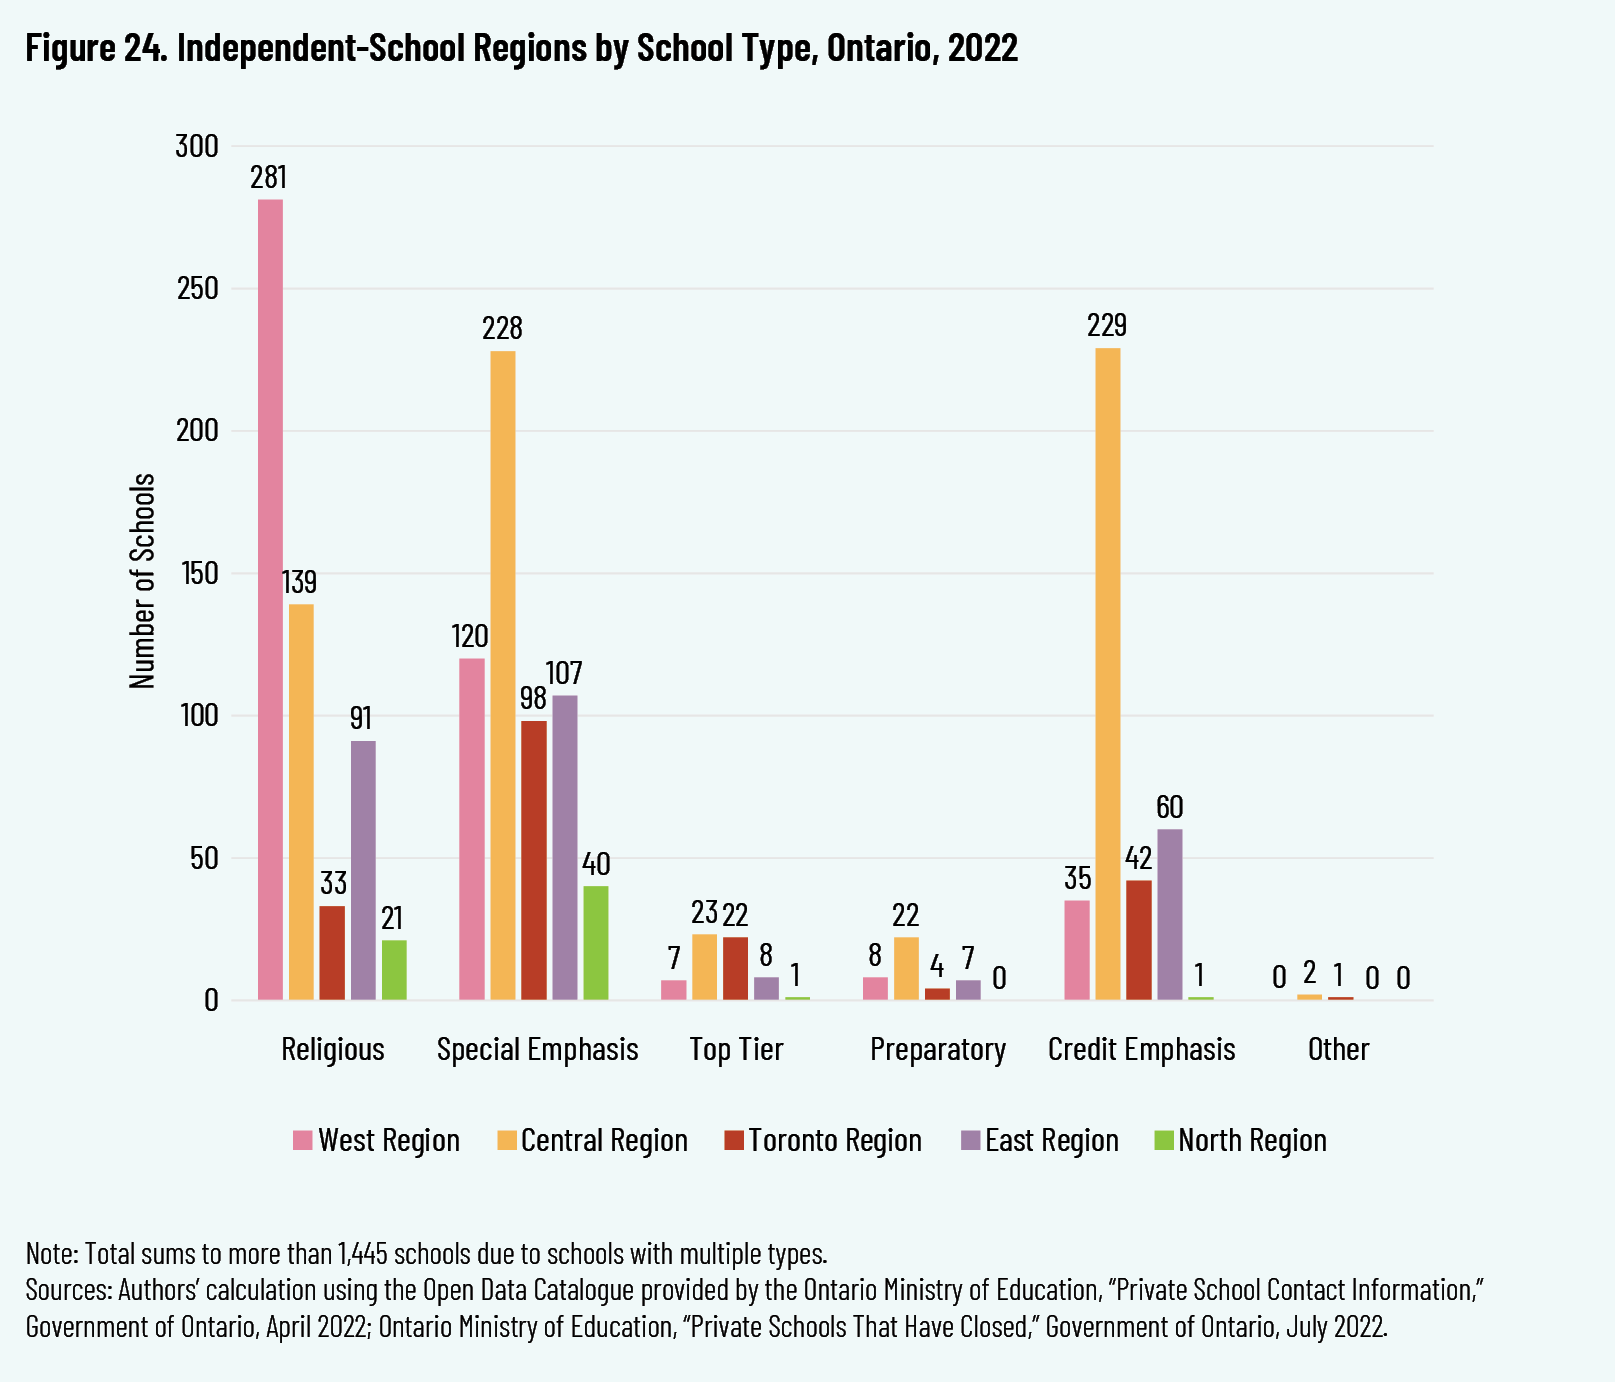
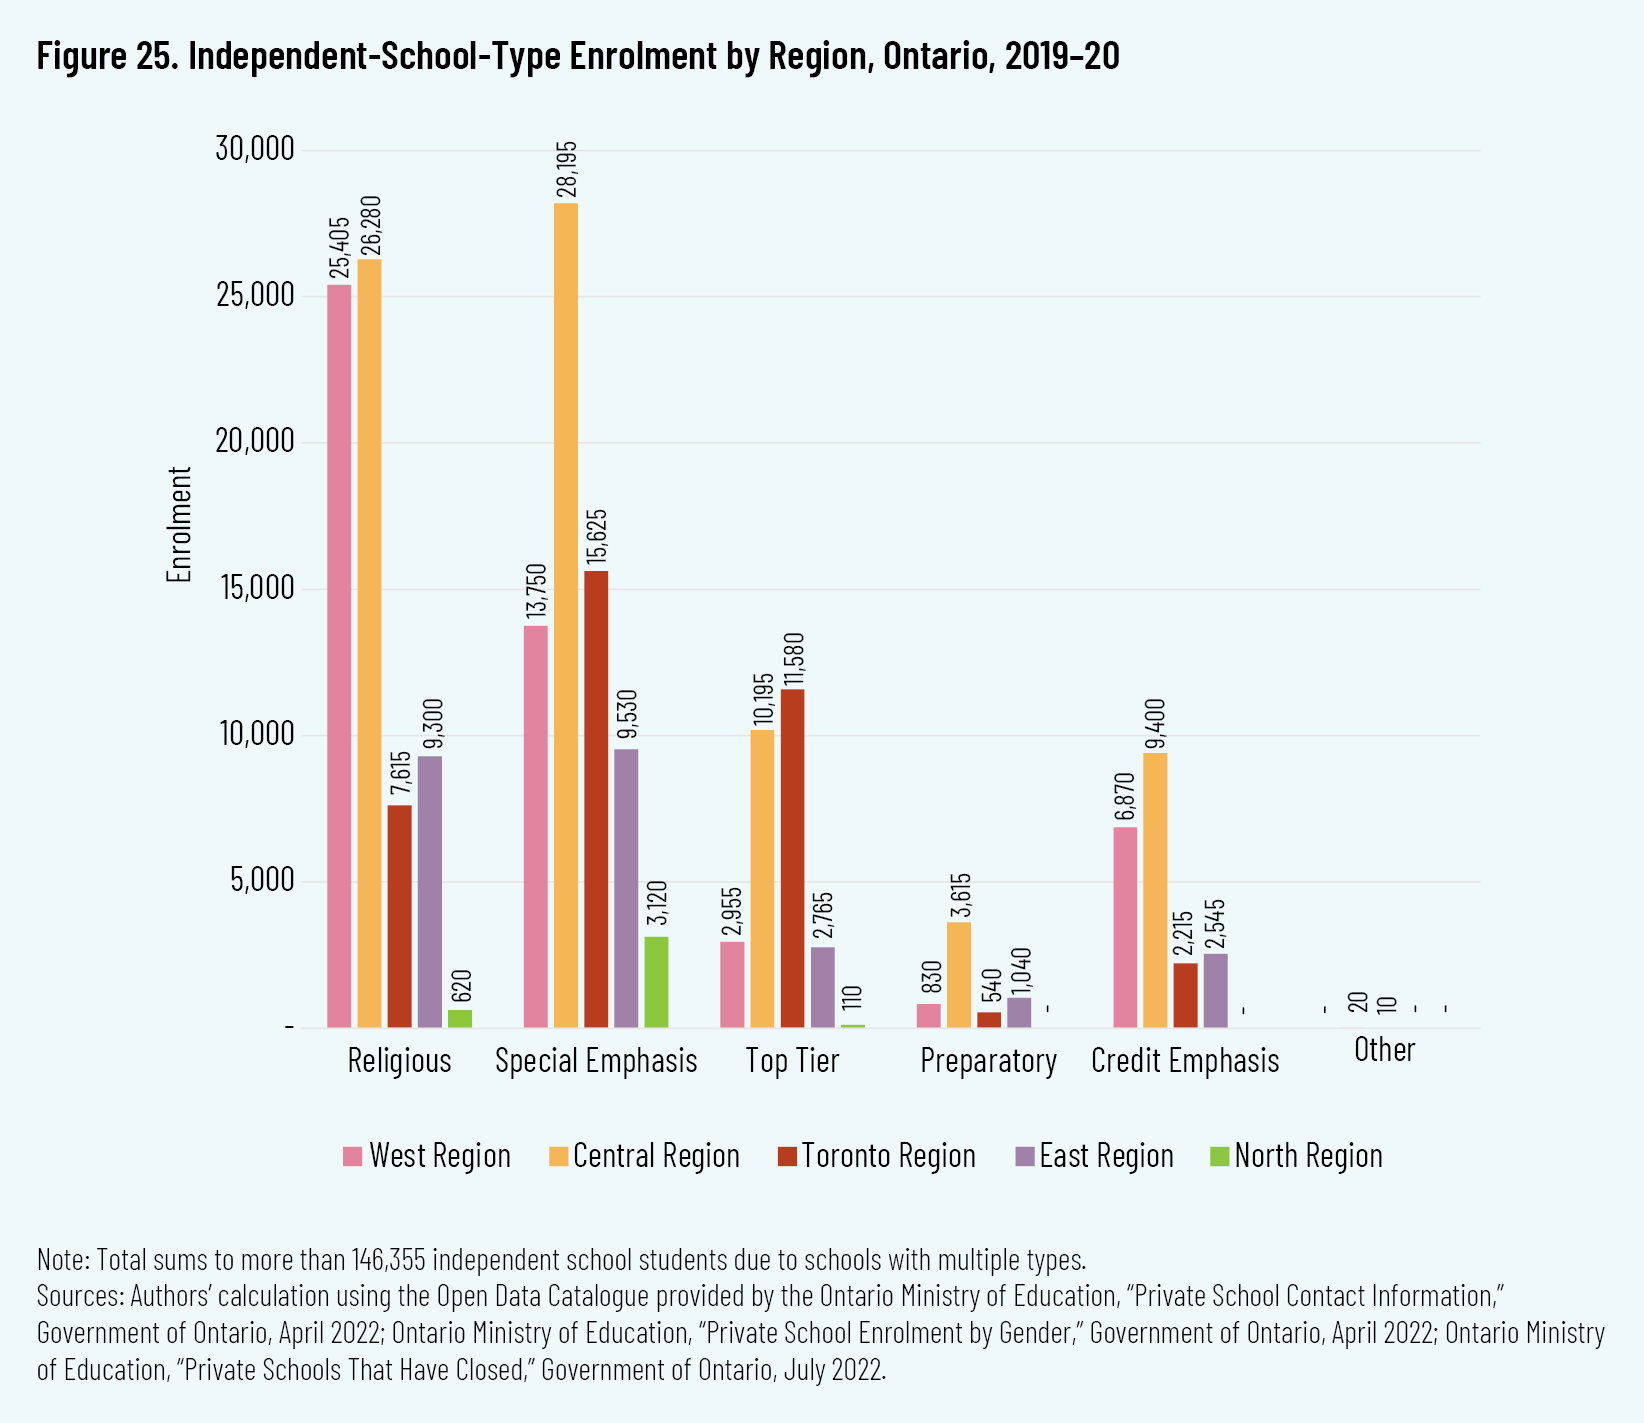
The regional distribution of the various school types is particularly interesting. Half of Religious schools are in the West region (figure 24), and nearly two-thirds of the West region’s schools are Religious. The Central region enrols the largest share (38 percent) of Religious independent-school students (figure 25), as 51 percent of the West region’s Religious schools are Mennonite and/or parochial schools (figure 26), which tend to have small average enrolment (table 7). Fully 53.7 percent of Preparatory schools and 62.4 percent of Credit Emphasis schools are in the Central region, but unlike Top Tier schools, few of them are in the Toronto region (figure 24). The most evenly distributed school type is Special Emphasis (figure 24). Even at the subtype level, with the exception of First Nation schools (which are almost entirely in the North region), each Special Emphasis subtype is represented in every region except the North—with a remarkably balanced distribution (figure 27).
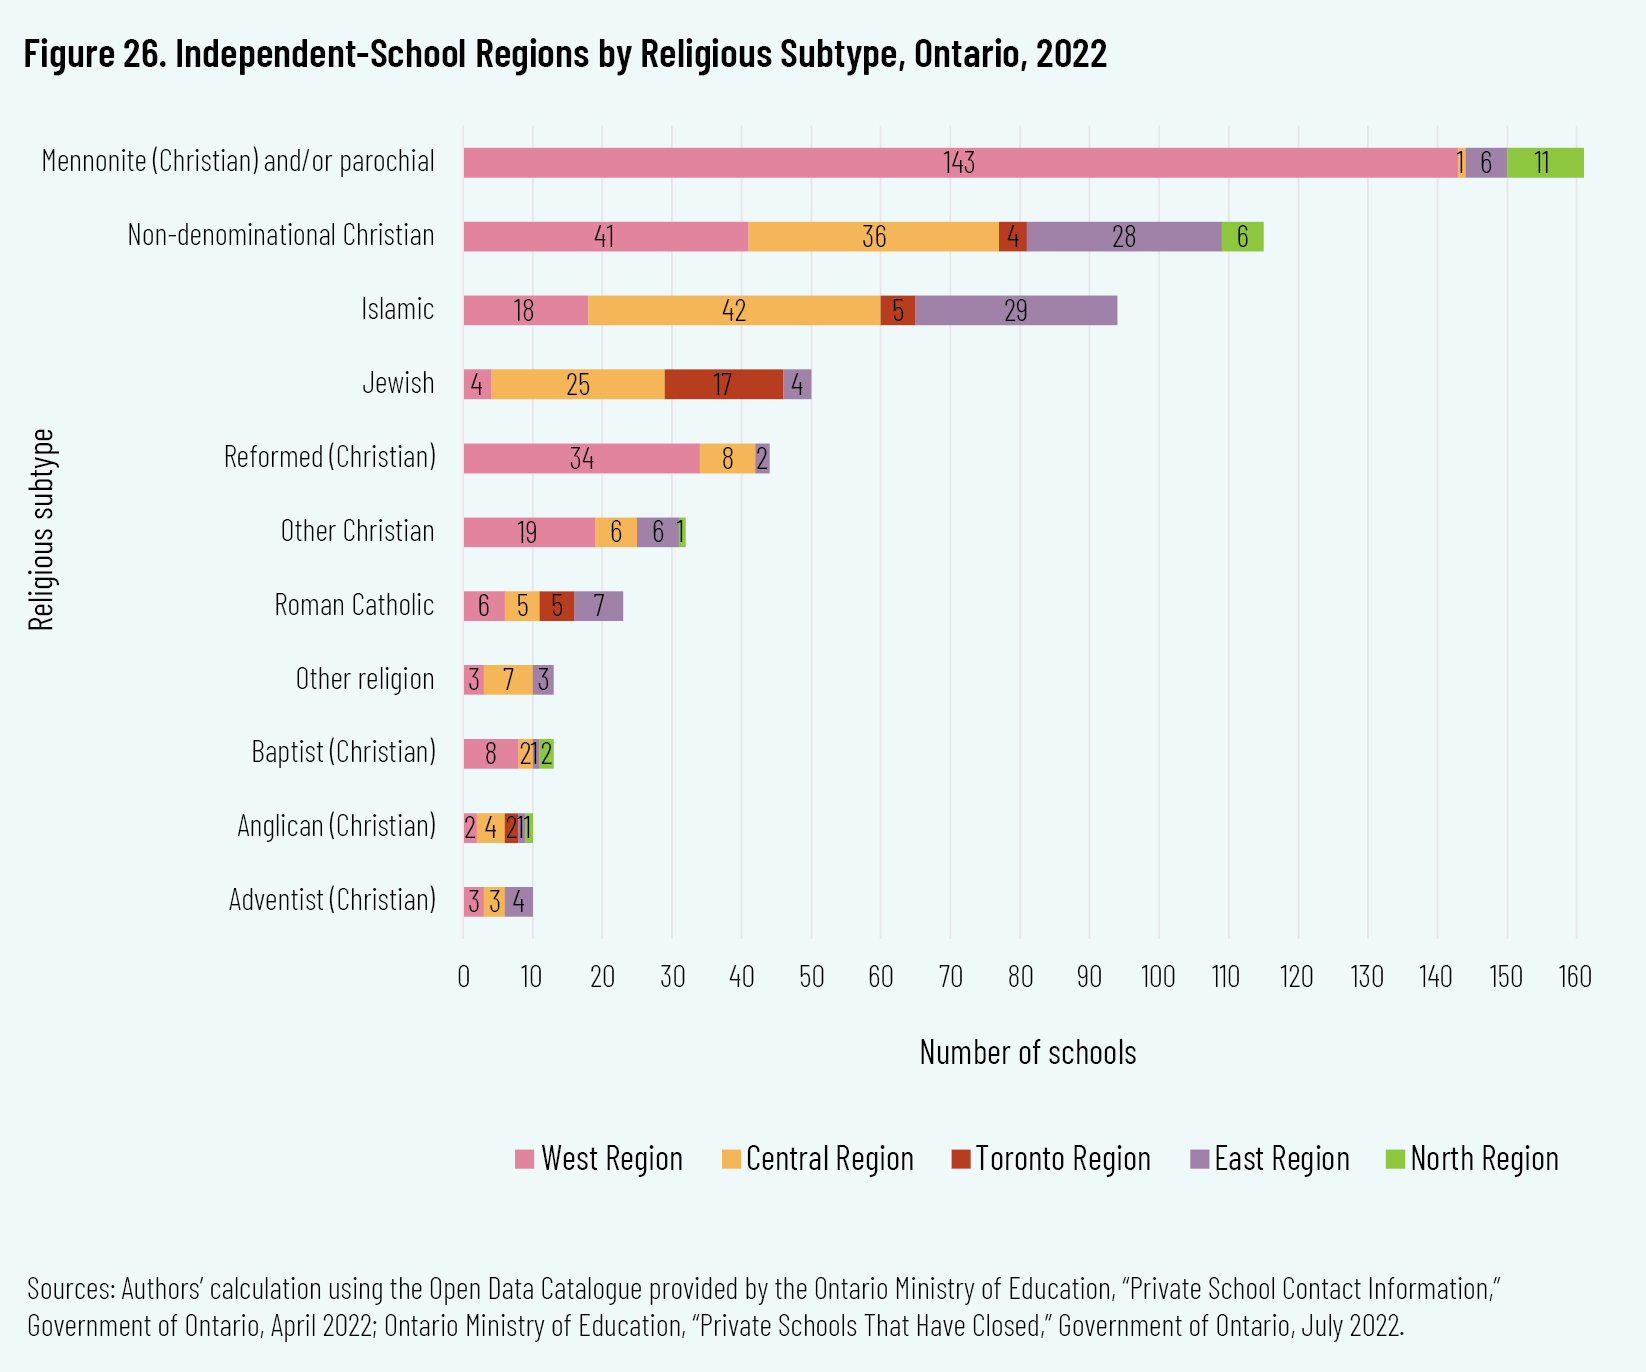
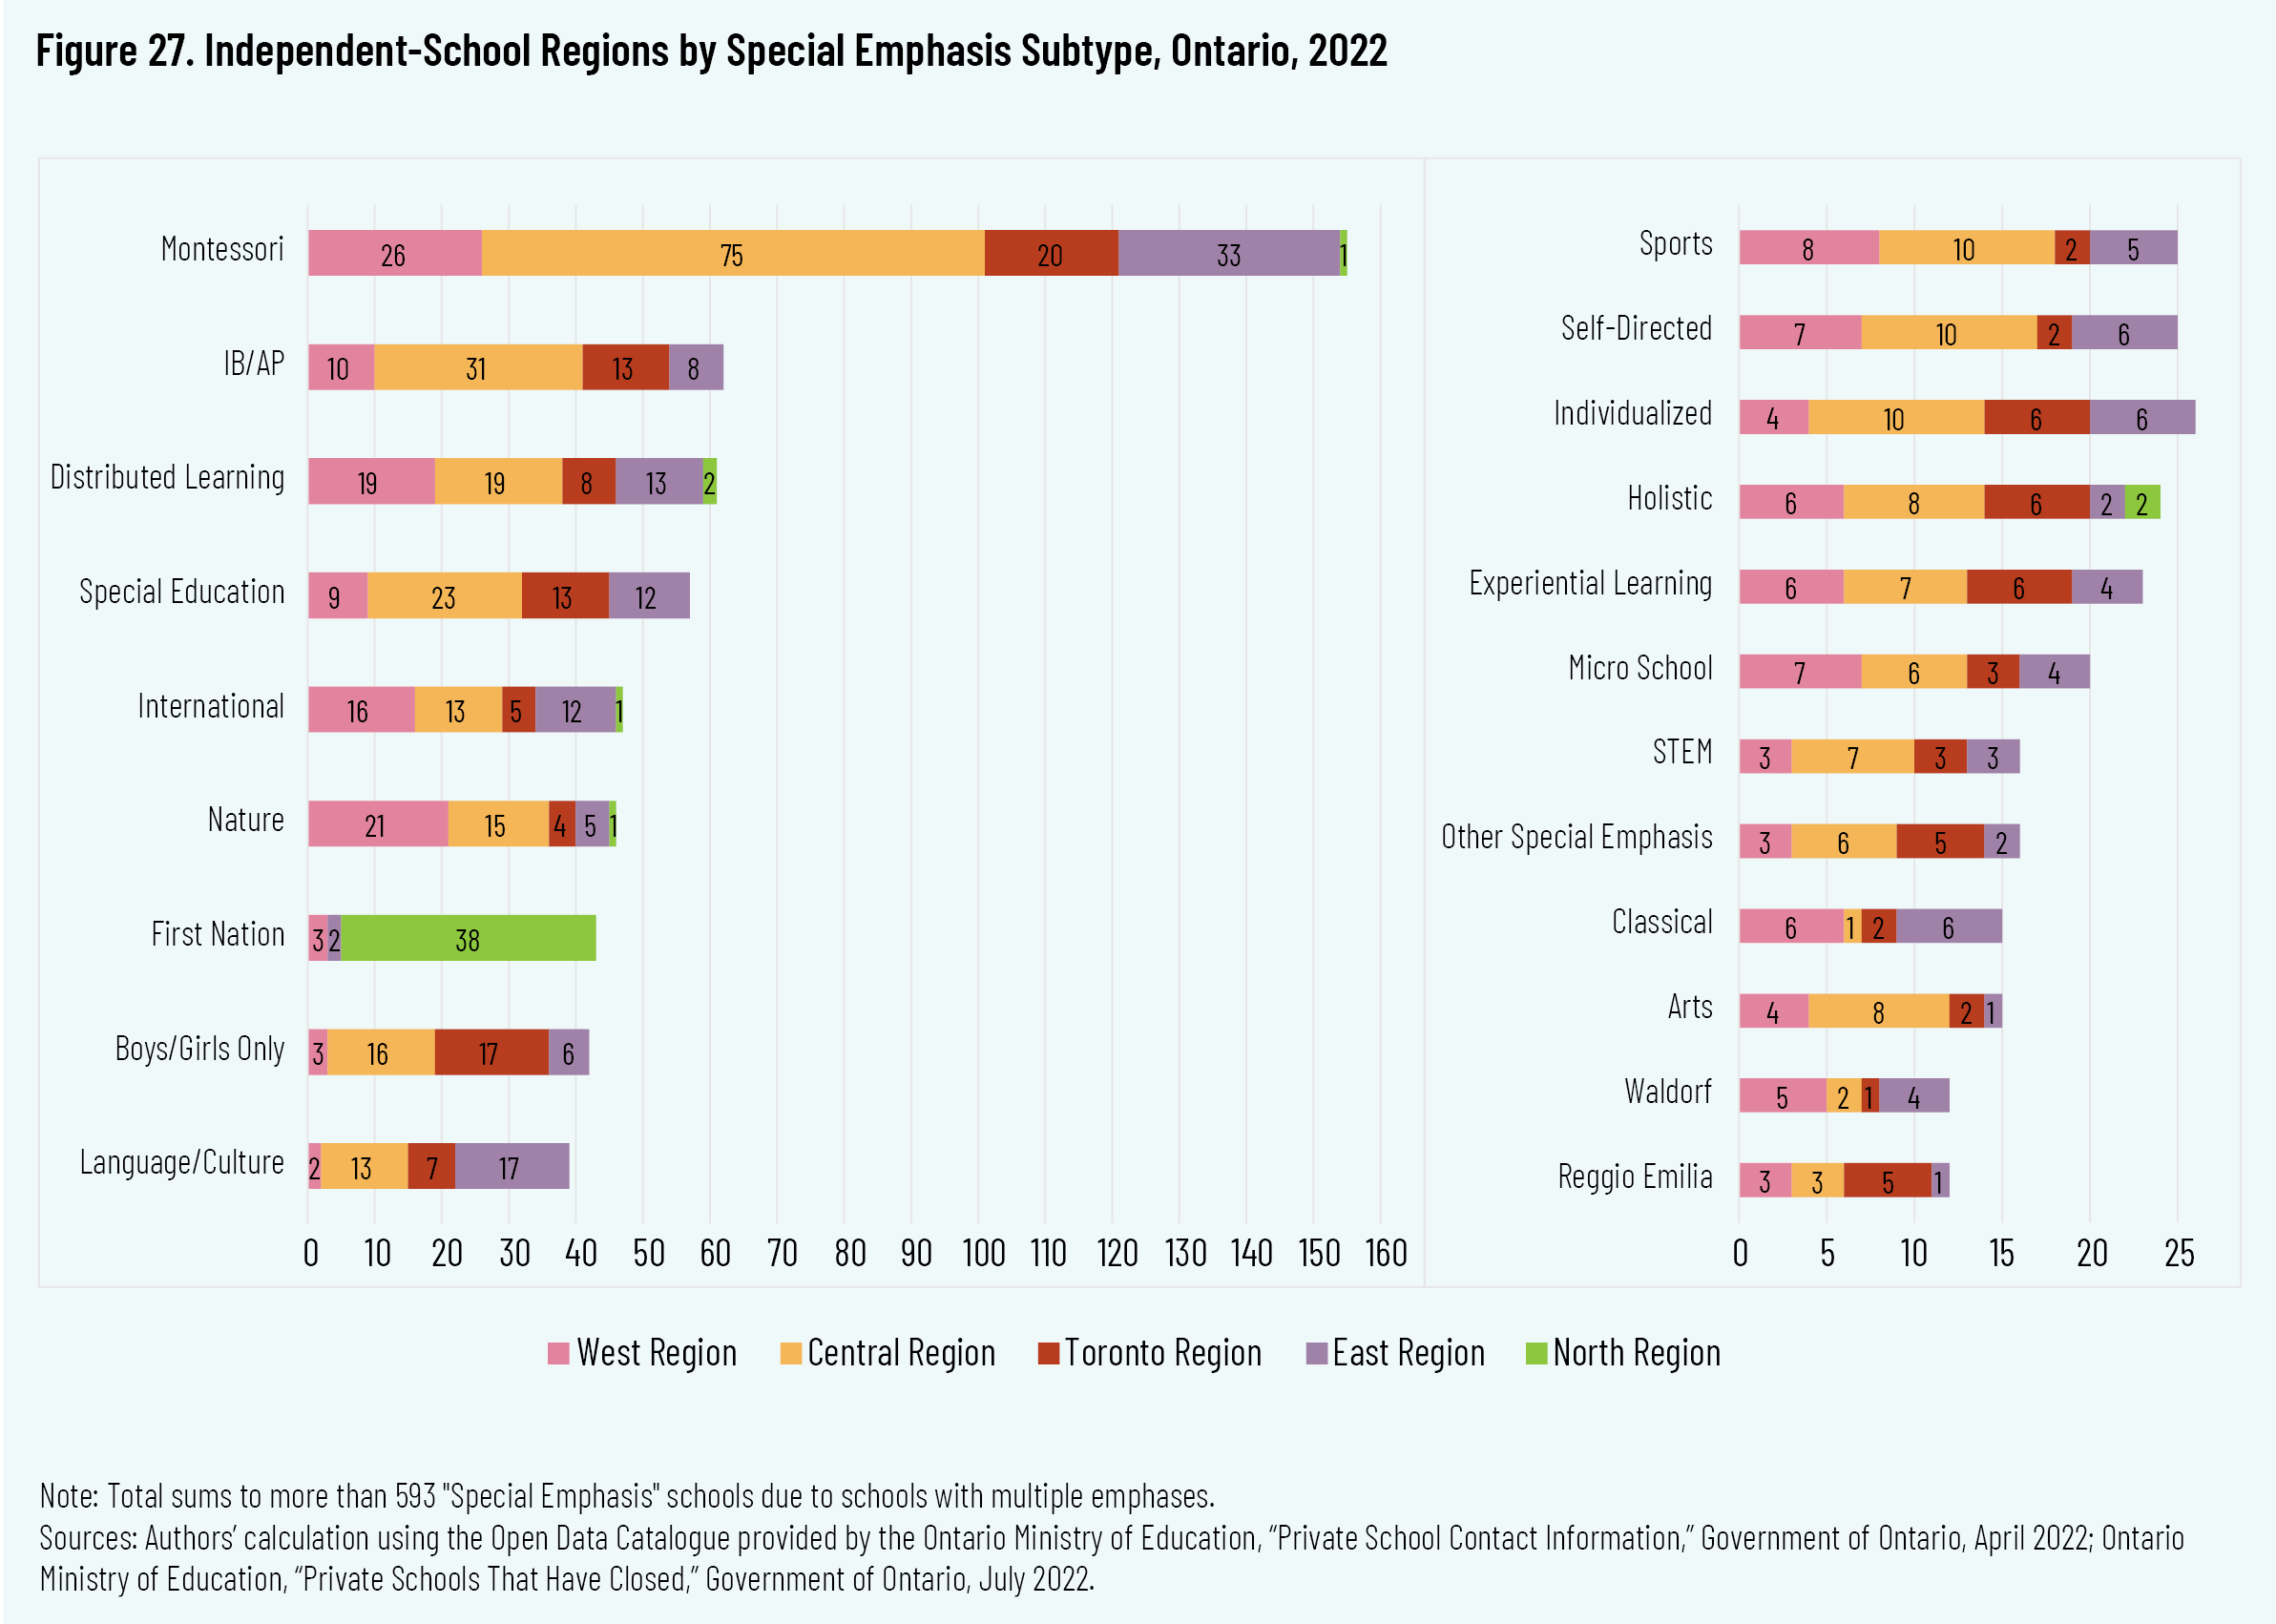
Figures 28 to 31 present the school count by postal code across the province (figure 28) and in Southern Ontario (figure 29), the Golden Horseshoe (figure 30), and Ottawa (figure 31). Figures 32 to 35 present the 2019–20 enrolments by postal code across the province (figure 32) and in Southern Ontario (figure 33), the Golden Horseshoe (figure 34), and Ottawa (figure 35).
Population Centre
Using data from Statistics Canada’s 2016 Census, population centre data was retrieved and matched with the school’s city according to definitions outlined in the Census Dictionary.
52
52
Statistics Canada, “Population and Dwelling Counts, for Canada, Provinces and Territories, and Population Centres, 2016 and 2011 Censuses (Table),” 2017, https://www12.statcan.gc.ca/census-recensement/2016/dp-pd/hlt-fst/pd-pl/Tables/File.cfm?T=801&SR=1&RPP=100&PR=35&CMA=0&CSD=0&S=3&O=D&Lang=Eng&OFT=CSV; Statistics Canada,
“Dictionary, Census Population, 2016,” October 11, 2018, 94, https://www12.statcan.gc.ca/census-recensement/2016/ref/dict/98-301-x2016001-eng.pdf.
Schools located in centres with a population between 1,000 to 29,999 were considered small, schools in centres with a population from 30,000 to 99,999 were marked medium, and those in an area with population 100,000 or more were considered large. Given that a population centre has a population of at least 1,000 and a density of 400 persons or greater per square kilometre, schools where no match was found were categorized as rural.
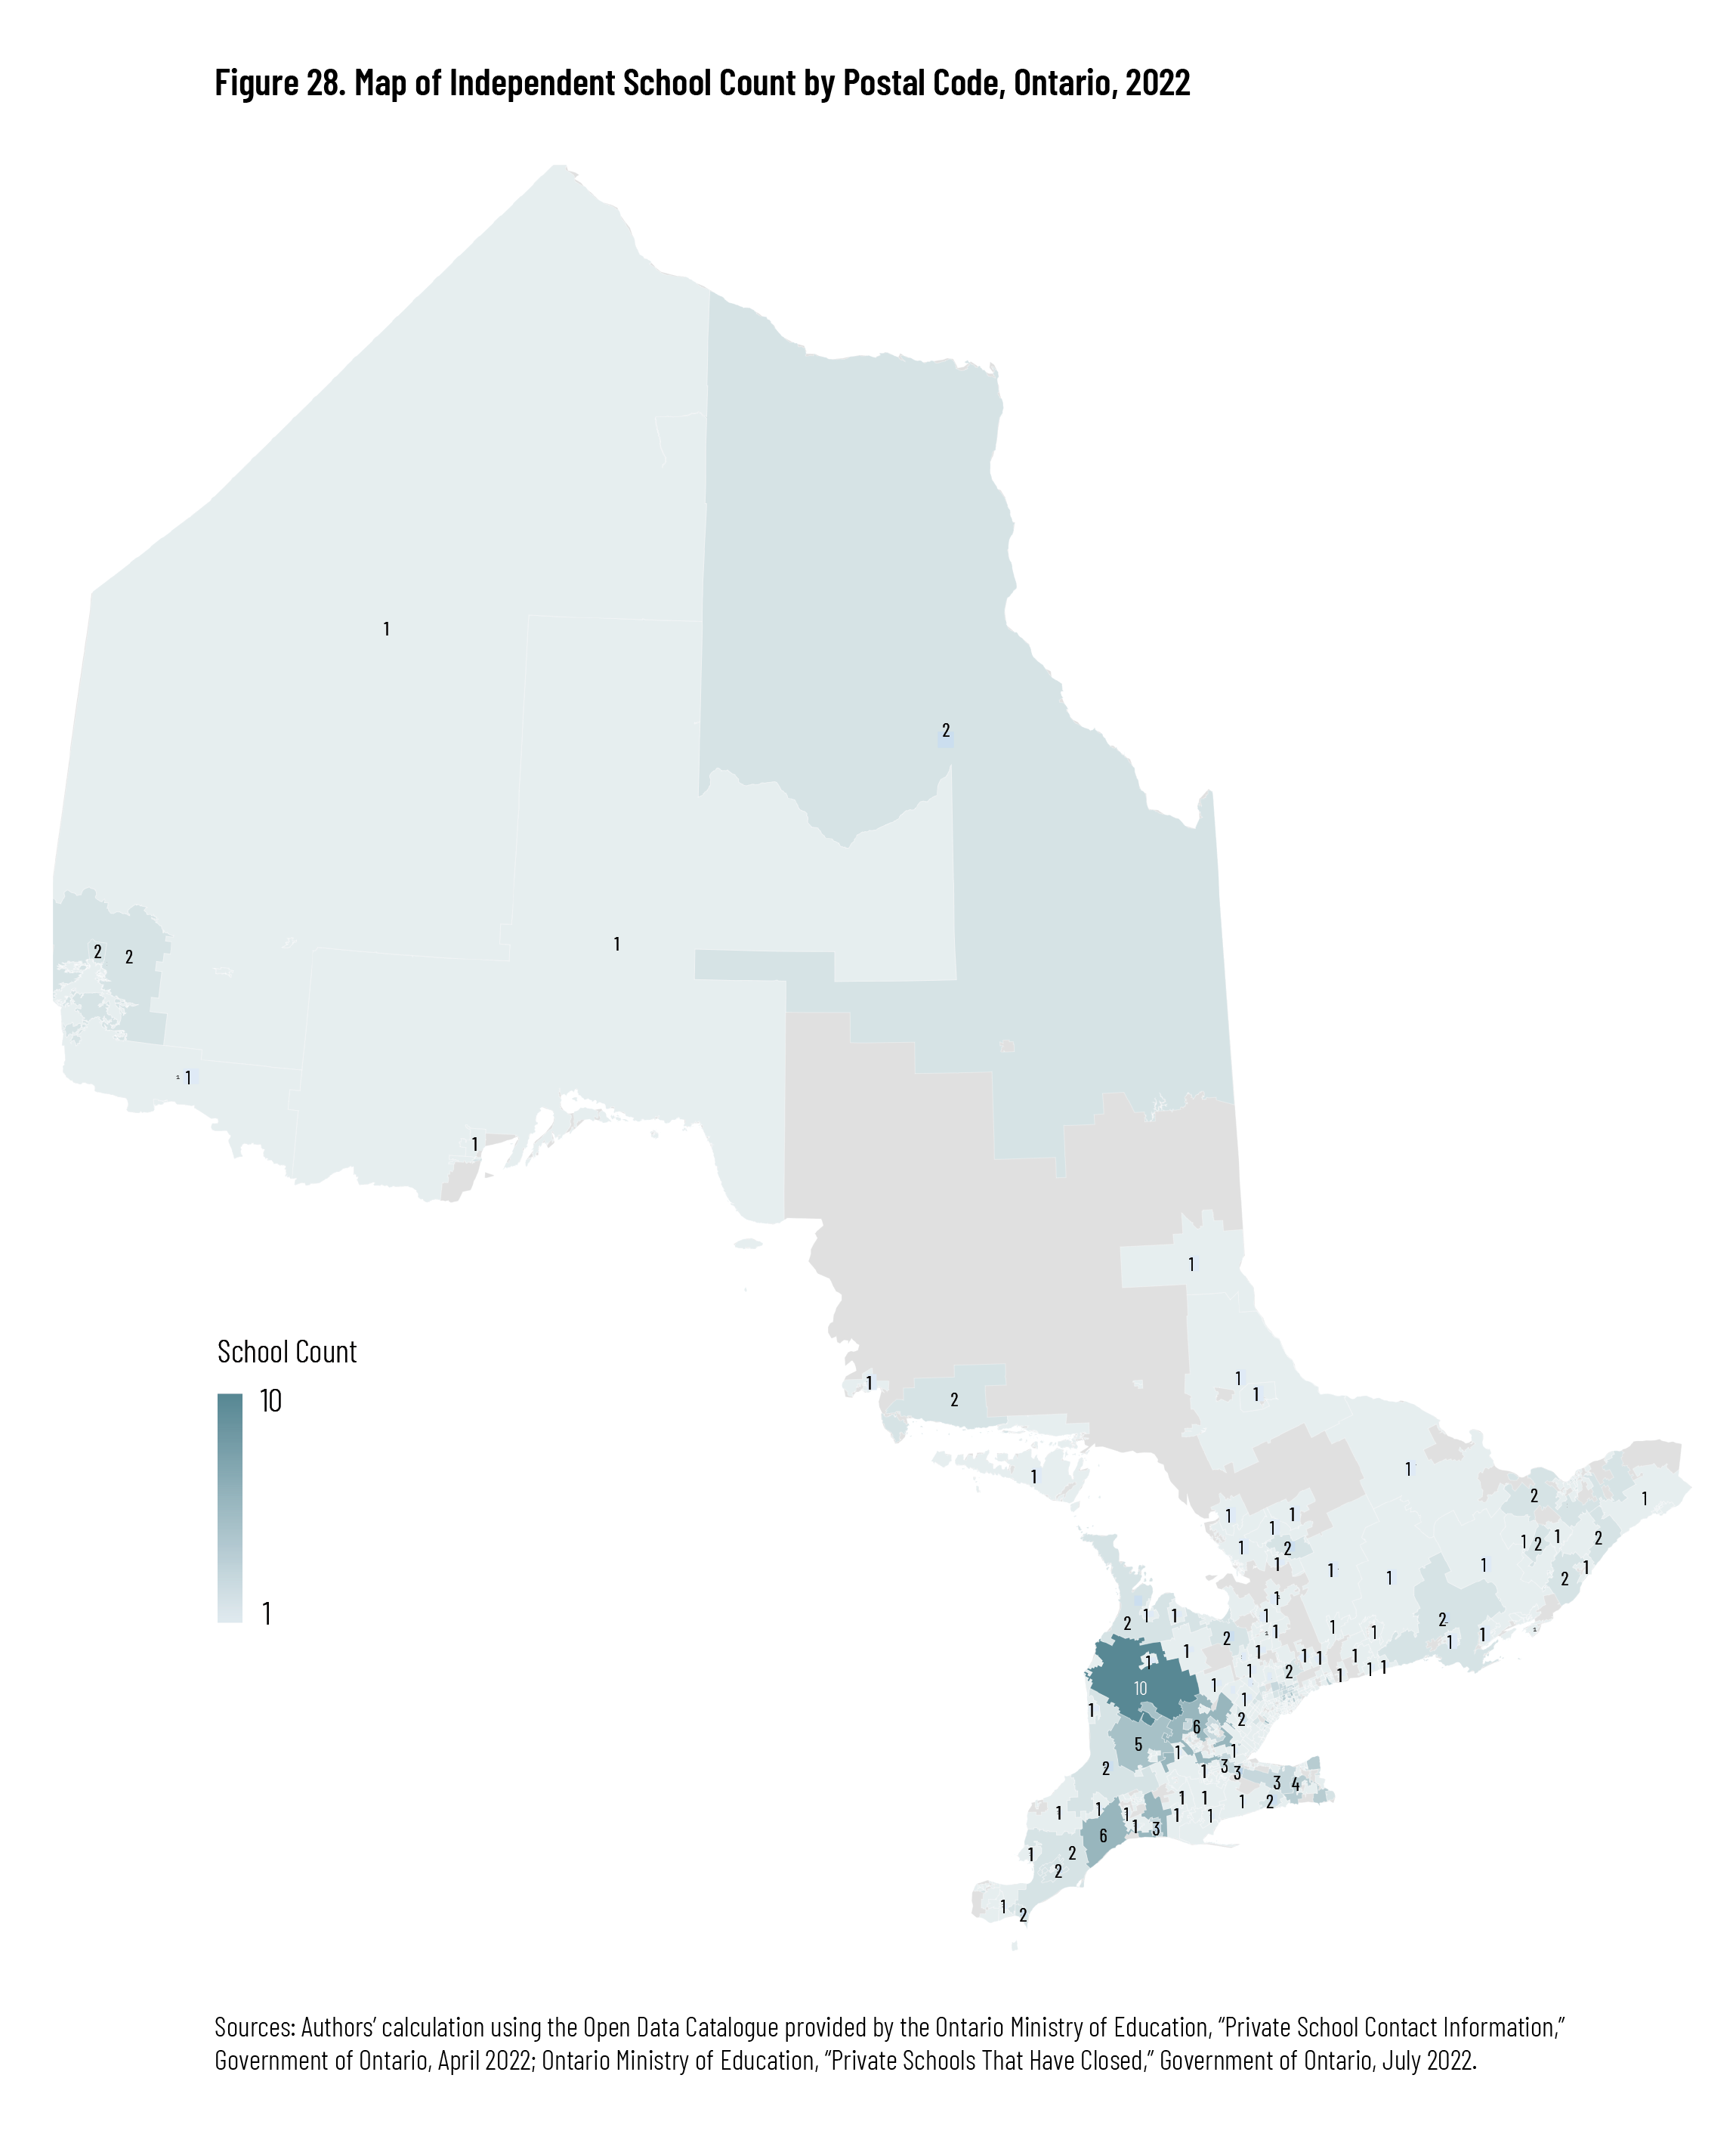
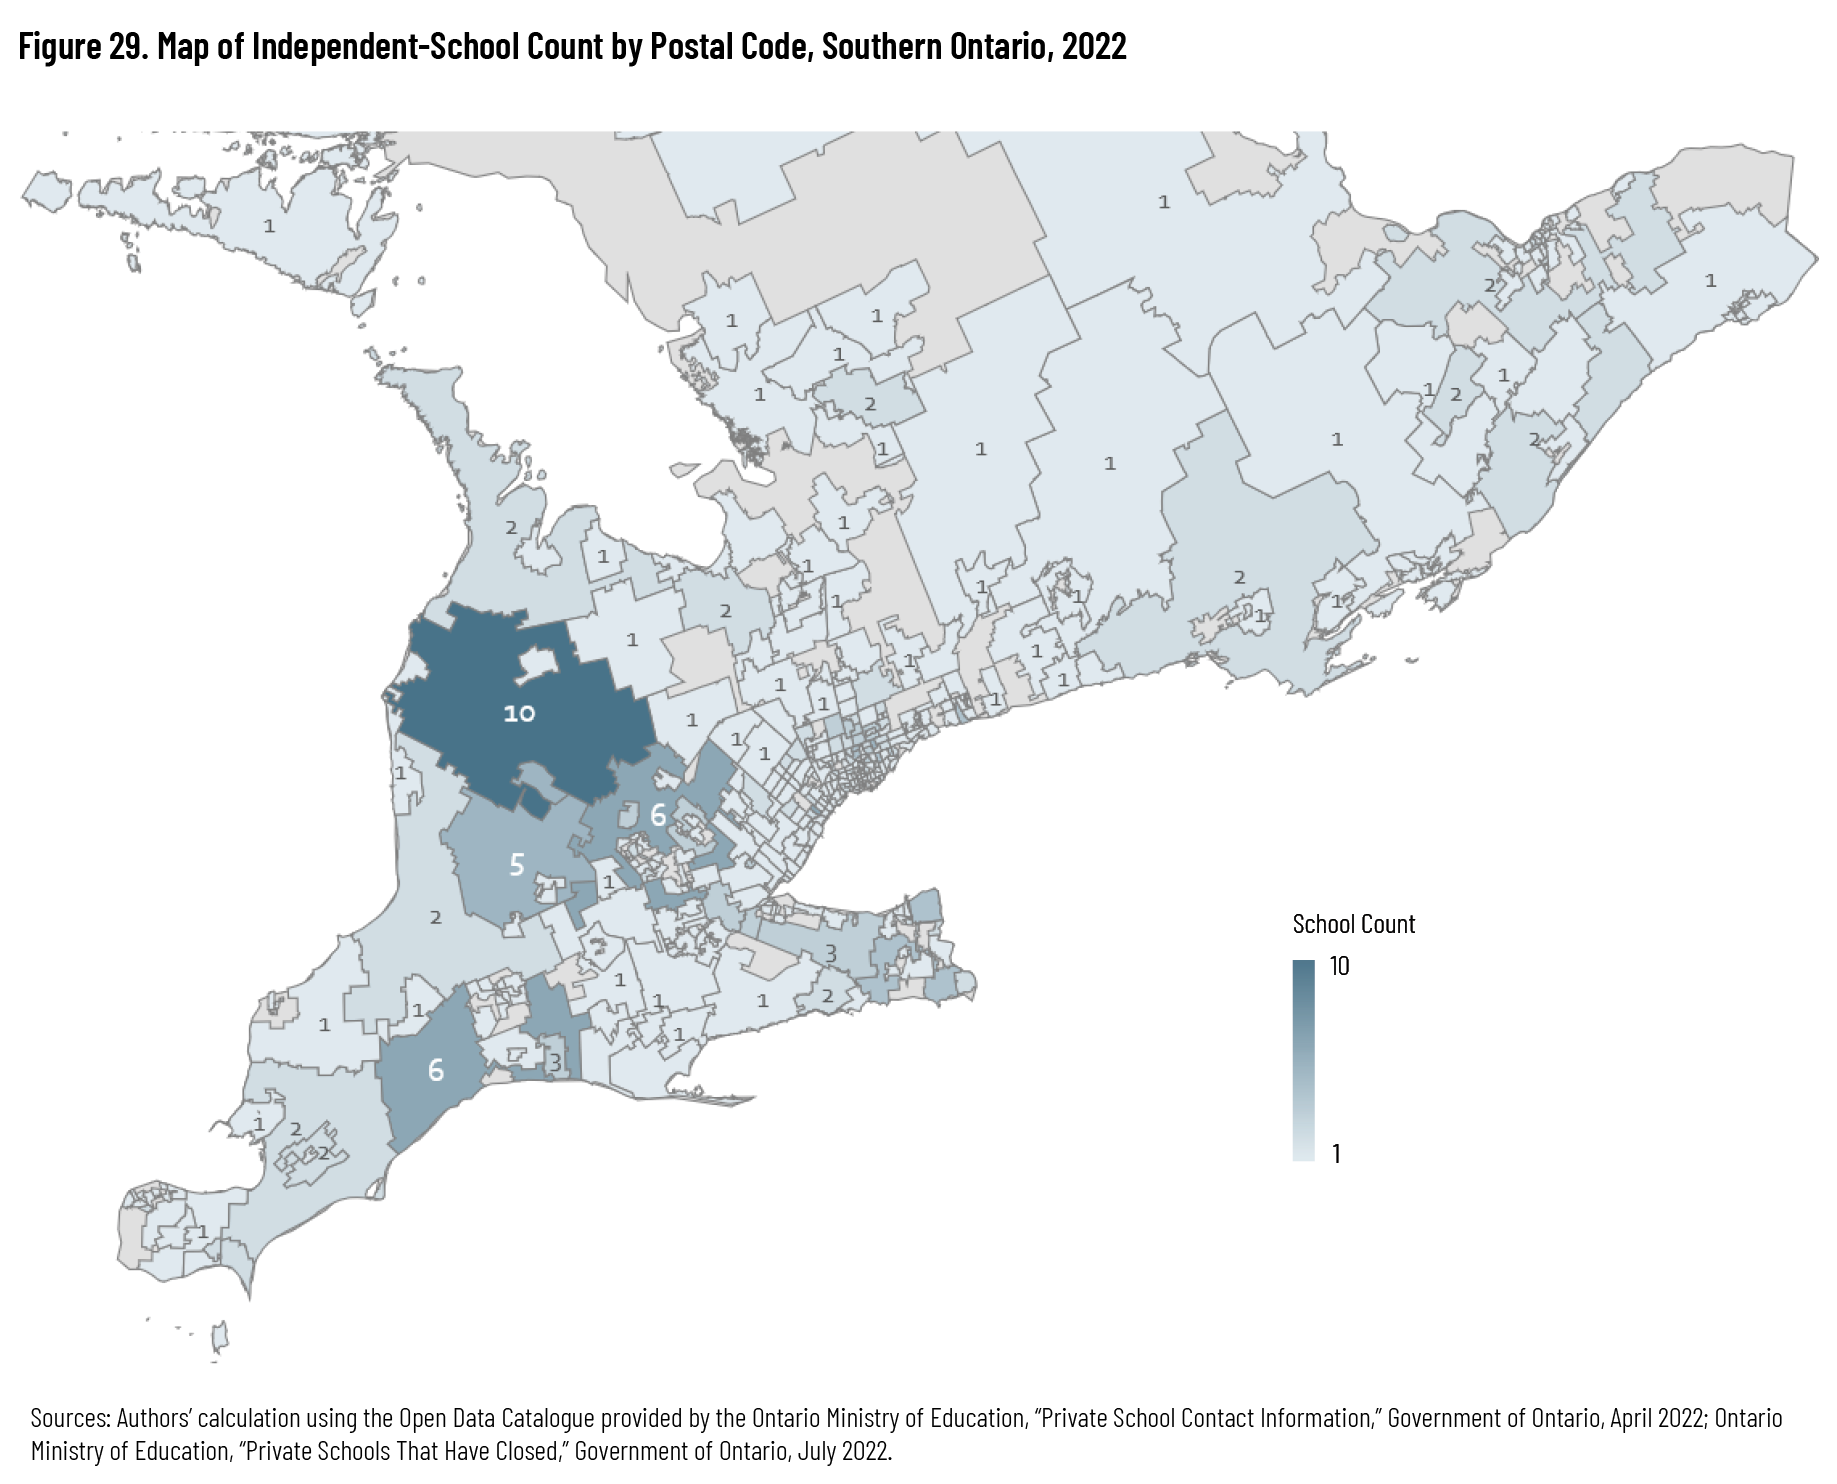
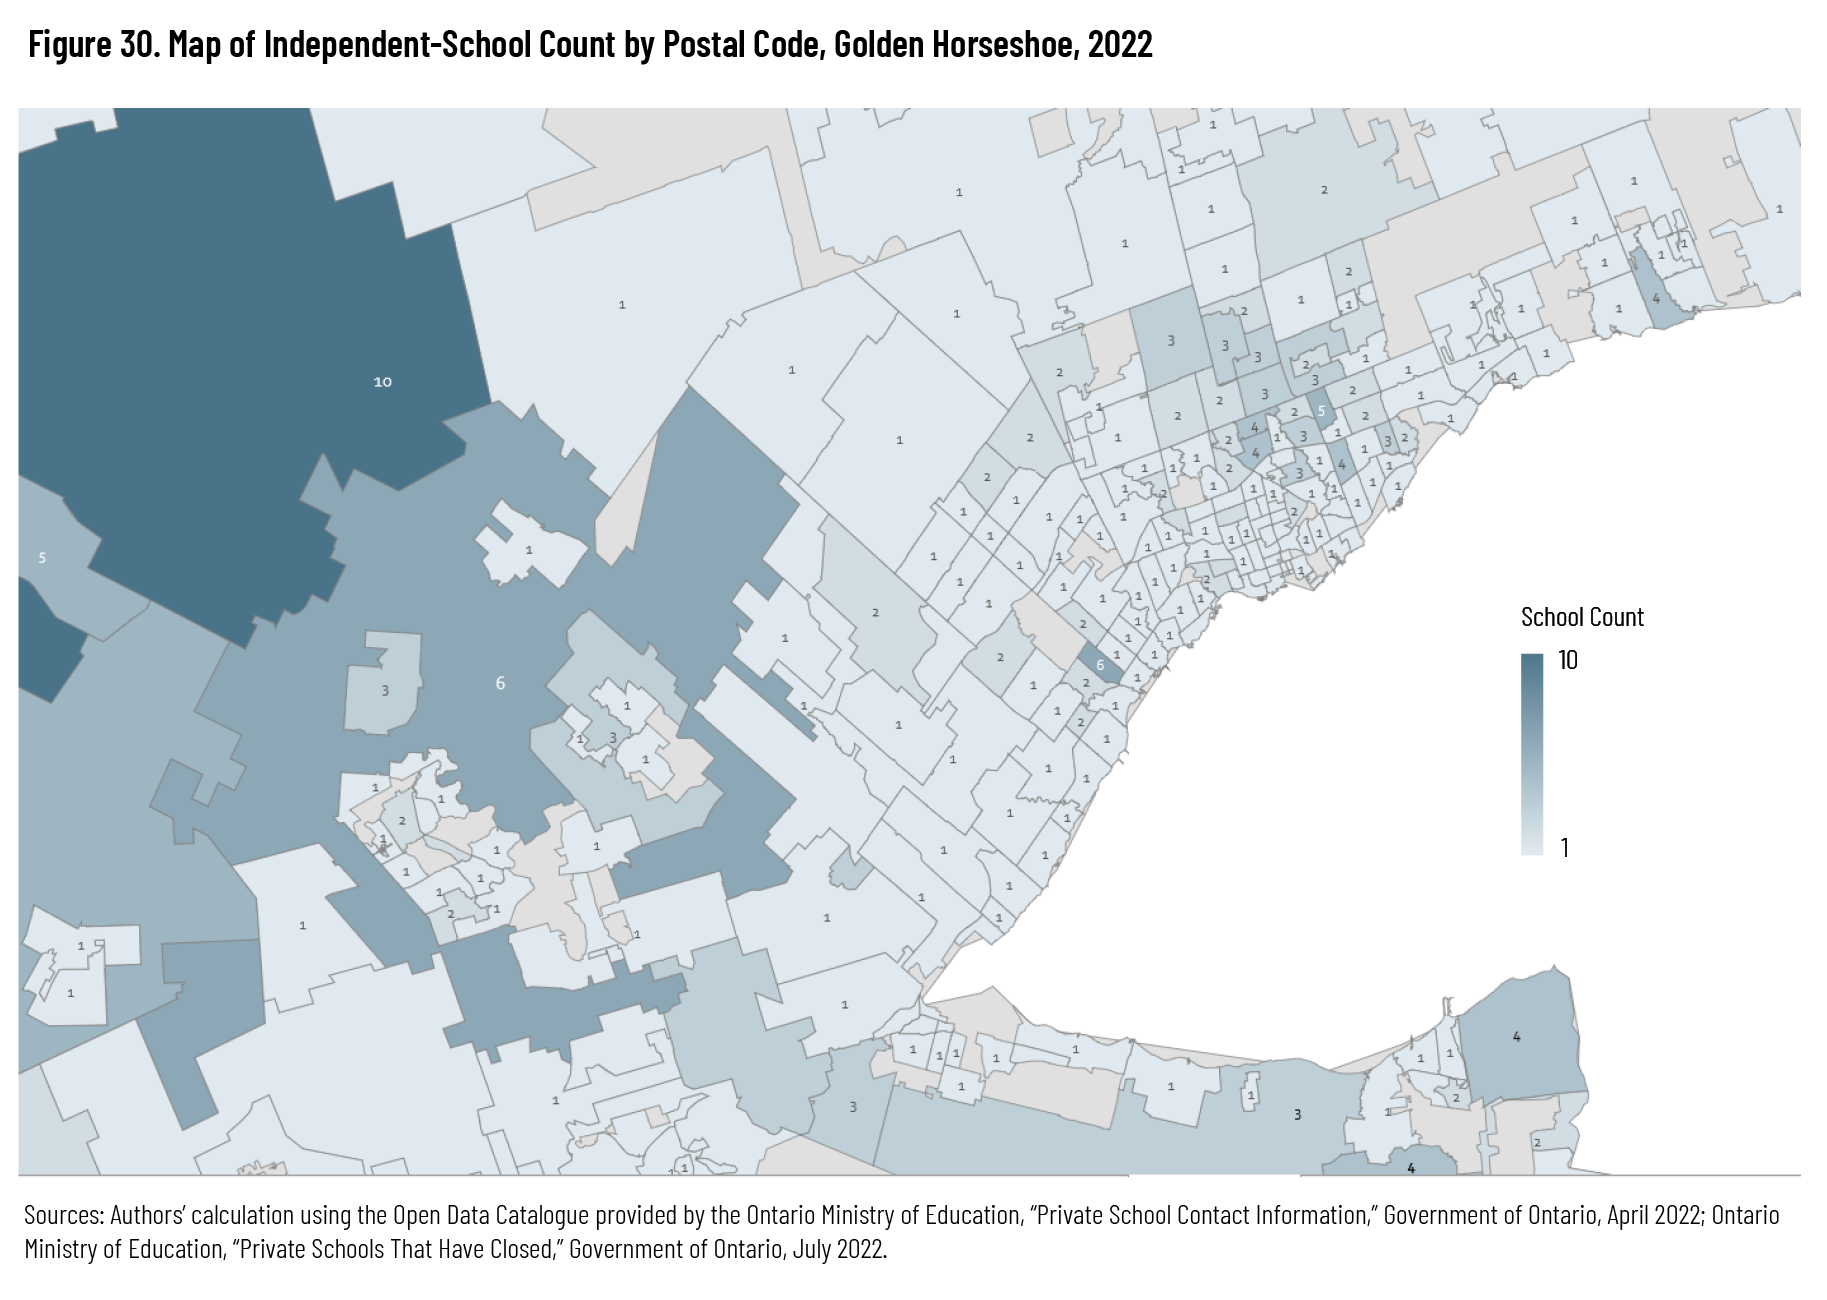
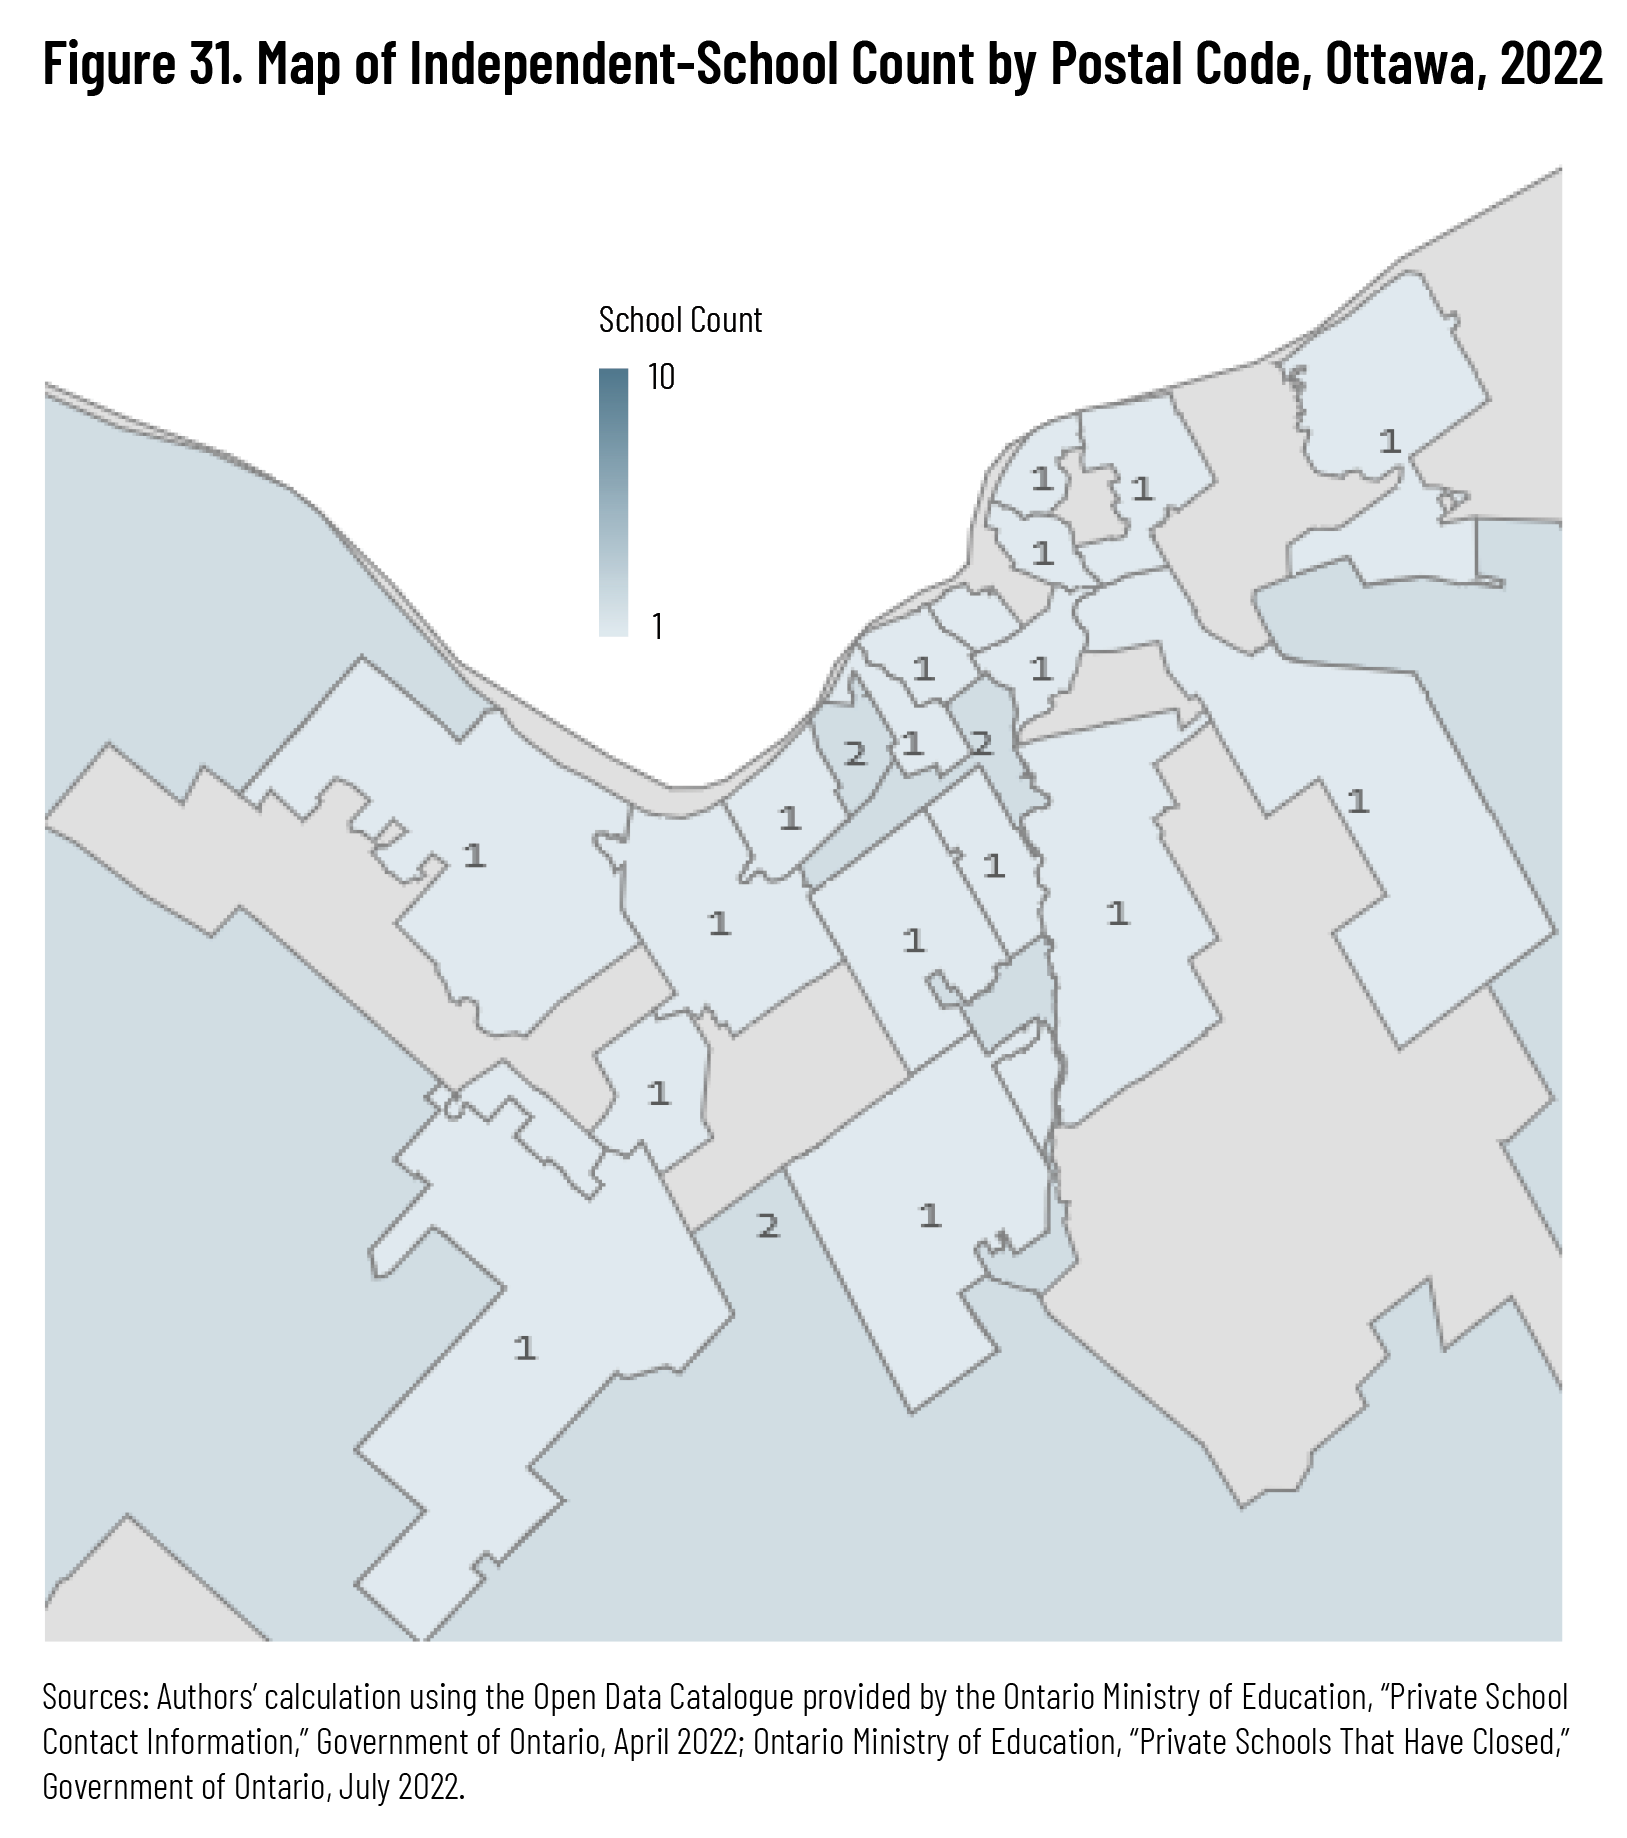
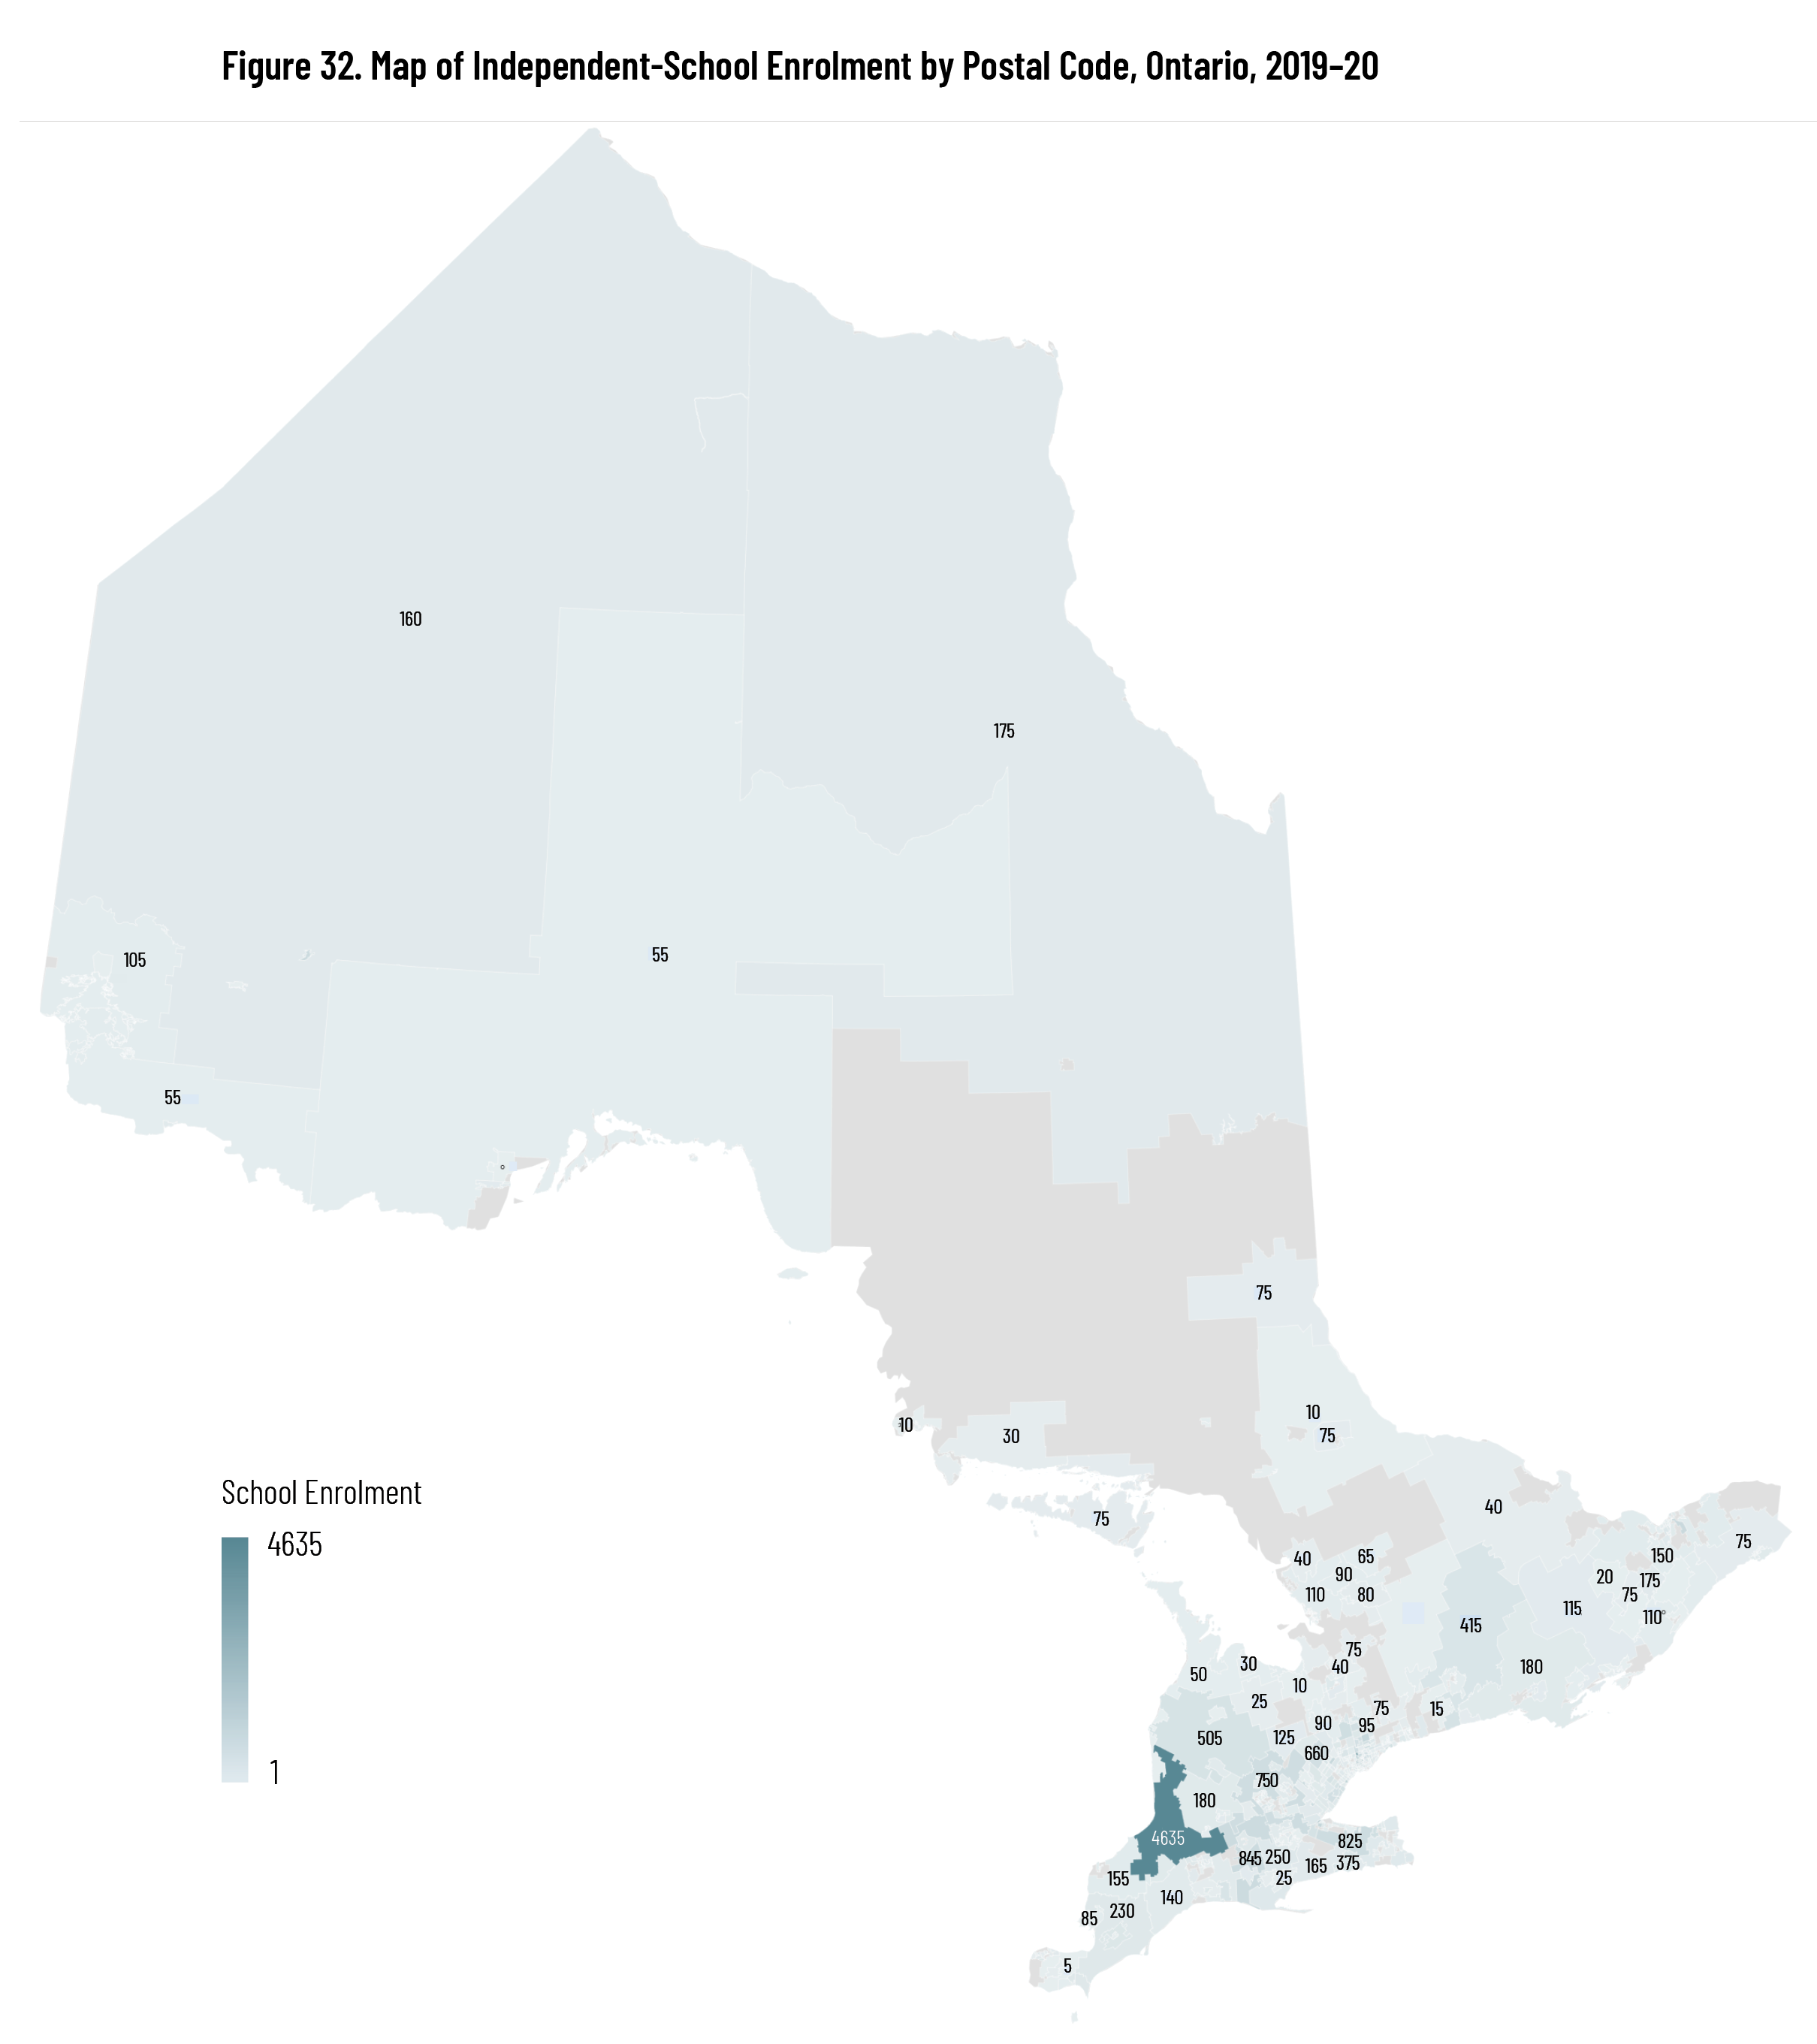
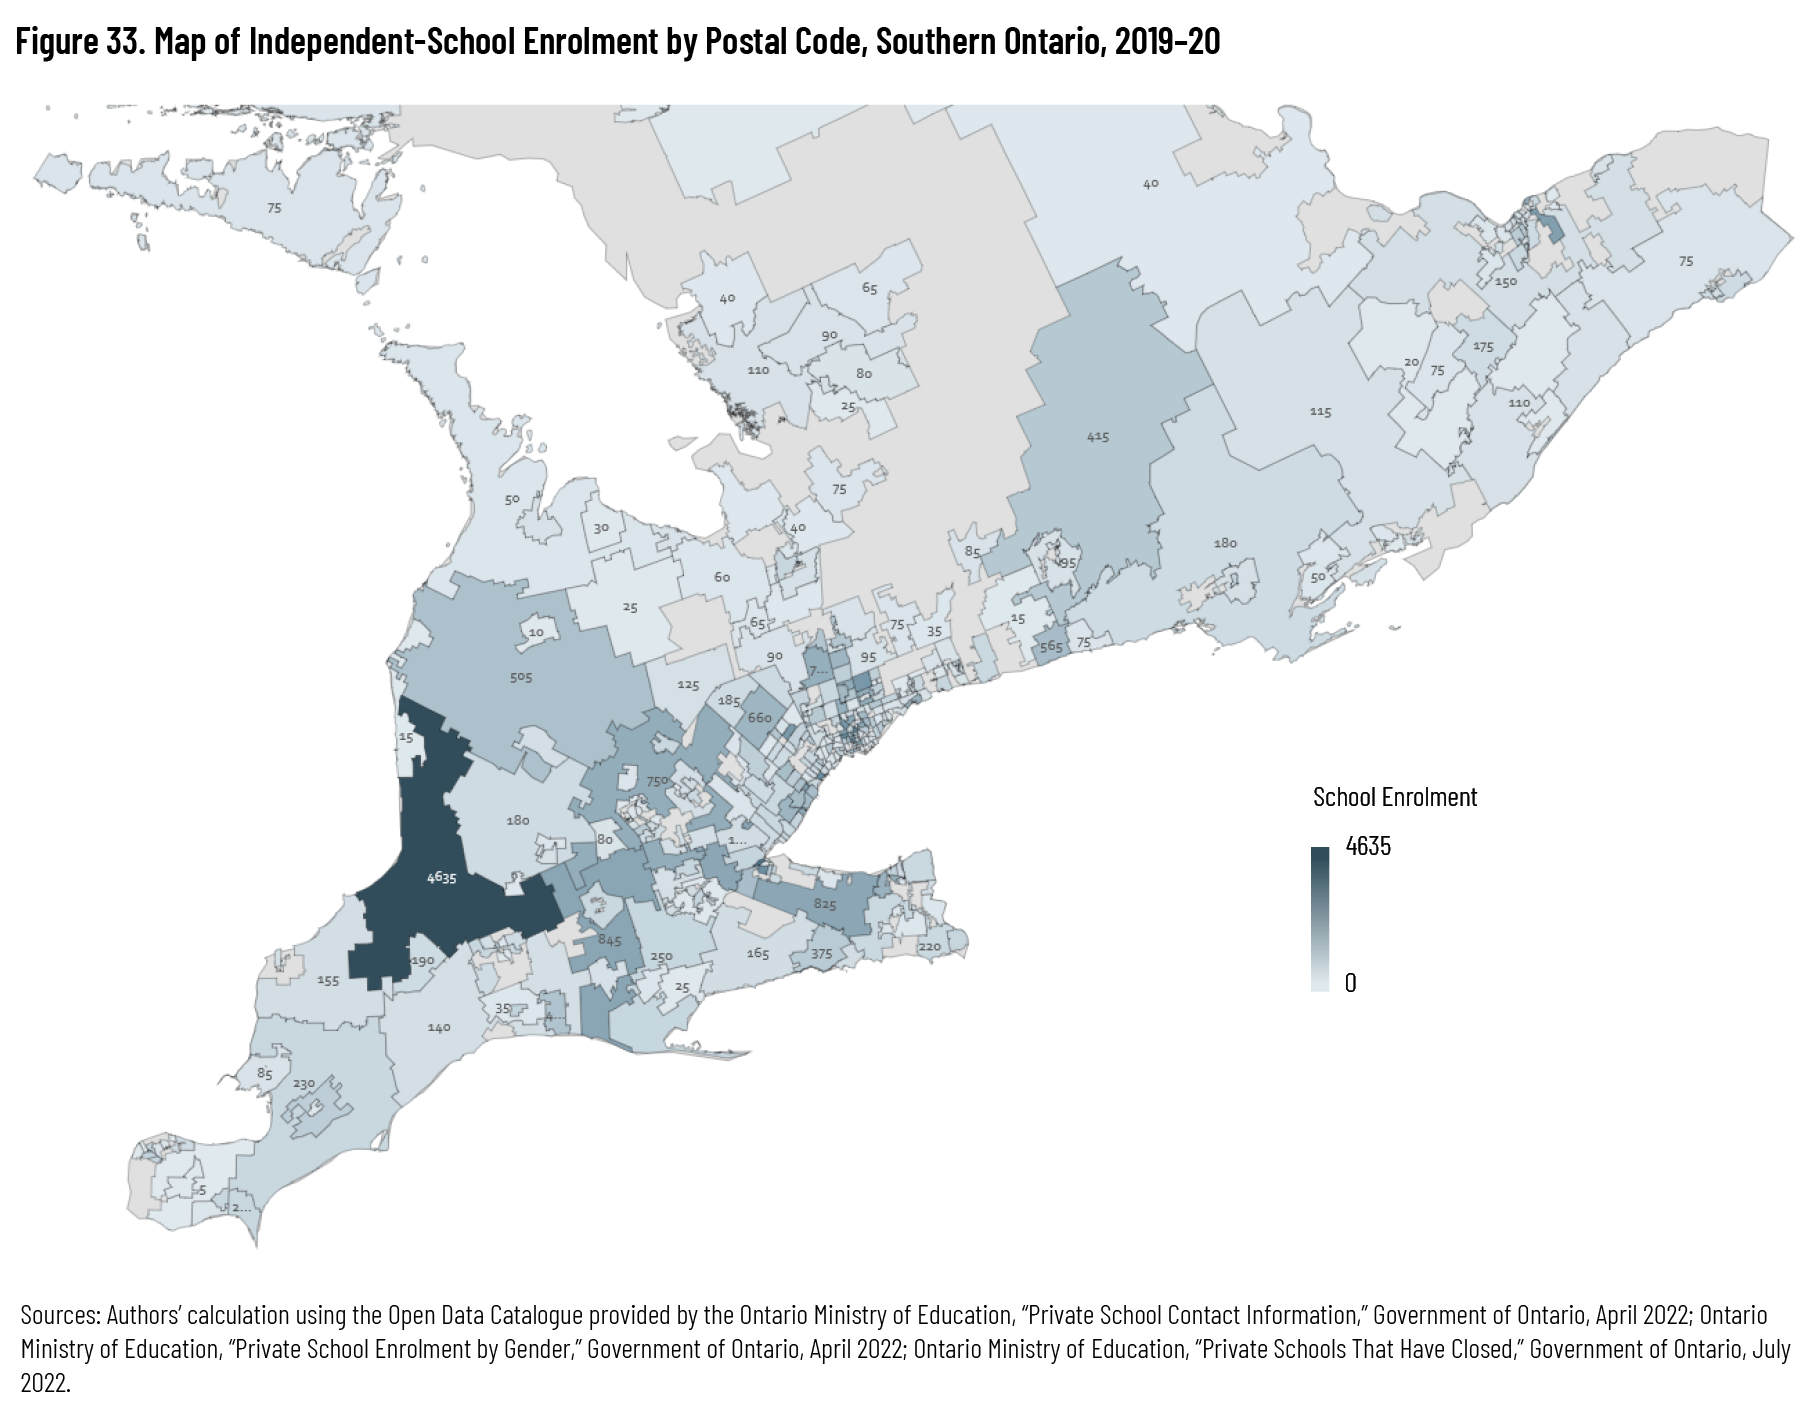
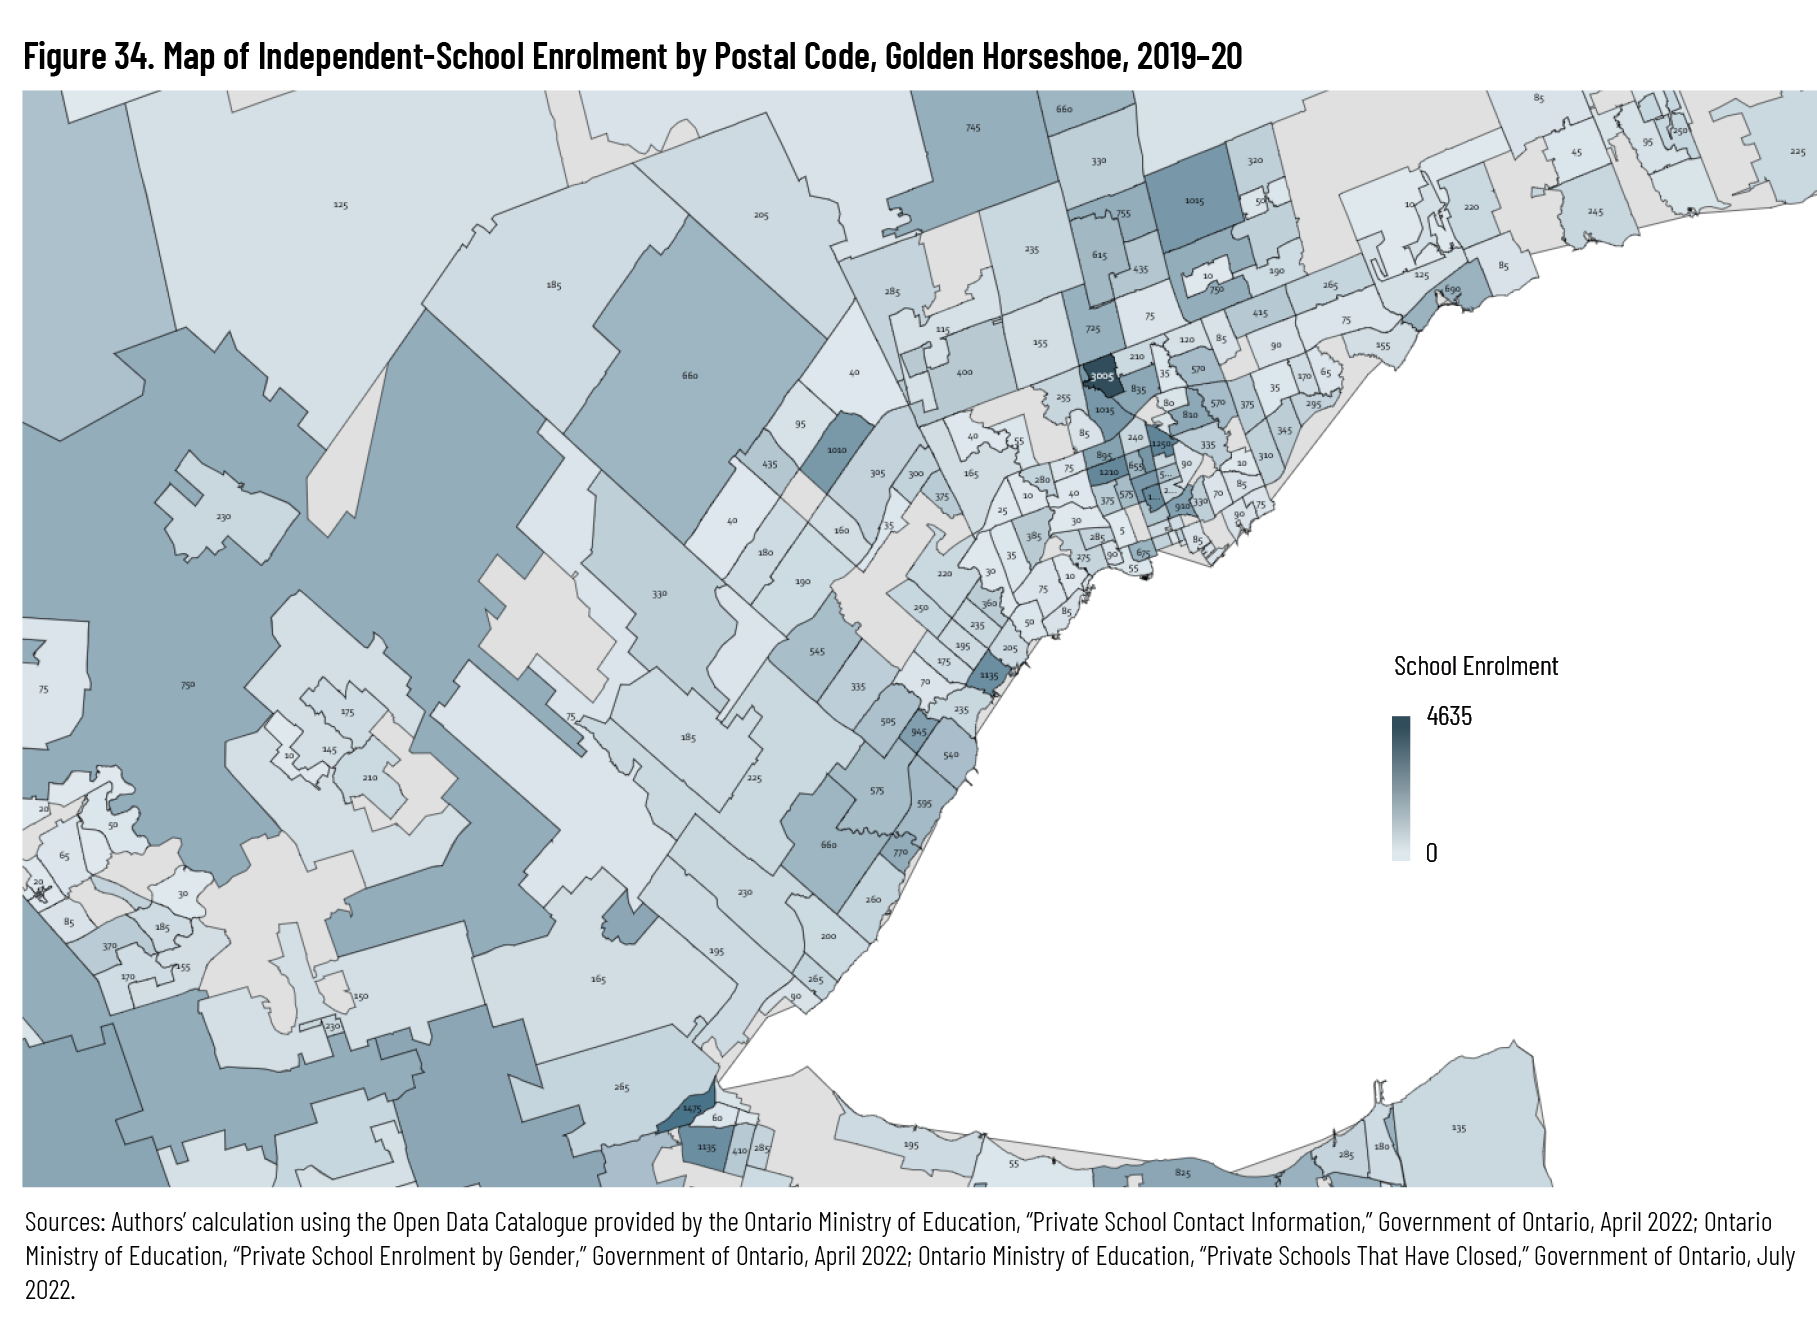
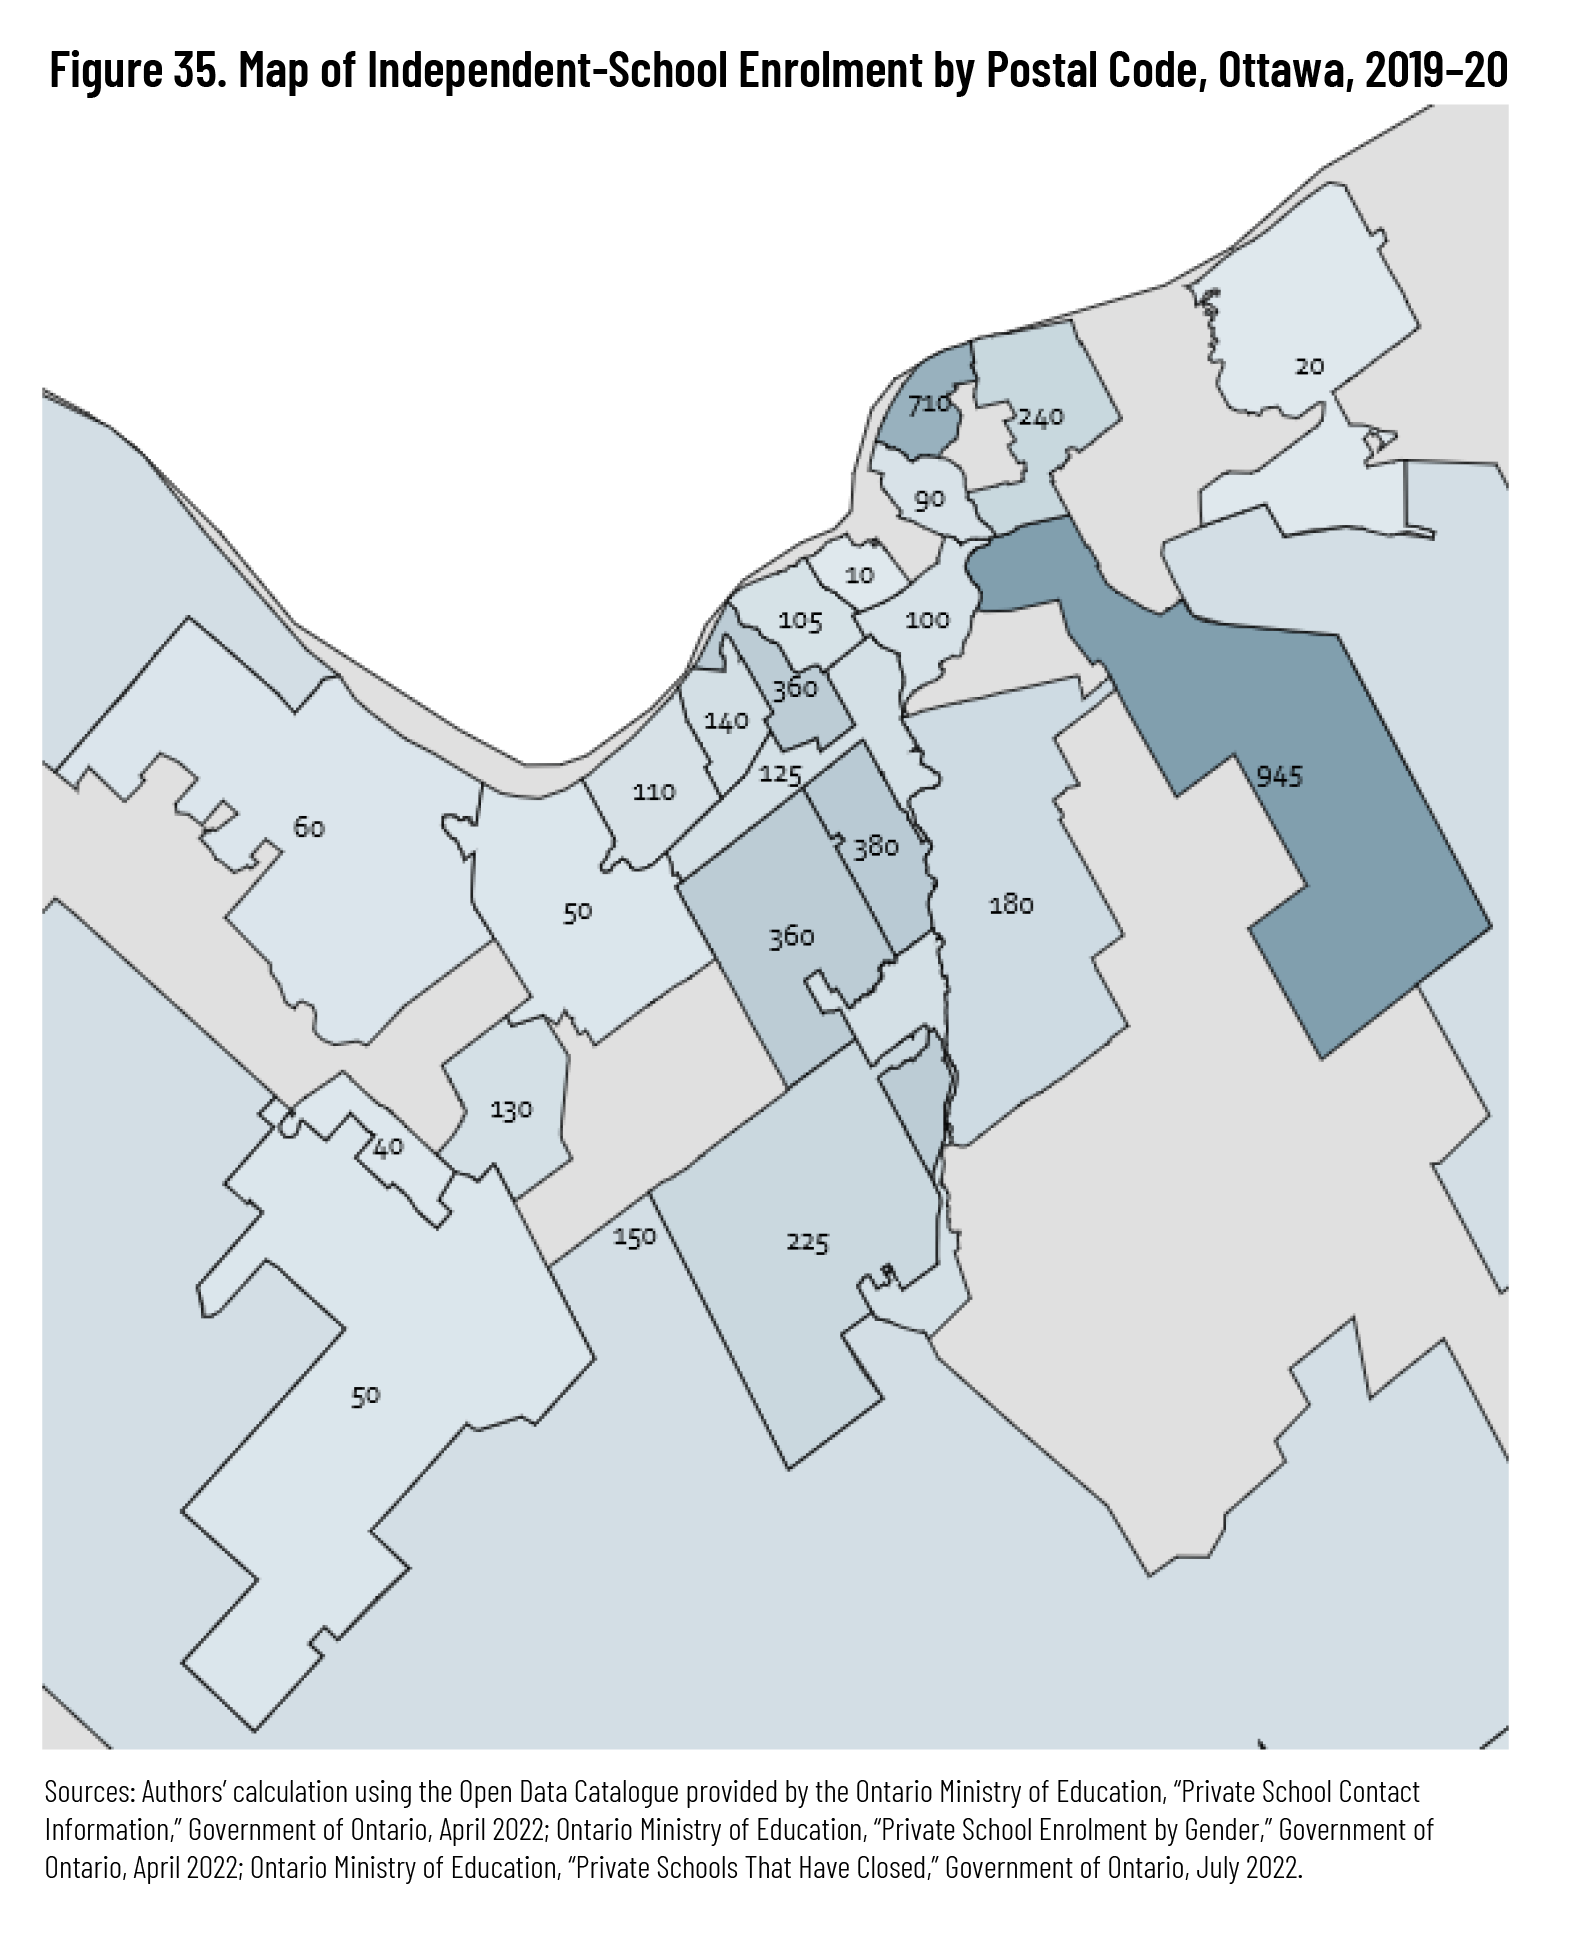
As shown in figure 36 and table 11, fully 69 percent of the schools and, as of 2019– 20, 76 percent of enrolments, are in large urban areas—in line with the 69 percent of Ontarians who also live there. 53 53 Statistics Canada, “Table 98-10-0011-01 Population and Dwelling Counts: Canada and Population Centres,” February 2022, https://www150.statcan.gc.ca/t1/tbl1/en/tv.action?pid=9810001101. In other words, independent schools are not more likely to cater to a large urban population.
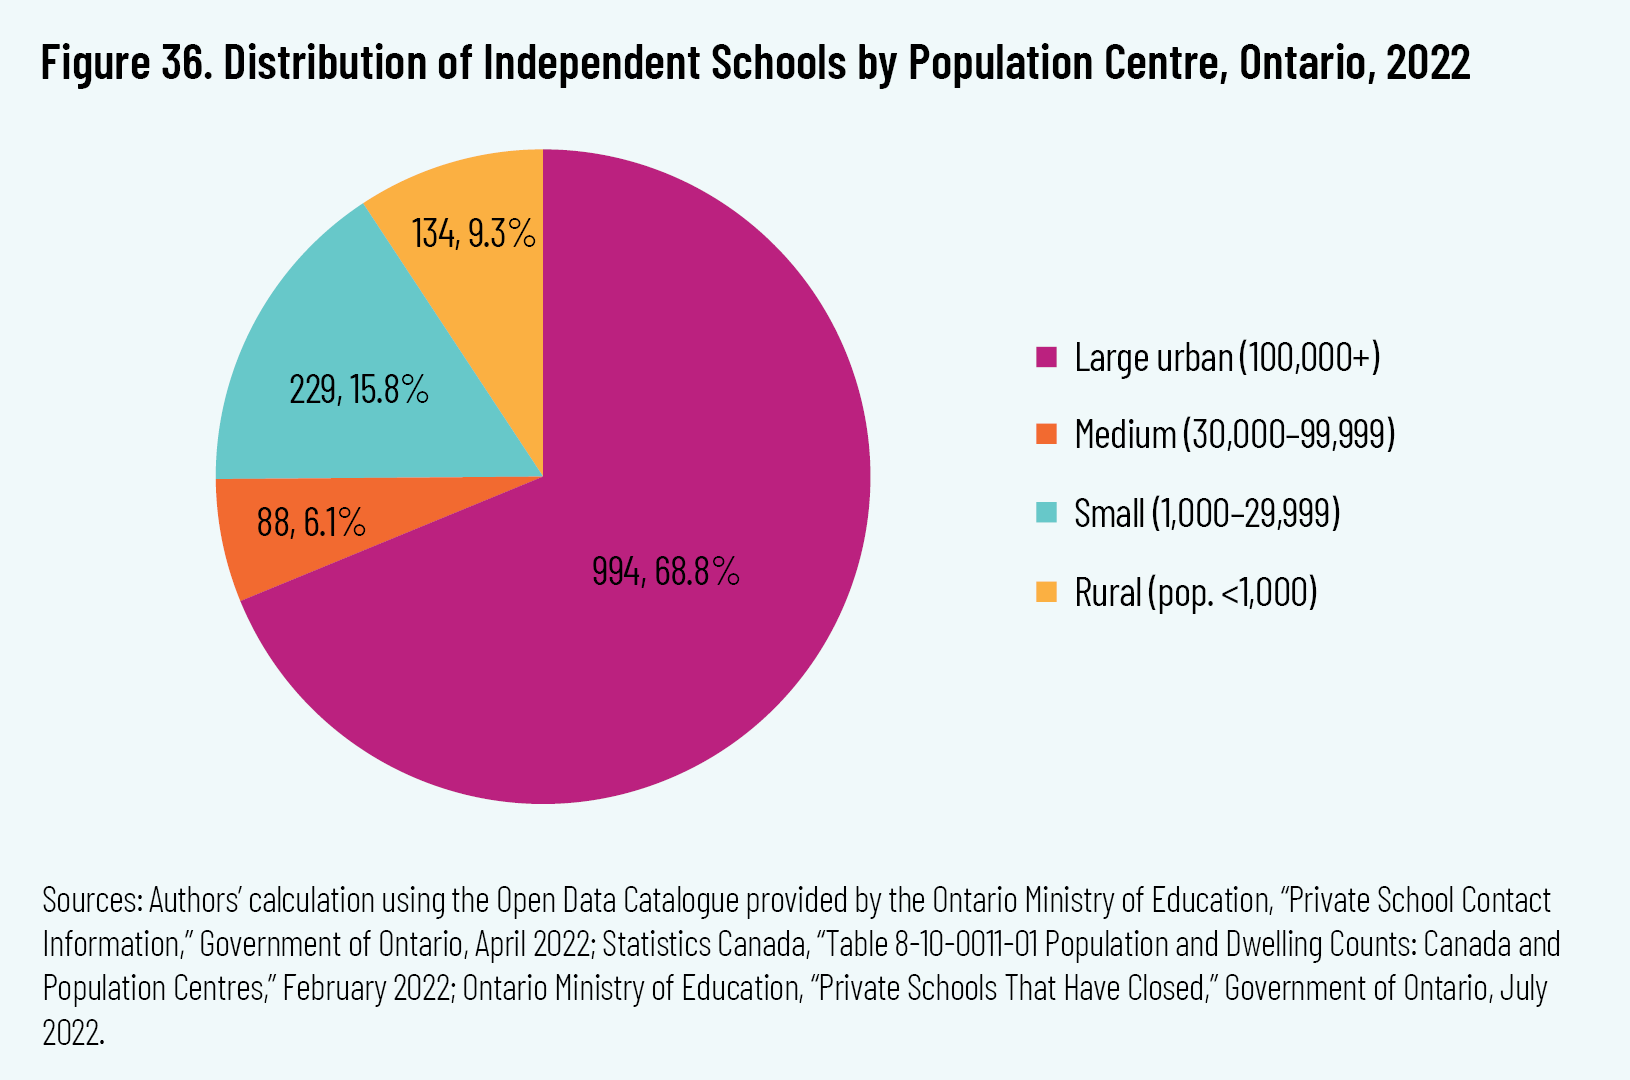
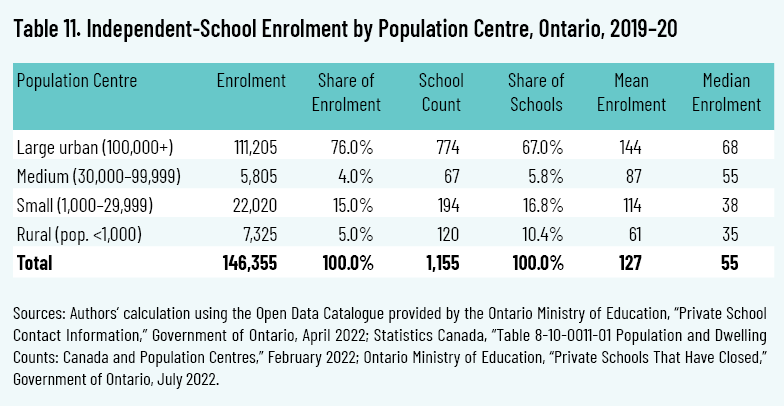
Urbanicity
But there are limitations to population-centre classifications. If the purpose of coding schools by geography is to assess whether or not independent schools serve an urban elite, surely population-centre classifications, alone, are insufficient. They tell us little about the kind of neighbourhood in which the schools are located, and the neighbourhood surely affects the nature of schools and who attends them—even if families commute to attend. Moreover, boundaries can and do get redrawn, even in neighbourhoods where the population or nature of its social and economic activity have not substantively changed. 54 54 M. Turcotte, “Life in Metropolitan Areas,” Statistics Canada, April 2014, https://www150.statcan.gc.ca/n1/pub/11-008-x/2008001/article/10459-eng.htm. Therefore, we also considered urbanicity (i.e. the nature of urban/suburban environments that takes into account factors such as the degree of density and modes of transportation).
To code schools by urbanicity, we started with David Gordon and Mark Janzen’s classifications
55
55
D.L.A. Gordon and M. Janzen, “Suburban Nation? Estimating the Size of Canada’s Suburban Population,” Journal of Architectural and Planning Research 30, no. 3 (2013): 197–220, http://www.jstor.org/stable/43031005.
and applied a modified version as displayed in table 12. To apply this typology to the entire province, including areas outside census metropolitan
areas, we coded independent-school urbanicity by postal code based on each school’s census-tract data.
56
56
Statistics Canada, “Census Profile, 2016,” catalogue no. 98-316-X2016001, November 29, 2017, https://www150.statcan.gc.ca/n1/en/catalogue/98-316-X2016001. The postal code of each independent school was used to find its relevant census tract data and then sorted for its “Mode of Transportation” and “Household and dwelling characteristics.” To determine the dwelling type, a combination of each structural type of dwelling was divided by the total occupied dwelling type. Modes of transportation were combined according to their definitions and divided by the total mode of transportation. The outputs of each dwelling type and journey-to-work together were used to calculate the urbanicity. To verify the classification of each school’s neighbourhood and test urbanicity definitions, a qualitative assessment of the schools’ surroundings was completed using Google Maps (or equivalent).
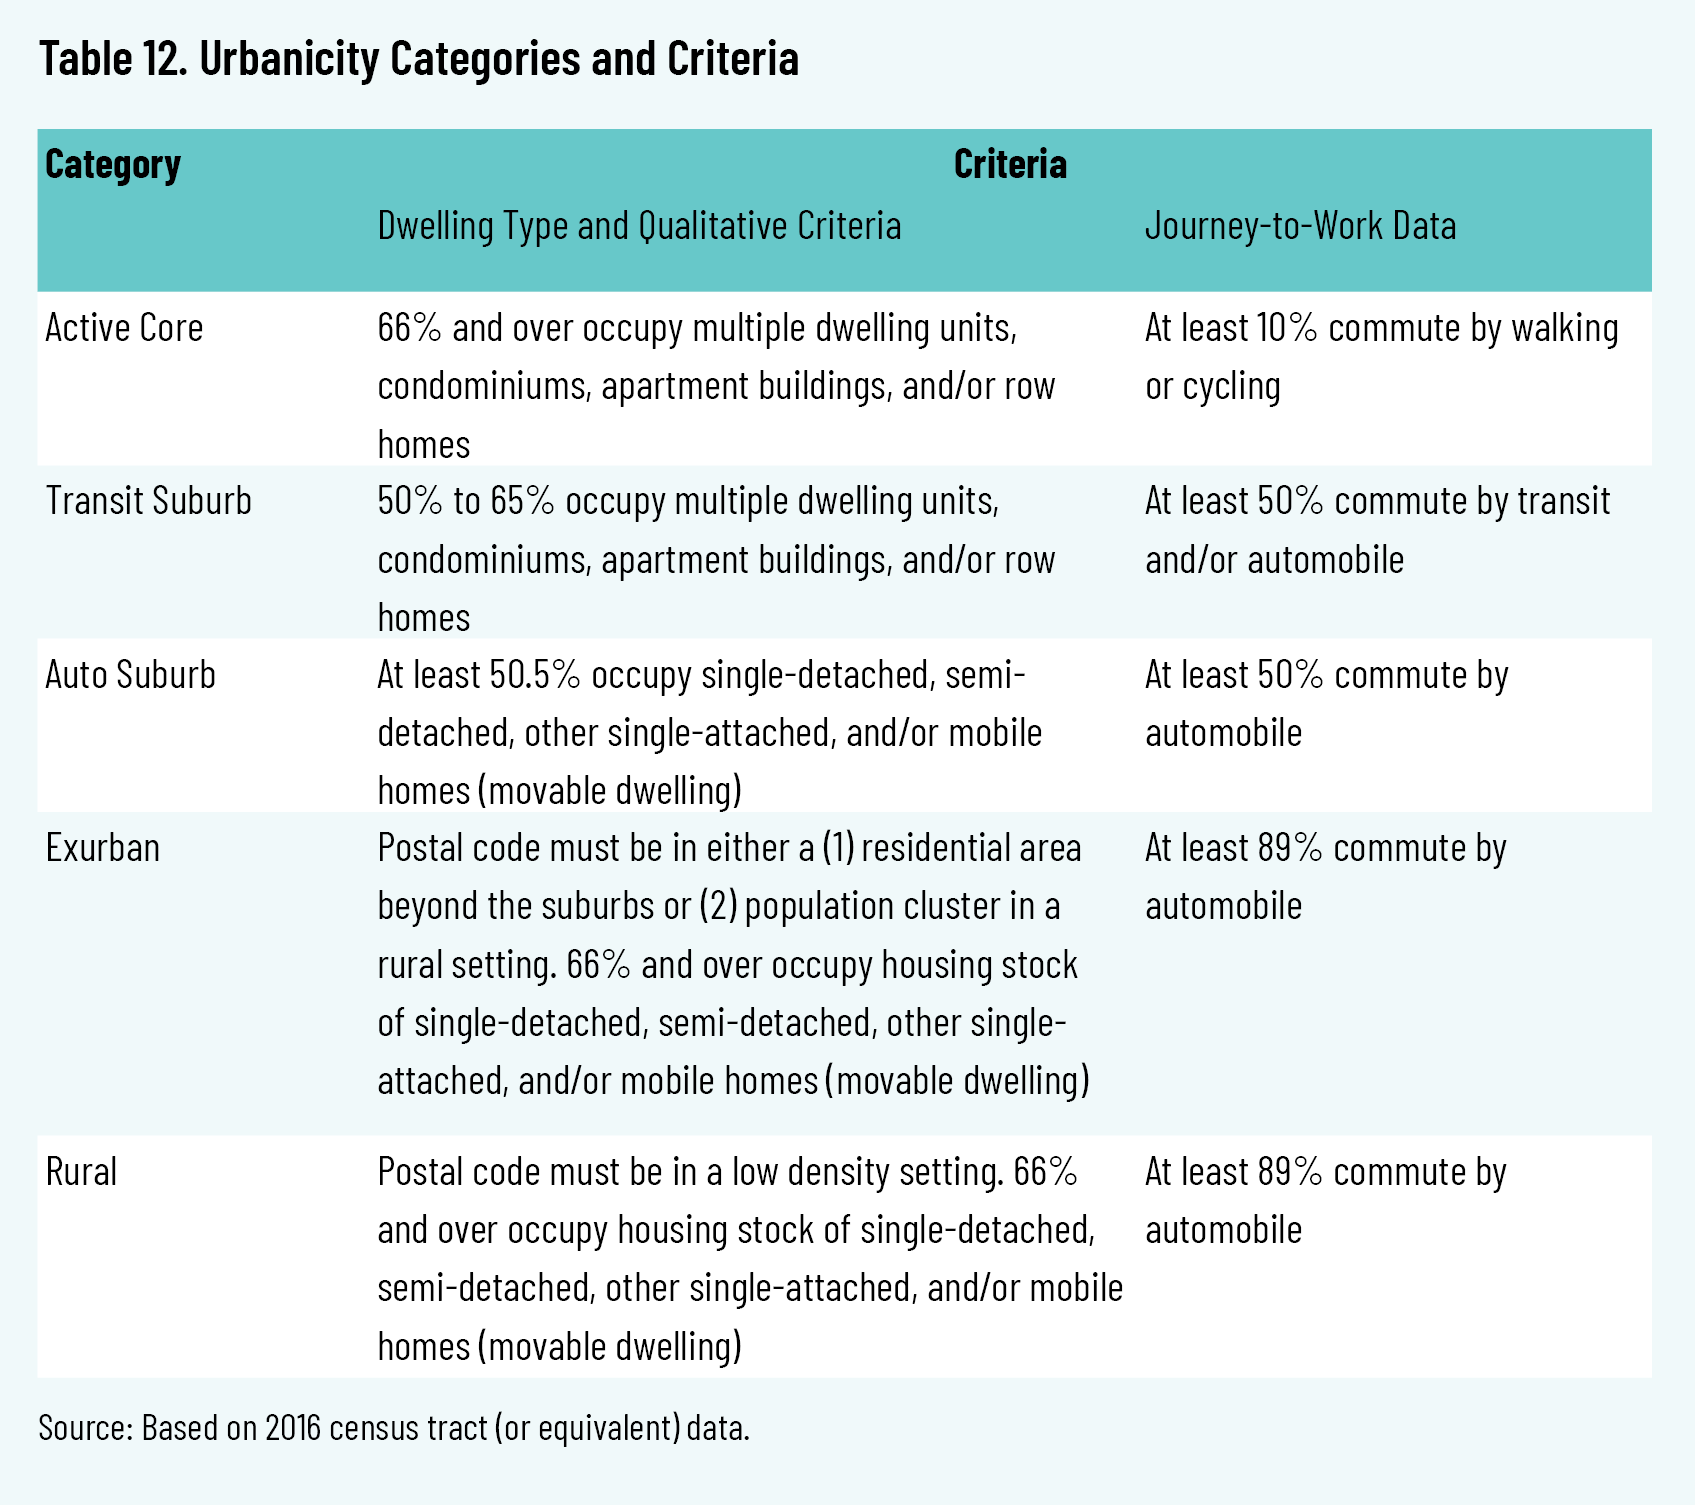
Figure 37 presents an overview of the urbanicity of Ontario independent schools. Interestingly, there is a relatively even distribution of schools across type of urbanicity: 475 independent schools (32.9 percent) are located in active cores or transit suburbs, 557 schools (38.5 percent) are in auto suburbs, and 413 schools (28.6 percent) are in exurban or rural areas. Table 13 reveals this distribution by 2019–20 enrolment. Of note, all of the schools that permanently closed between April and July 2022 were in active cores or transit suburbs (and are excluded from this tally).
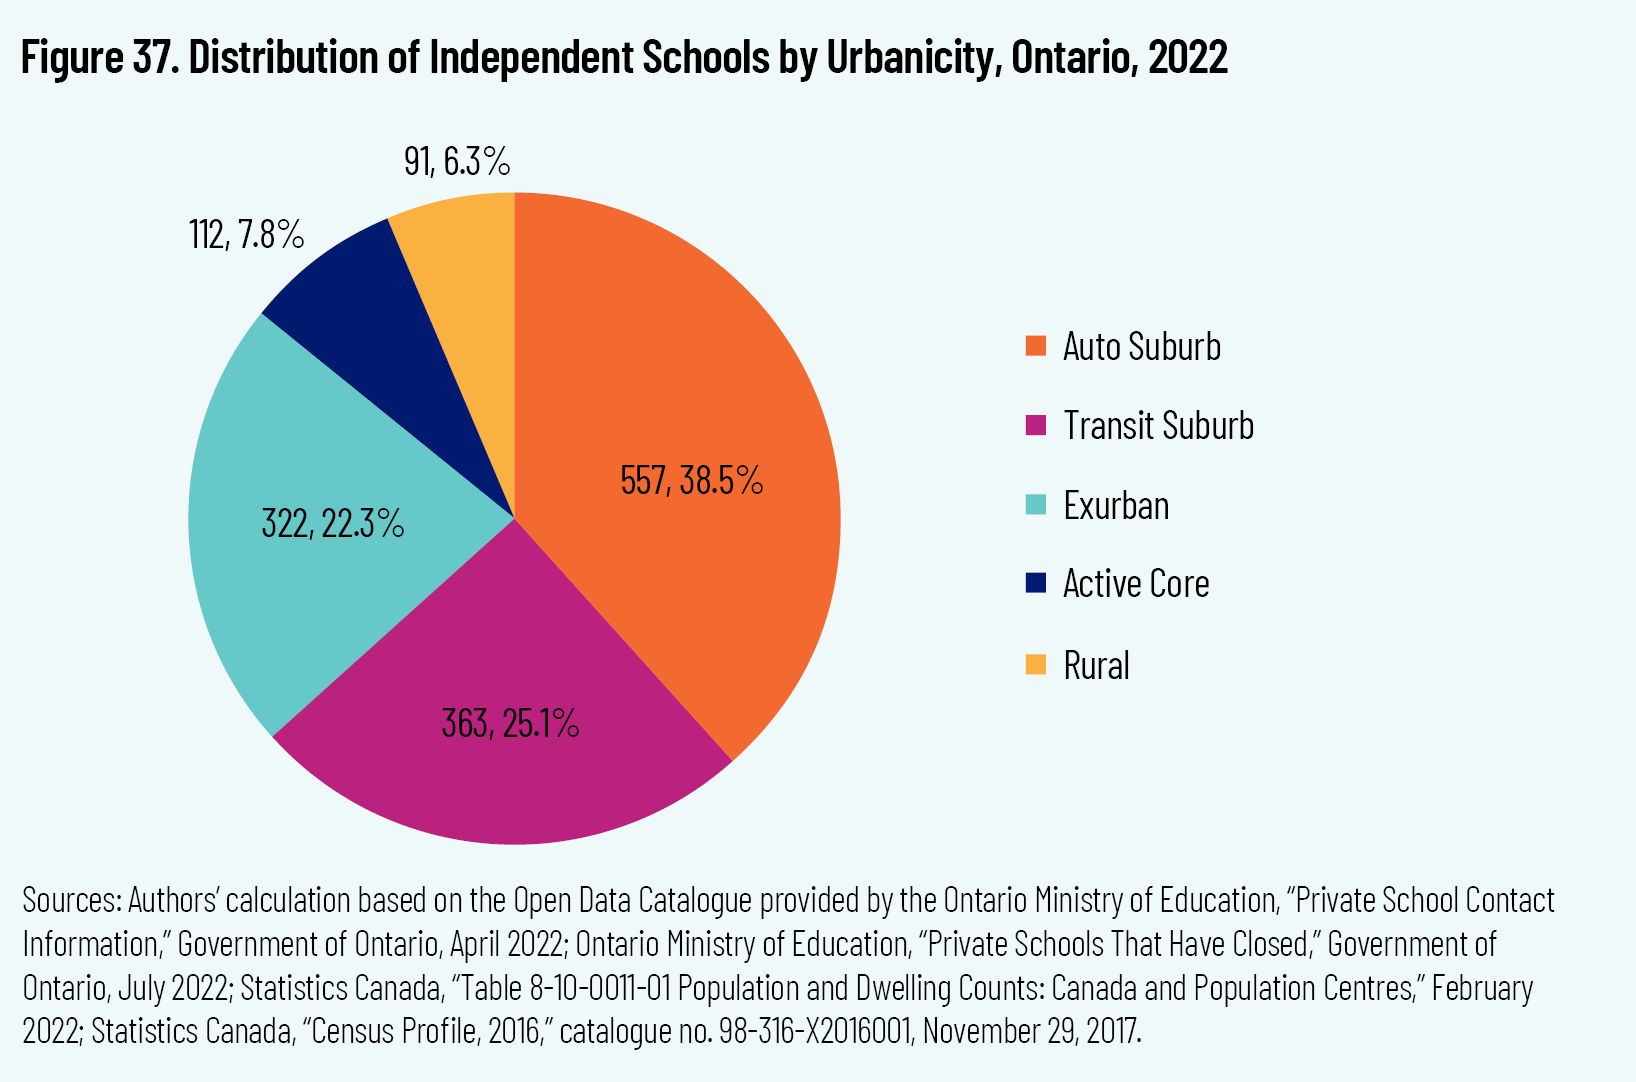
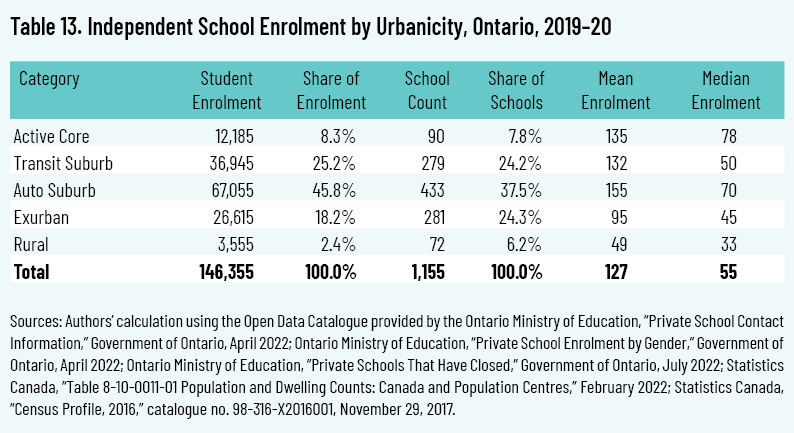
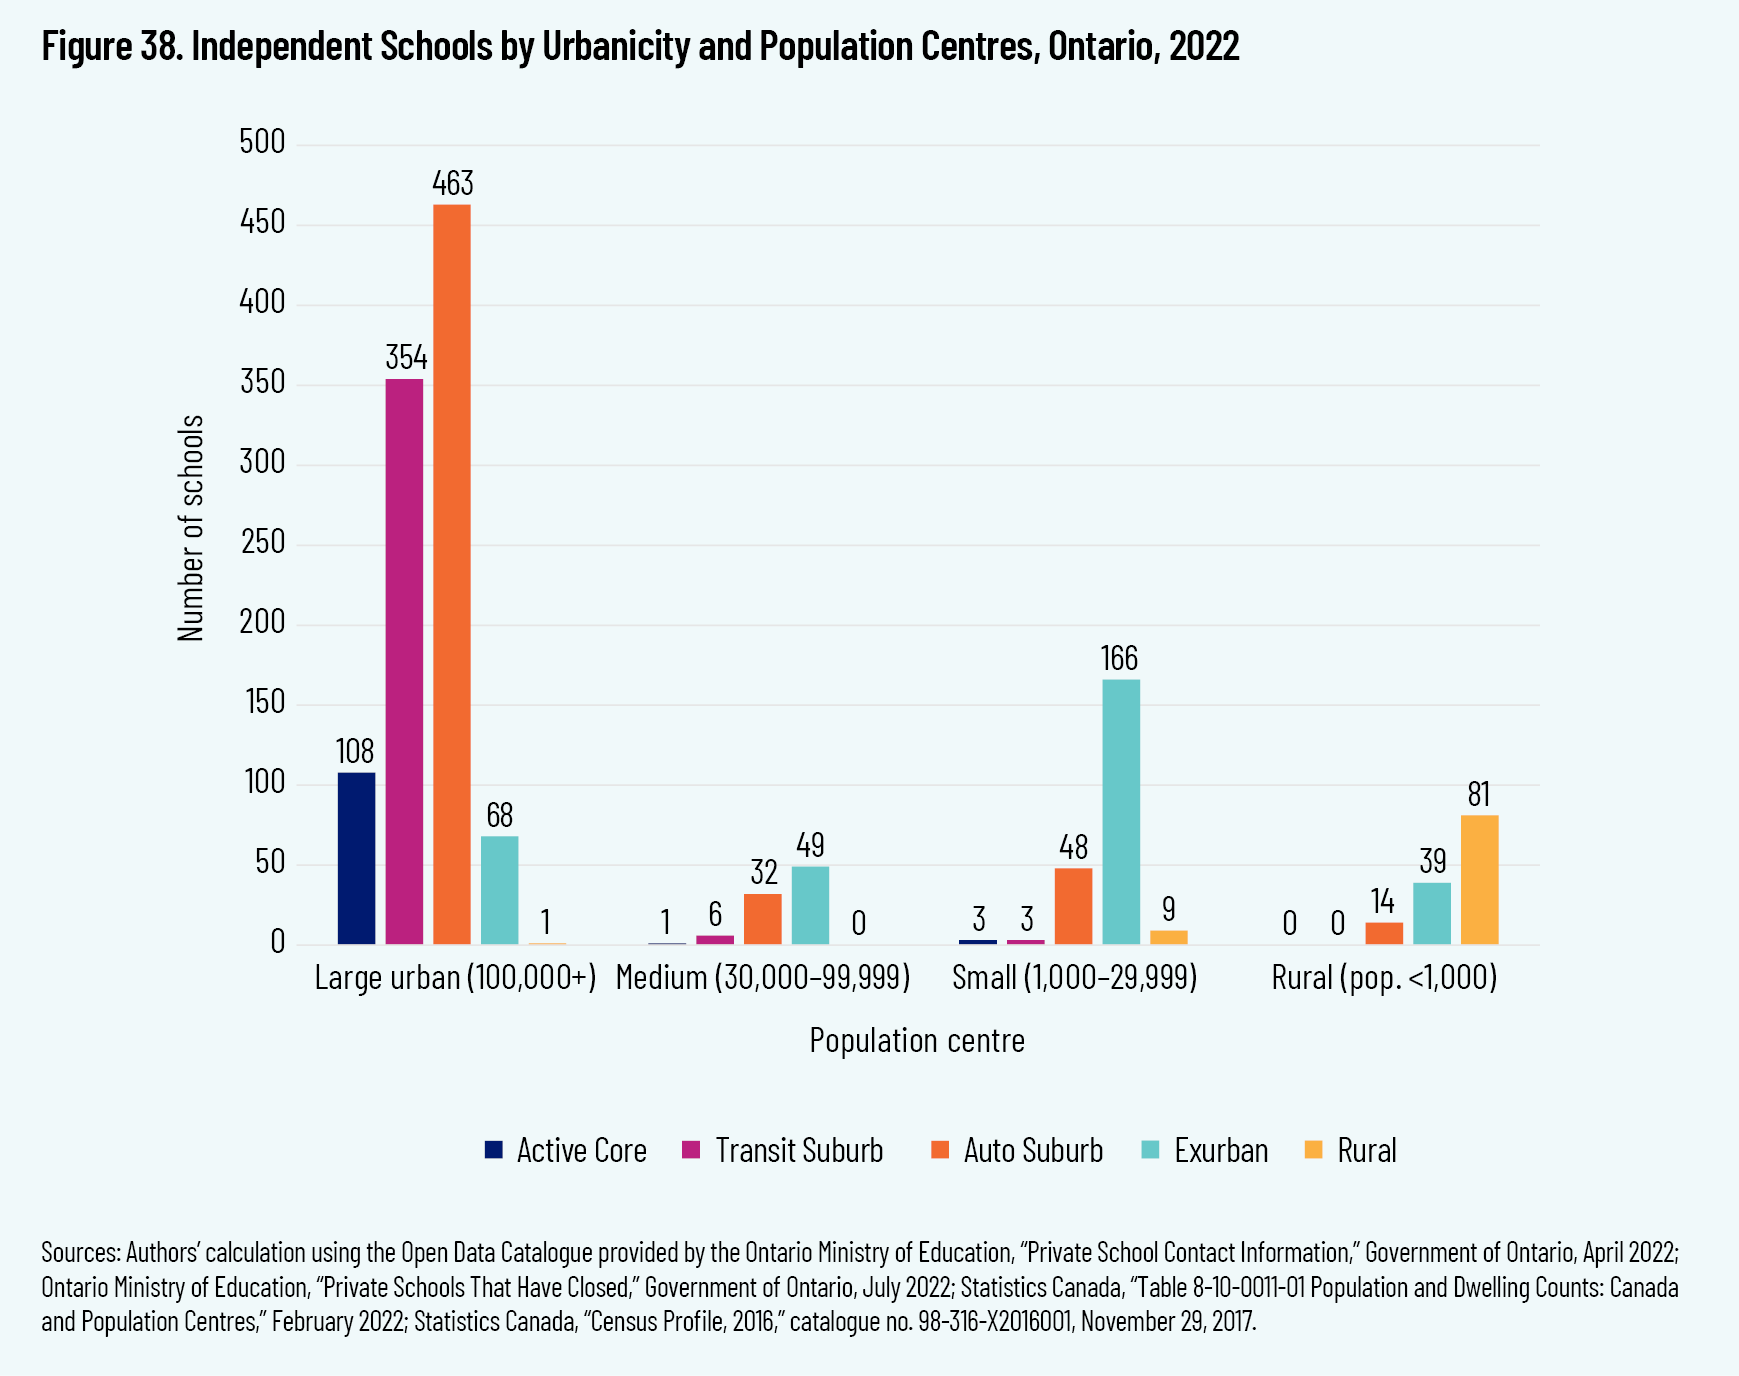
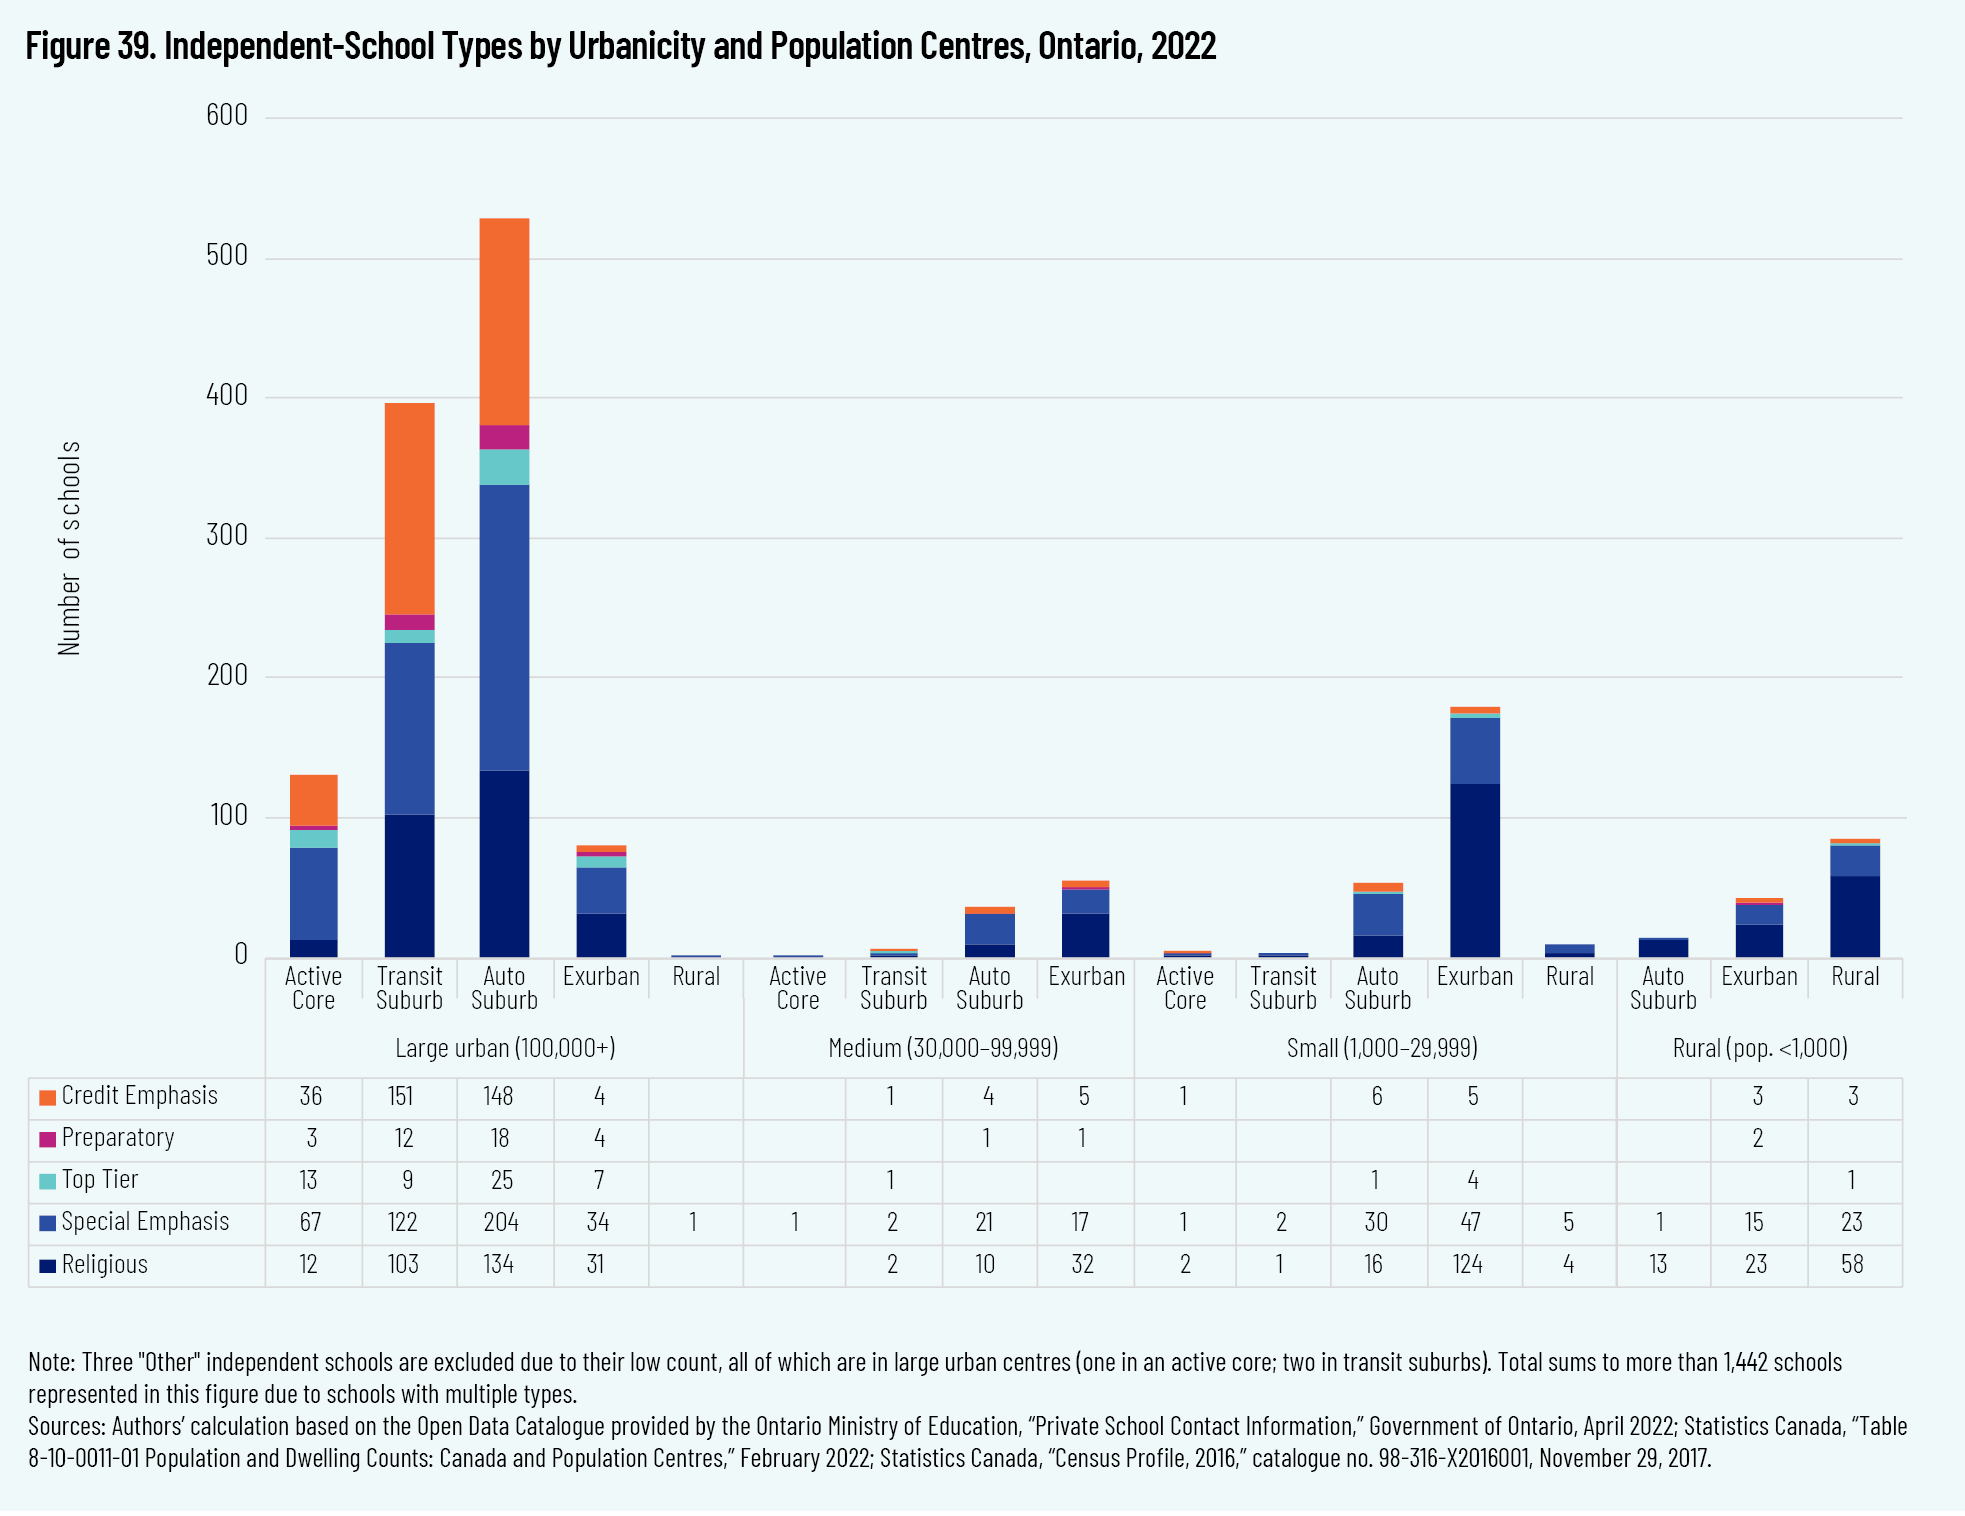
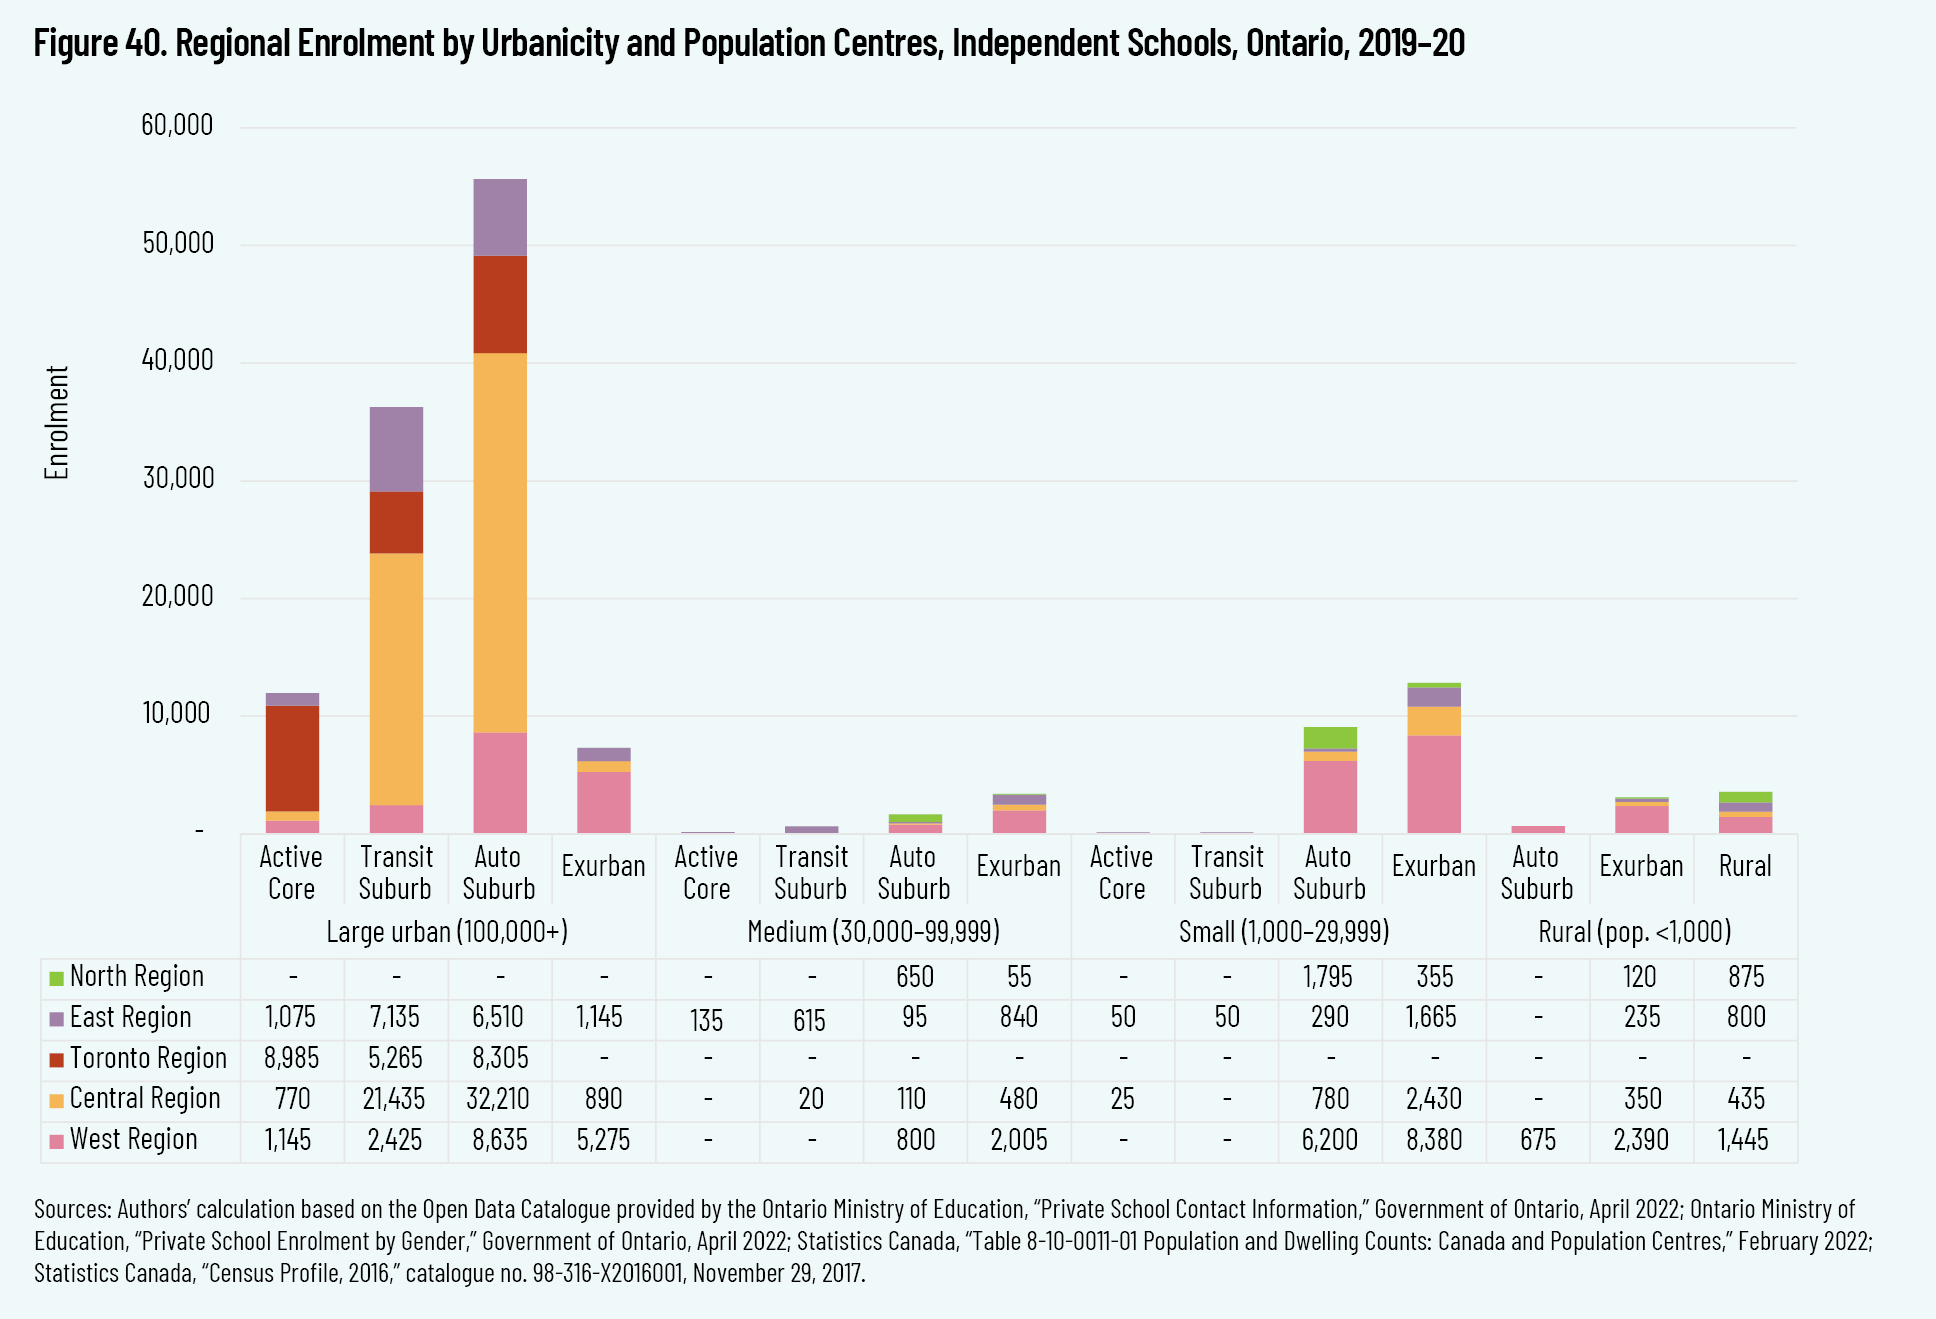
When cross-tabulating population centres with urbanicity, figure 38 shows that a mere 7.5 percent (108) of Ontario independent schools are in the active cores of large urban centres.Of those, just 13 are Top Tier schools (figure 39). If we add in all the large-urban Top Tier schools in transit suburbs (9) and auto suburbs (25), we see that a total of 3.3 percent of Ontario’s independent schools are “elite” institutions in proximity to the centres of culture, finance, and power. Nearly twice as many independent schools (81 schools, 5.6 percent) are in “Rural, Rural” Ontario, in a rural setting serving a population centre below 1,000 residents. Also of note are the more than one in ten independent schools in exurban neighbourhoods serving small population centres. The majority of the schools and enrolments (figures 39 and 40), reflecting the majority of Ontario’s population, are in the auto suburbs and transit suburbs of large population centres.
Discussion
Four primary observations stand out to us from this research: the growth in the sector, the sector’s remarkable diversity overall, the fact that 72.8 percent of the schools are Special Emphasis and/or Religious (but neither type is a majority alone), and the fact that Top Tier schools account for only 4.2 percent of Ontario independent schools and less than one-fifth (18.9 percent) of independent school enrolment.
This is a growing sector, in the number of schools and in enrolment. Since Allison, Hasan, and Van Pelt’s study, the number of independent schools in Ontario has increased 51.5 percent, from 954 in 2013–14 to 1,445 in July 2022. 57 57 Excluding 34 Unclassified and 62 Auxiliary schools Dozens of independent schools permanently close each year, so 491 net new schools are a substantial increase. 58 58 For example, 53 independent schools permanently closed in 2018–19, an additional 28 closed in 2019–20, 48 closed in 2020–21, and 40 closed in 2021–22 at the time of writing (Ministry of Education, “Private Schools That Have Closed”).
Enrolment increased by 25.3 percent from 2013–14 to 2019–20. During this period, only Saskatchewan’s 25.6 percent increase in independent-school enrolment exceeded that of Ontario. But this was 1,125 students in Saskatchewan, compared
to 30,495 in Ontario. For context, Quebec’s independent-school enrolment was up just 2.8 percent (3,486 students). The average increase for Canada as a whole for independent-school enrolment was 14.6 percent. If we exclude Ontario from the
national average, the increase was just 9.6 percent.
59
59
For national comparisons, Statistics Canada data is used (authors’ calculations from Statistics Canada, “Table 37-10-0109-01”). From 2013–14 to 2019–20, Saskatchewan independent-school enrolment increased from 4,386 to 5,511 students, and Ontario independent-school enrolment increased from 124,143 to 154,638 students.
The significant growth in the independent-school sector cannot be attributed to Top Tier schools. In the time that one new Top Tier school has opened, three net new Preparatory schools, 32 net new Religious schools, 131 net new Special Emphasis
schools, and 141 net new Credit Emphasis schools have emerged.
The COVID-19 pandemic has surely influenced this growth. We observe that the pandemic appears to have spurred innovation in educational modalities and helped to normalize online and blended instruction. We suspect that it has also prompted some families to consider alternatives to their local district school.
Ontario’s independent-school landscape is also remarkable for its diversity, whether in pedagogical approaches, educational philosophies, religious and non-religious identities, and/or service to particular kinds of students. District schools either do
not or cannot meet these special needs or desires, since their fundamental purpose is to provide a high-quality education to Ontario’s children considered as a whole. On the individual level, families have individual goals or needs for the education of their children. Of the families participating in the independent-school sector, a smaller number place their children in higher priced Top Tier schools. A larger number place their children in Special Emphasis or Religious schools. We hope to conduct future research about these latter families, their household incomes, and the extent to which tuition payments represent a financial hardship for them.
Yet Top Tier schools continue to receive the focus of media coverage, distorting the public’s understanding of the sector. Here are just four recent examples:
A June 18, 2022, article in the Globe and Mail cites a Top Tier association in stating the average independent-school tuition. 60 60 G. Livingston, “Pandemic Learning Gaps Have Parents Digging Deep to Put Their Kids in Private School,” Globe and Mail, June 18, 2022, https://www.theglobeandmail.com/investing/personal-finance/household-finances/article-private-school-enrollment-rising-can-you-afford-it/.
An April 10, 2022, article in the Toronto Star cites Top Tier school’s experience in claiming that “private schools . . . won big in Ontario’s rapid testing program.” 61 61 S. Mojtehedzadeh, R. Mendleson, and A. Bailey, “Private Schools, Large Firms Won Big in Ontario’s Rapid Testing Program, While Hot Spots Lost Out, Star Analysis Finds,” Toronto Star, April 10, 2022, https://www.thestar.com/news/investigations/2022/04/10/just-20-of-rapid-tests-went-to-ontarios-covid-19-hot-spots-star-analysis-finds.html.
A March 17, 2022, article in the Toronto Star gives only Top Tier schools as examples when discussing the independent sector. 62 62 I. Teotonio, K. Rushowy, and B. Martens, “Ontario Stays Firm on Ending School Mask Mandates. But Some Private Schools Will Keep Them,” Toronto Star, March 17, 2022, https://www.thestar.com/news/gta/2022/03/17/ontario-stays-firm-on-ending-school-mask-mandates-but-some-private-schools-will-keep-them.html.
A September 10, 2021, article in CP24 refers to government decisions affecting all independent schools but uses only Top Tier schools as examples. 63 63 C. Herhalt, “Private Schools Given Rapid Antigen COVID-19 Tests; Ontario Says They Can No Longer Be Used on Students,” CP24, September 10, 2021, https://www.cp24.com/news/private-schools-given-rapid-antigen-covid-19-testsontario-says-they-can-no-longer-be-used-on-students-1.5580560.
In fairness to journalists, nearly three out of four Top Tier schools and four out of five Top Tier students are located in the greater Toronto area, where most of these journalists presumably live and work. It is likely that the concentration of these
schools near the concentration of Canadian media contributes to the assumption that Top Tier schools are typical of the sector. However, given that only 61 of 1,445 independent schools (4.2 percent) are Top Tier and account for just 18.9 percent of sector enrolment, we suggest that the time has come to retire the practice of presenting them as representative of the sector as a whole.
Our study presents the distribution of schools in Ontario’s independent sector in terms of size, program type, program level, accreditation, affiliation, and location. Table 14 provides a summary of our findings. In a province in which no public funding goes to support non-district schools, some Ontario parents appear to value what these independent schools provide highly enough to be willing to pay the required tuition, over and above the taxes they pay to support district schools as well. In addition to high-quality district schools, it is clear that independent schools are also important to many families. We urge the Ministry of Education, policymakers, researchers, and the public in general to seek a greater understanding of these Ontarians, who are our neighbours, and the needs or desires that lead them to make these choices.
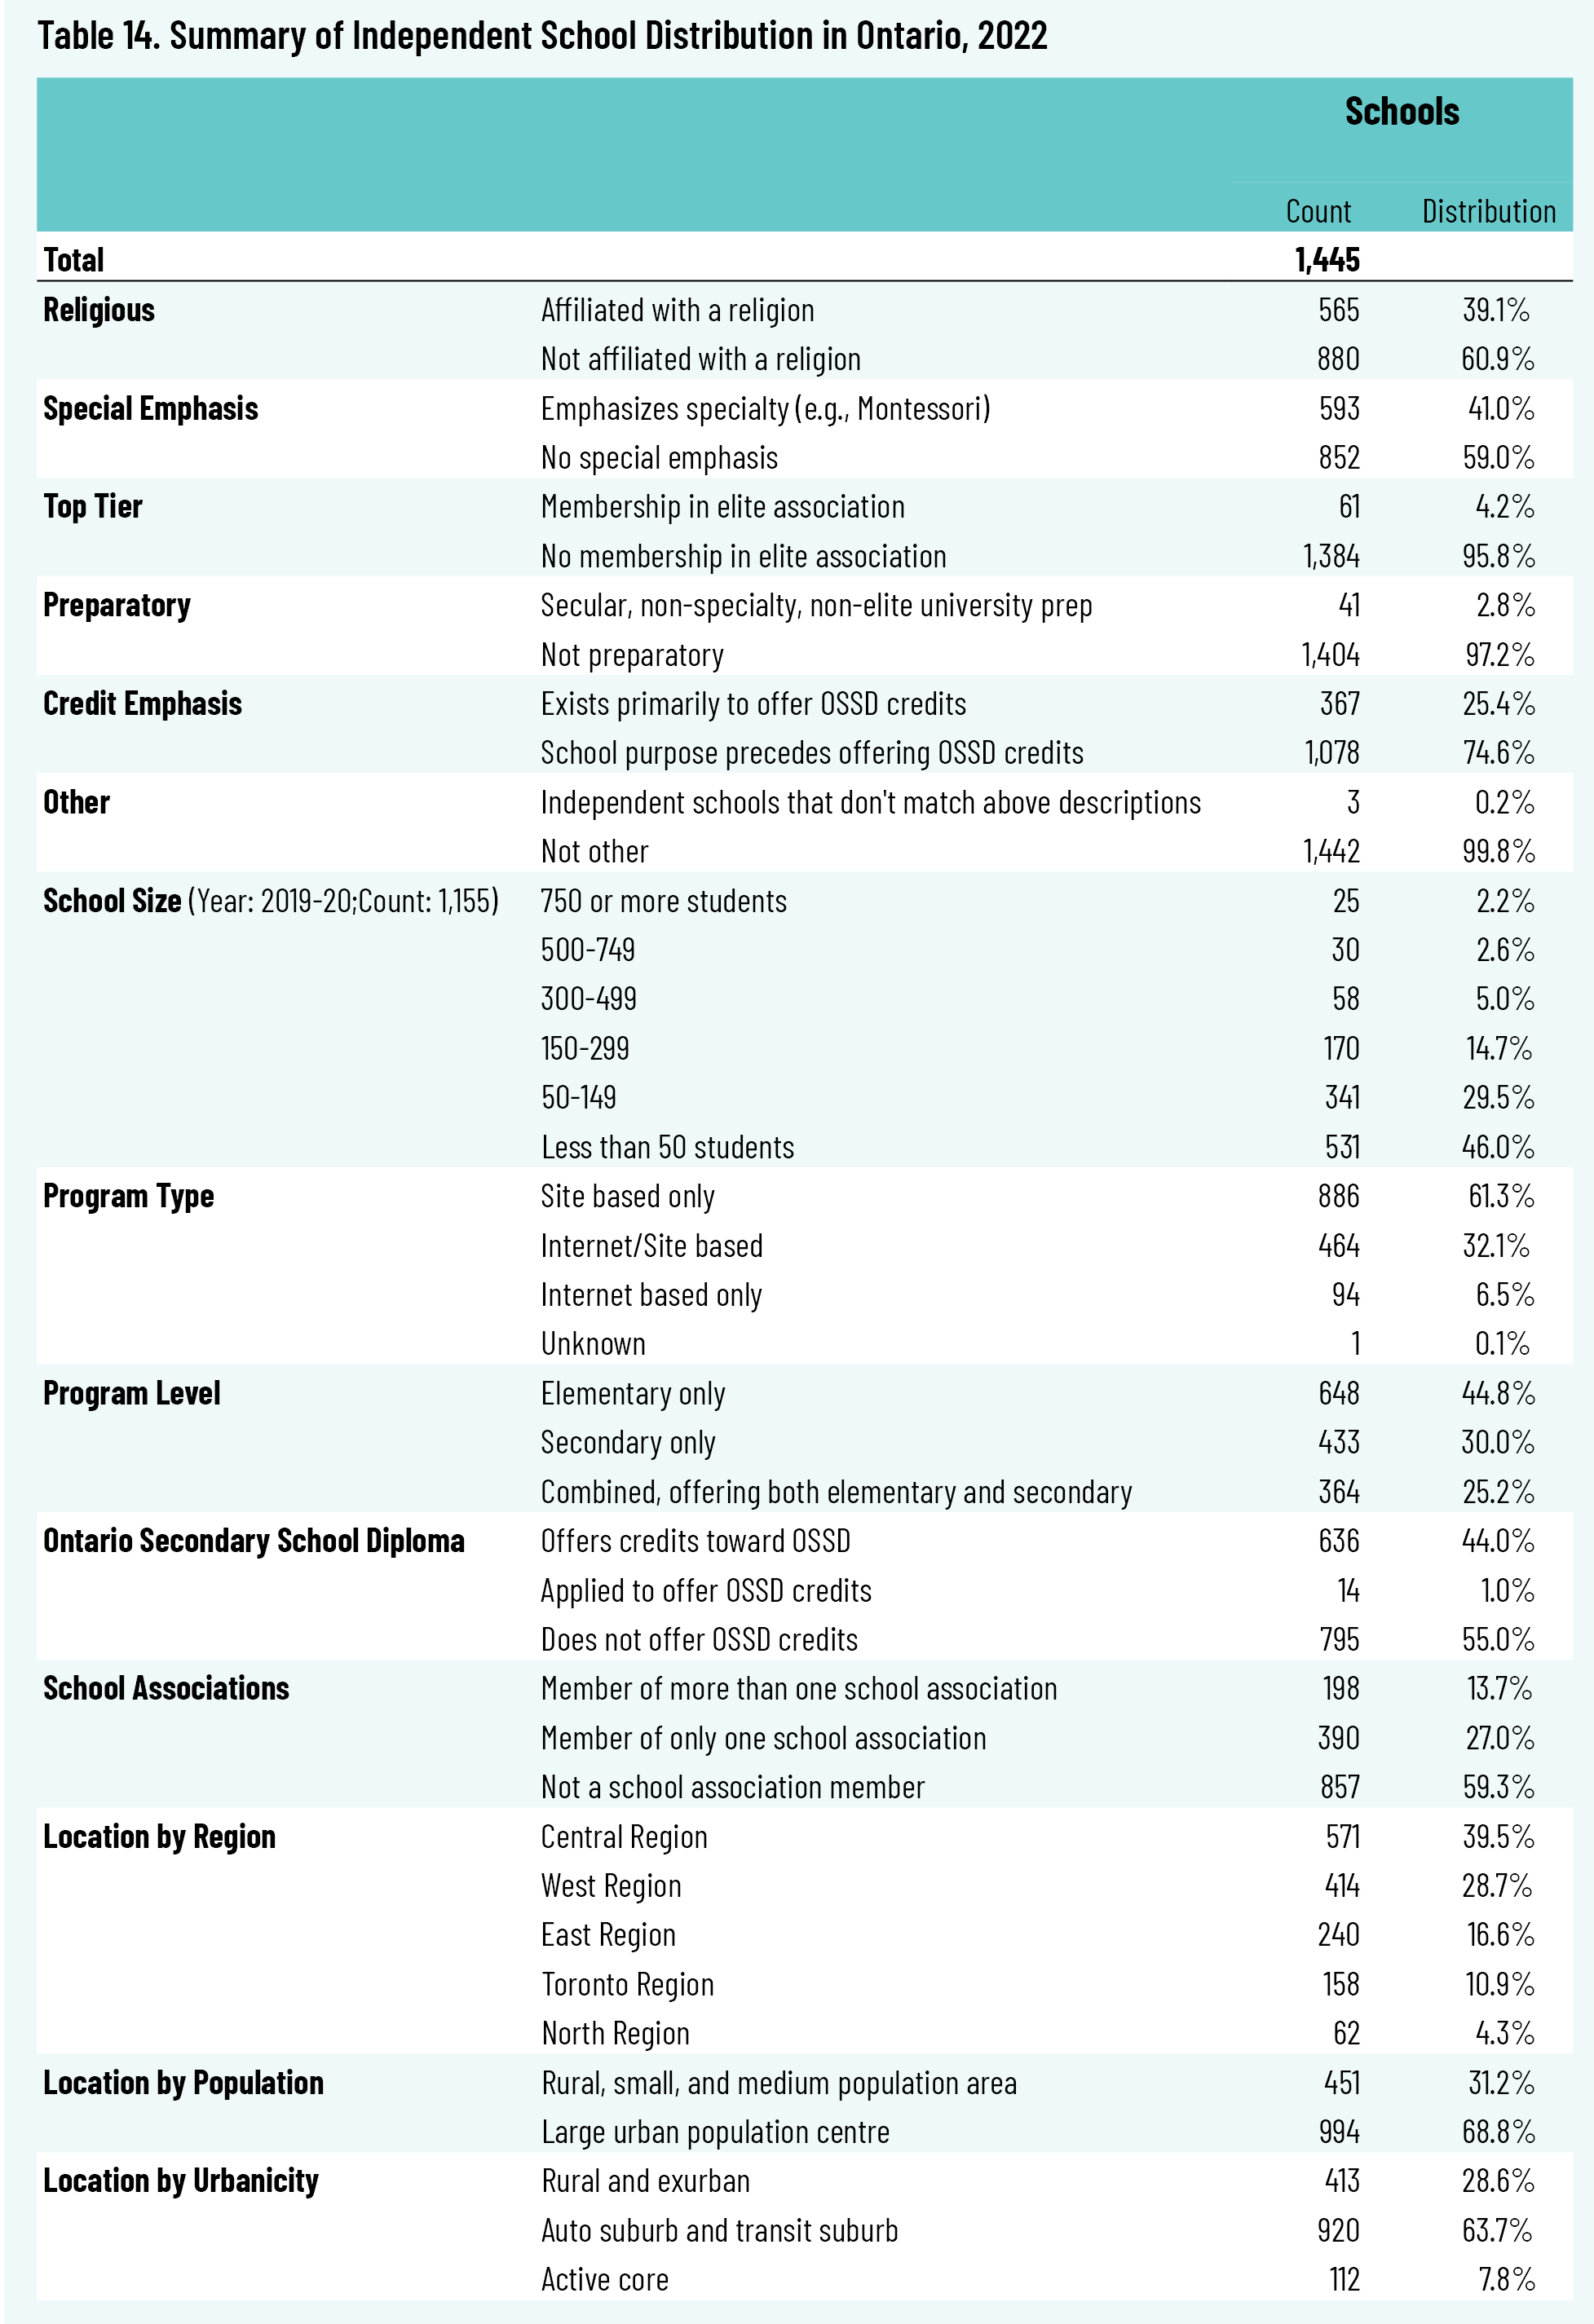
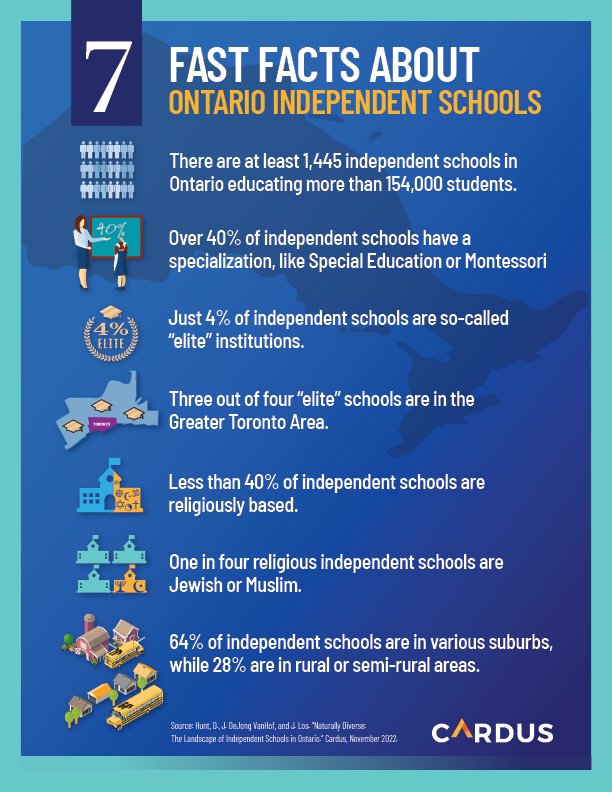
References
Allison, D.J., S. Hasan, and D. Van Pelt. “A Diverse Landscape: Independent Schools in Canada.” Fraser Institute, June 2016. https://www.fraserinstitute.org/studies/a-diverse-landscape-independent-schools-in-canada.
American University School of Education. “What Is Holistic Education? Understanding the History, Methods, and Benefits.” May 13, 2020. https://soeonline.american.edu/blog/what-is-holistic-education/.
Arrows F., and J.P. Miller. “To Name the World: A Dialogue About Holistic and Indigenous Education.” ENCOUNTER: Education for Meaning and Social Justice 25, no. 3 (2012): 1–11.
Association of Waldorf Schools of North America. “Waldorf Education: An Introduction.” 2022. https://www.waldorfeducation.org/waldorf-education.
Basham, J.D., T.E. Hall, R.A. Carter, Jr., and W.M. Stahl. “An Operationalized Understanding of Personalized Learning.” Journal of Special Education Technology 31, no. 3 (2016): 126–36. https://doi.org/10.1177/0162643416660835.
Bauer, S.W. “What Is Classical Education?” Well-Trained Mind, June 3, 2009, https://welltrainedmind.com/a/classical-education/.
Bedrick, J., and M. Ladner. “Let’s Get Small: Microschools, Pandemic Pods, and the Future of Educationin America.” Backgrounder, Heritage Foundation, 2020. https://www.heritage.org/sites/default/files/2020-10/BG3540.pdf.
Bennett, P.W. The State of the System: A Reality Check on Canada’s Schools. Montreal and Kingston: McGill-Queen’s University Press, 2020.
Bowe, A.G., C.D. Desjardins, L.M. Covington Clarkson, and F. Lawrenz. “Urban Elementary SingleSex Math Classrooms: Mitigating Stereotype Threat for African American Girls.” Urban Education 52, no. 3 (2017): 370–98. https://doi.org/10.1177/0042085915574521.
Broughman, S.P., B. Kincel, J. Willinger, and J. Peterson. “Characteristics of Private Schools in the United States: Results From the 2019–20 Private School Universe Survey.” Institute of Education Sciences, September 2021. https://nces.ed.gov/pubs2021/2021061.pdf.
Canadian Council of Montessori Administrators. “CCMA Schools.” https://www.ccma.ca/ccma-schools/.
Clark, K.W., and R.S. Jain. The Liberal Arts Tradition: A Philosophy of Christian Classical Education. Camp Hill, PA: Classical Academic Press, 2013.
Coker, J.S., E. Heiser, L. Taylor, and C. Book. “Impacts of Experiential Learning Depth and Breadth on Student Outcomes.” Journal of Experiential Education 40, no. 1 (2017): 5–23. https://doi.org/10.1177/1053825916678265.
College Board. “AP Program.” https://ap.collegeboard.org/.
Converso, J.A., S.P. Schaffer, and I.J. Guerra. “Distributed Learning Environment: Major Functions, Implementation, and Continuous Improvement.” Learning Systems Institute, Florida State University, October 1999.
Dervaitis, A. “Micro Schools: The Wave of the Future.” Our Kids. https://www.ourkids.net/school/micro-schools.
Duarte, J., and C. Robinson-Jones. “Bridging Theory and Practice: Conceptualisations of Global Citizenship Education in Dutch Secondary Education.” Globalisation, Societies and Education (March 6, 2022): 1–17. https://doi.org/10.1080/14767724.2022.2048800.
Education Act, R.S.O. 1990, c. E.2. https://www.ontario.ca/laws/statute/90e02.
Geisler, C., and J. Swarts. Coding Streams of Language. WAC Clearinghouse; Boulder: University Press of Colorado, 2019. https://doi.org/10.37514/PRA-B.2019.0230.
Glinos, P.J. “Historical Analysis of School Choice in Ontario: Freedom and Inequality.” Encounters in Theory and History of Education 22 (2021): 153–84. https://doi.org/10.24908/encounters.v22i0.15072.
Gordon, D.L.A., and M. Janzen. “Suburban Nation? Estimating the Size of Canada’s Suburban Population.” Journal of Architectural and Planning Research 30, no. 3 (2013): 197–220. http://www.jstor.org/stable/43031005.
Government of Canada. “Canada’s International Education Strategy, 2014–2019.” https://www.international.gc.ca/education/assets/pdfs/overview-apercu-eng.pdf.
Grivet, C., M. Haj-Broussard, and R. Broome. “School Administrators’ Perspectives of French Immersion Programs.” Foreign Language Annals 54 (March 1, 2021): 114–38. https://doi.org/10.1111/flan.12512.
Hadim, H.A., and S.K. Esche. “Enhancing the Engineering Curriculum through Project-Based Learning.” Paper presented at the 32nd Annual Frontiers in Education Conference. Boston, MA: IEEE, November 6–9, 2002. https://doi.org/10.1109/FIE.2002.1158200.
Herhalt, C. “Private Schools Given Rapid Antigen COVID-19 Tests; Ontario Says They Can No Longer Be Used on Students.” CP24, September 10, 2021. https://www.cp24.com/news/private-schoolsgiven-rapid-antigen-covid-19-tests-ontario-says-they-can-no-longer-be-used-on-students-1.5580560.
Hernández-Ramos, P., and S. De La Paz. “Learning History in Middle School by Designing Multimedia in a Project-Based Learning Experience.” Journal of Research on Technology in Education 42, no. 2 (2009): 151–73. https://doi.org/10.1080/15391523.2009.10782545.
International Baccalaureate. “International Education.” https://www.ibo.org/.
Ioannidis, J.P.A. “Why Most Published Research Findings Are False.” PLoS Medicine 2, no. 8, e124 (2005): 696–701. https://doi.org/10.1371/journal.pmed.0020124.
Jacobson, A., D. Daly, S. Borden, N. Chanana, B. Colon, R. Finkelstein, D. Gascon, et al. “Single-Sex Education: A Public Policy Issue.” Project Report. Center for Advanced Study in Education, 1995. https://files.eric.ed.gov/fulltext/ED395545.pdf.
Livingston, G. “Pandemic Learning Gaps Have Parents Digging Deep to Put Their Kids in Private School.” Globe and Mail, June 18, 2022. https://www.theglobeandmail.com/investing/personal-finance/household-finances/article-private-school-enrollment-rising-can-you-afford-it/.
Lounsbery, M.A.F., and T.L. McKenzie. “Physically Literate and Physically Educated: A Rose by Any Other Name?” Journal of Sport and Health Science 4, no. 2 (2015): 139–44. https://doi.org/10.1016/j.jshs.2015.02.002.
Louv, R. Last Child in the Woods: Saving Our Children from Nature-Deficit Disorder. Chapel Hill, NC: Algonquin Books, 2008.
Marcus, P., D. Van Pelt, and T. Boven. “Pandemic Pivot: Christian Independent Schooling During the Initial 2020 Lockdown.” Cardus, June 2021. https://www.cardus.ca/research/education/reports/pandemic-pivot/.
Marcus, P., N. Brouwer, D. Van Pelt, T. Boven, and D. Hunt. “Pandemic Response: How Christian Independent Schools Responded to a Year of COVID-19.” Cardus, August 2021. https://www.cardus.ca/research/education/reports/pandemic-response-how-christian-independent-schools-responded-to-a-year-of-covid-19/.
McCarty, K. “Full Inclusion: The Benefits and Disadvantages of Inclusive Schooling; An Overview.” Azusa Pacific University, 2006. https://files.eric.ed.gov/fulltext/ED496074.pdf.
Moizumi, E. “Examining Two Elementary-Intermediate Teachers’ Understandings and Pedagogical Practices About Global Citizenship Education.” Ontario Institute for Studies in Education, University of Toronto, 2010. https://central.bac-lac.gc.ca/.item?id=MR72914&op=pdf&app=Library&oclc_number=1019483268.
Mojtehedzadeh, S., R. Mendleson, and A. Bailey. “Private Schools, Large Firms Won Big in Ontario’s Rapid Testing Program, While Hot Spots Lost Out, Star Analysis Finds.” Toronto Star, April 10, 2022. https://www.thestar.com/news/investigations/2022/04/10/just-20-of-rapid-tests-went-to-ontarios-covid-19-hot-spots-star-analysis-finds.html.
National Research Council. Successful STEM Education: A Workshop Summary. Washington, DC: National Academies Press, 2011. https://doi.org/10.17226/13230.
Oberle, E., M. Zeni, F. Munday, and M. Brussoni. “Support Factors and Barriers for Outdoor Learning in Elementary Schools: A Systemic Perspective.” American Journal of Health Education 52, no. 5 (2021): 251–65. https://doi.org/10.1080/19325037.2021.1955232.
Office of the Auditor General of Ontario. “Private Schools.” Annual Report. Ministry of Education, 2013. https://www.auditor.on.ca/en/content/annualreports/arreports/en13/306en13.pdf.
Ontario Ministry of Children. “Regional Offices for the Ministry of Children, Community, and Social Services.” Government of Ontario, April 2022. https://www.ontario.ca/page/regional-offices-ministry-children-community-and-social-services.
Ontario Ministry of Education. “Private School Contact Information.” Government of Ontario, April 2022. https://data.ontario.ca/dataset/private-school-contact-information.
———. “Private School Enrolment by Gender.” Government of Ontario, April 2022. https://data.ontario.ca/en/dataset/private-school-enrolment-by-gender.
———. “Private Schools: Policies and Procedures Manual.” 2013, https://files.ontario.ca/edu-private-schools-policy-procedures-manual-2013-en-2021-11-25.pdf.
———. “Private Schools That Have Closed.” Government of Ontario, July 2022. https://www.ontario.ca/page/private-schools-have-closed.
———. “Regional Offices School Boards.” Government of Ontario,February 2022, https://www.ontario.ca/page/regional-offices-school-boards.
Ontario Public School Boards’ Association. “Indigenous Education.” In Guide to Good Governance 2018–2022, 92–99. https://www.opsba.org/wp-content/uploads/2021/02/OPSBA_Good_Governance_Guide_2018-2022_Chapter6.pdf.
Organisation for Economic Co-operation and Development (OECD). “Public and Private Stakeholders.” OECD Education GPS, 2021. https://gpseducation.oecd.org/revieweducationpolicies/#!node=44129&filter=all.
Oxford, R.L., and C. Gkonou. “Interwoven: Culture, Language, and Learning Strategies.” Studies in Second Language Learning and Teaching 8, no. 2 (2018): 403–26. https://doi.org/10.14746/ssllt.2018.8.2.10.
Patrick, S., K. Kennedy, and A. Powell. “Mean What You Say: Defining and Integrating Personalized, Blended and Competency Education.” International Association for K–12 Online Learning, 2013. https://files.eric.ed.gov/fulltext/ED561301.pdf.
Pizarro Milian R., and S. Davies. “Open Competition or Balkanized Coexistence? The Effects of Market Segments on Toronto Private Schools.” Education Policy Analysis Archives 25, no. 39 (2017): 1–24. http://dx.doi.org/10.14507/epaa.25.2687.
Priest, S., and M. Asfeldt. “The History of Outdoor Learning in Canada.” International Journal of the History of Sport 39, no. 5 (2022): 489–509. https://doi.org/10.1080/09523367.2022.2083108.
Reggio Emilia Approach. “Values.” 2022. https://www.reggiochildren.it/en/reggio-emilia-approach/valori-en/.
Sayers, D. “The Lost Tools of Learning.” Hibbert Journal: A Quarterly Review of Religion, Theology, and Philosophy 46 (1948).
Smith, E.A. “Failing the Failed: A Treatise on the Need for a Research Based Pedagogical Approach to Credit Recovery.” PhD diss., University of Central Florida, 2014. https://stars.library.ucf.edu/etd/6674.
Srivastava, A., and S.B. Thomson. “Framework Analysis: A Qualitative Methodology for Applied Policy Research.” Journal of Administration and Governance 4, no. 2 (2009): 72–79.
Statistics Canada. “Census Profile, 2016.” Catalogue no. 98-316-X2016001. November 29, 2017. https://www150.statcan.gc.ca/n1/en/catalogue/98-316-X2016001.
———. “Dictionary, Census Population, 2016.” October 11, 2018. https://www12.statcan.gc.ca/census-recensement/2016/ref/dict/98-301-x2016001-eng.pdf.
———. “Population and Dwelling Counts, for Canada, Provinces and Territories, and Population Centres, 2016 and 2011 Censuses (Table).” 2017. https://www.12.statcan. gc.ca/census-recensement/2016/dp-pd/hlt-fst/pd-pl/Tables/File.cfm?T=801&SR=1&RPP=100&PR=35&CMA=0&CSD=0&S=3&O=D&Lang=Eng&OFT=CSV.
———. “Table 98-10-0011-01: Population and Dwelling Counts: Canada and Population Centres.” February 2022. https://www150.statcan.gc.ca/t1/tbl1/en/tv.action?pid=9810001101.
———. “Table 37-10-0109-01: Number of Students in Elementary and Secondary Schools, by School Type and Program Type.” April 2022. https://www150.statcan.gc.ca/t1/tbl1/en/tv.action?pid=3710010901.
Stirling, D.L. “Distributed Learning Environments.” December 8, 1997. http://www.stirlinglaw.com/deborah/DLE.htm.
Stufft, C.J. “Reading to the Rhythm: Integrating Music into Literacy Instruction.” English in Texas 45, no. 1 (2015): 21–26.
Teotonio, I., K. Rushowy, and B. Martens. “Ontario Stays Firm on Ending School Mask Mandates.But Some Private Schools Will Keep Them.” Toronto Star, March 17, 2022. https://www.thestar.com/news/gta/2022/03/17/ontario-stays-firm-on-ending-school-mask-mandates-but-some-private-schools-will-keep-them.html.
Timothy, T., T.S. Chee, L.C. Beng, C.C. Sing, K.J. Hwee Ling, C.W. Li, and C.H. Mun. “The SelfDirected Learning with Technology Scale (SDLTS) for Young Students: An Initial Development and Validation.” Computers & Education 55, no. 4 (2010): 1764–71. https://doi.org/10.1016/j.compedu.2010.08.001.
Toprani, D., M. Borge, and Y. Xia. “Supporting SEL in Progressive Design Contexts.” Paper presented at the 13th International Conference of Learning Sciences. London, UK: June 23–27, 2018. https://repository.isls.org/bitstream/1/740/1/399.pdf.
Turcotte, M. “Life in Metropolitan Areas.” Statistics Canada, April 2014. https://www150.statcan.gc.ca/n1/pub/11-008-x/2008001/article/10459-eng.htm.
UNESCO. “What Is Global Citizenship Education?” January 9, 2018. https://en.unesco.org/themes/gced/definition.
National Center for Education Statistics. “Private School Universe Survey (PSS).” US Department of Education, 2019–20. https://nces.ed.gov/surveys/PSS/.
Van Pelt, D., and P.J. Mitchell. “Mapping Independent School Associations in Canada.” Cardus, September 2018. https://www.cardus.ca/research/education/reports/mapping-independent-school-associations-in-canada/.
Walker, K. “Fine Arts Education.” Research Brief, Education Partnerships, January 3, 2006. https://files.eric.ed.gov/fulltext/ED537918.pdf.
Yang, J. “Star Investigation: Slacking Off Gets High Marks at This ‘High School.’” Toronto Star, September 16, 2011. https://www.thestar.com/news/gta/2011/09/16/star_investigation_slacking_off_gets_high_marks_at_this_high_school.html.